
Customizing reports in Google Analytics (GA4) is essential for making sense of your website or app data.
GA4 has fewer default reports than Universal Analytics but includes great features to customize the reporting interface.
In this guide, you’ll learn how to edit, filter, and structure reports using GA4’s built-in tools like the Library, Report Editor, and Collections.
Before you get started, here’s a quick overview of what you can customize in GA4 reports and how each element works:
| Element | What You Can Do |
|---|---|
| Dimensions | Set the primary dimension for data grouping |
| Metrics | Choose which metrics to display in the table |
| Filters | Limit the report to specific data (e.g. device, hostname) |
| Charts | Show or hide visual charts (bar, line, scatter) |
| Cards | Add summary cards or widgets (in overview reports) |
| Report Name | Rename the report for clarity |
| Collections | Group reports into sidebar sections |
| Topics | Organize reports within each collection |
| Publishing | Make reports visible in the GA4 navigation |
📊 If you’re tired of switching between GA4, ad platforms, and dashboards, Analyzify gives you a full marketing analytics dashboard inside your Shopify admin. All your key e-commerce reports, in one place.
What Are Customizable Reports in Google Analytics (GA4)?
Before understanding how to customize reports in Google Analytics (GA4), it’s important to understand what types of reports GA4 offers, and which ones you can actually modify.
In GA4, there are two main types of standard reports:
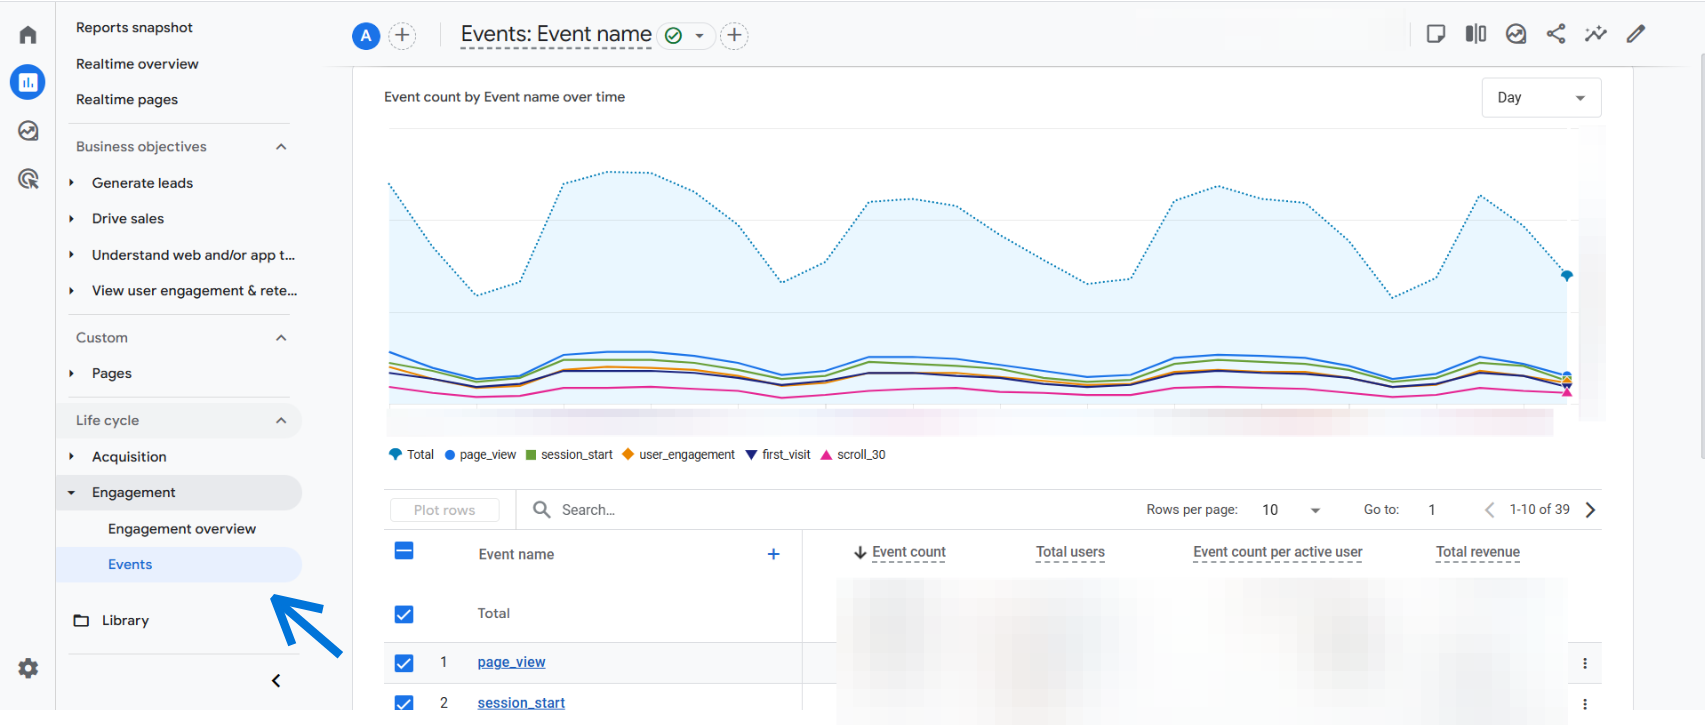
- Detail reports: Focused on tables and visual charts (e.g., Reports > Engagement > Events)
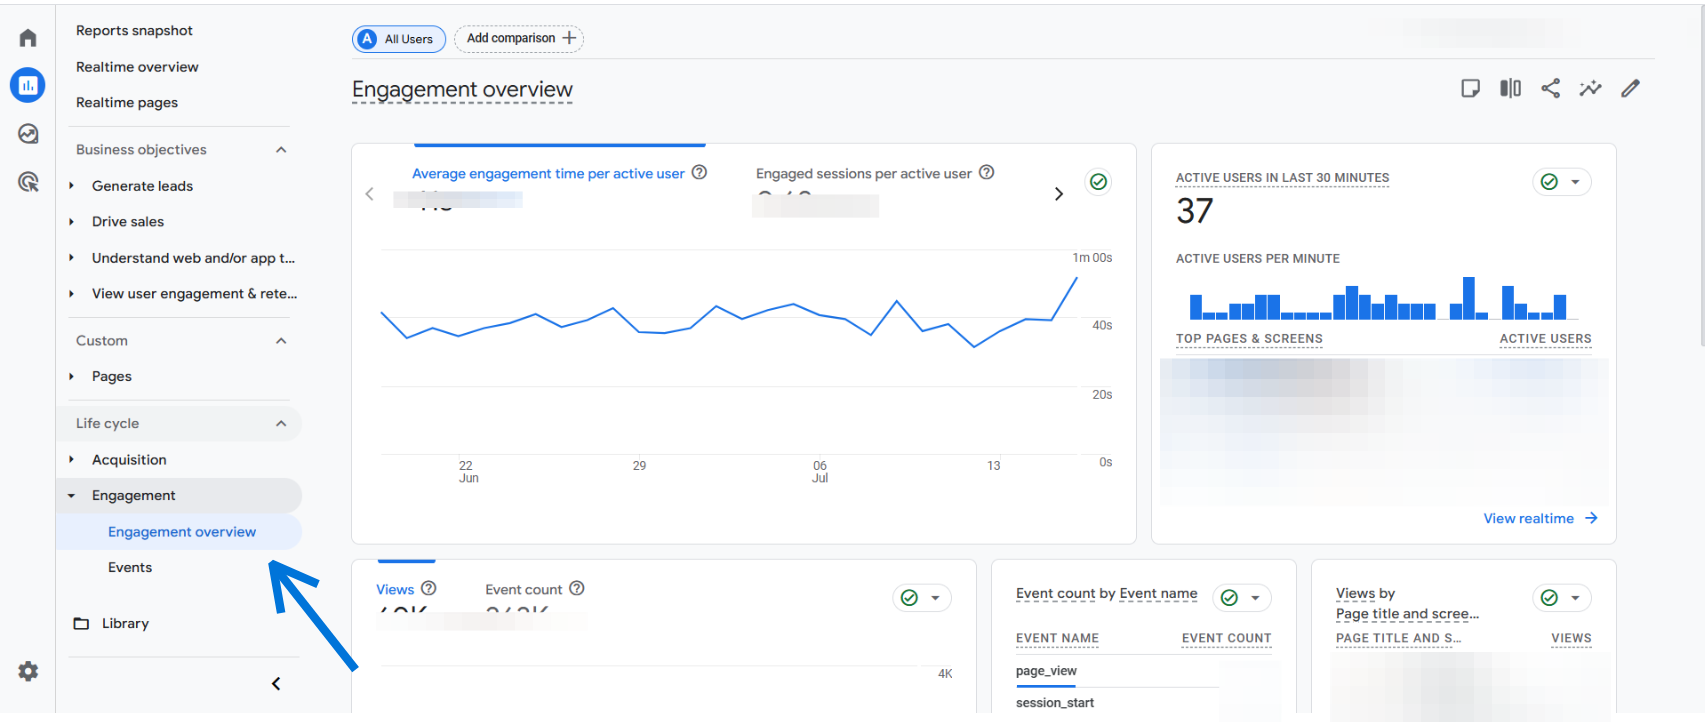
- Overview reports: Display summary cards or widgets (e.g., Reports > Engagement > Overview)
When we talk about how to customize reports in Google Analytics (GA4), we’re referring specifically to the standard reports found in the “Reports” section of the left-hand menu, not to be confused with “Explorations”, which offer deeper but separate analysis capabilities.
You can edit both overview and detail reports to some extent: change dimensions, select metrics, apply filters, rearrange components, and even hide charts.
While there are limitations (such as no support for secondary dimensions), these customization features still allow you to shape GA4’s interface around your business needs.
🎯Bonus Content: Want to take your GA4 reports even further? Check out our guide on Creating Ecommerce Segments in Google Analytics 4 (GA4) to learn how to set up useful segments for both basic and advanced ecommerce analysis.
How to Customize Reports in Google Analytics (GA4)
To customize reports in Google Analytics (GA4), you need the right access. Only users with Editor or Administrator roles can create or modify standard reports. If you don’t see customization options, check your permission level first.
There are two main entry points for customizing reports in GA4:
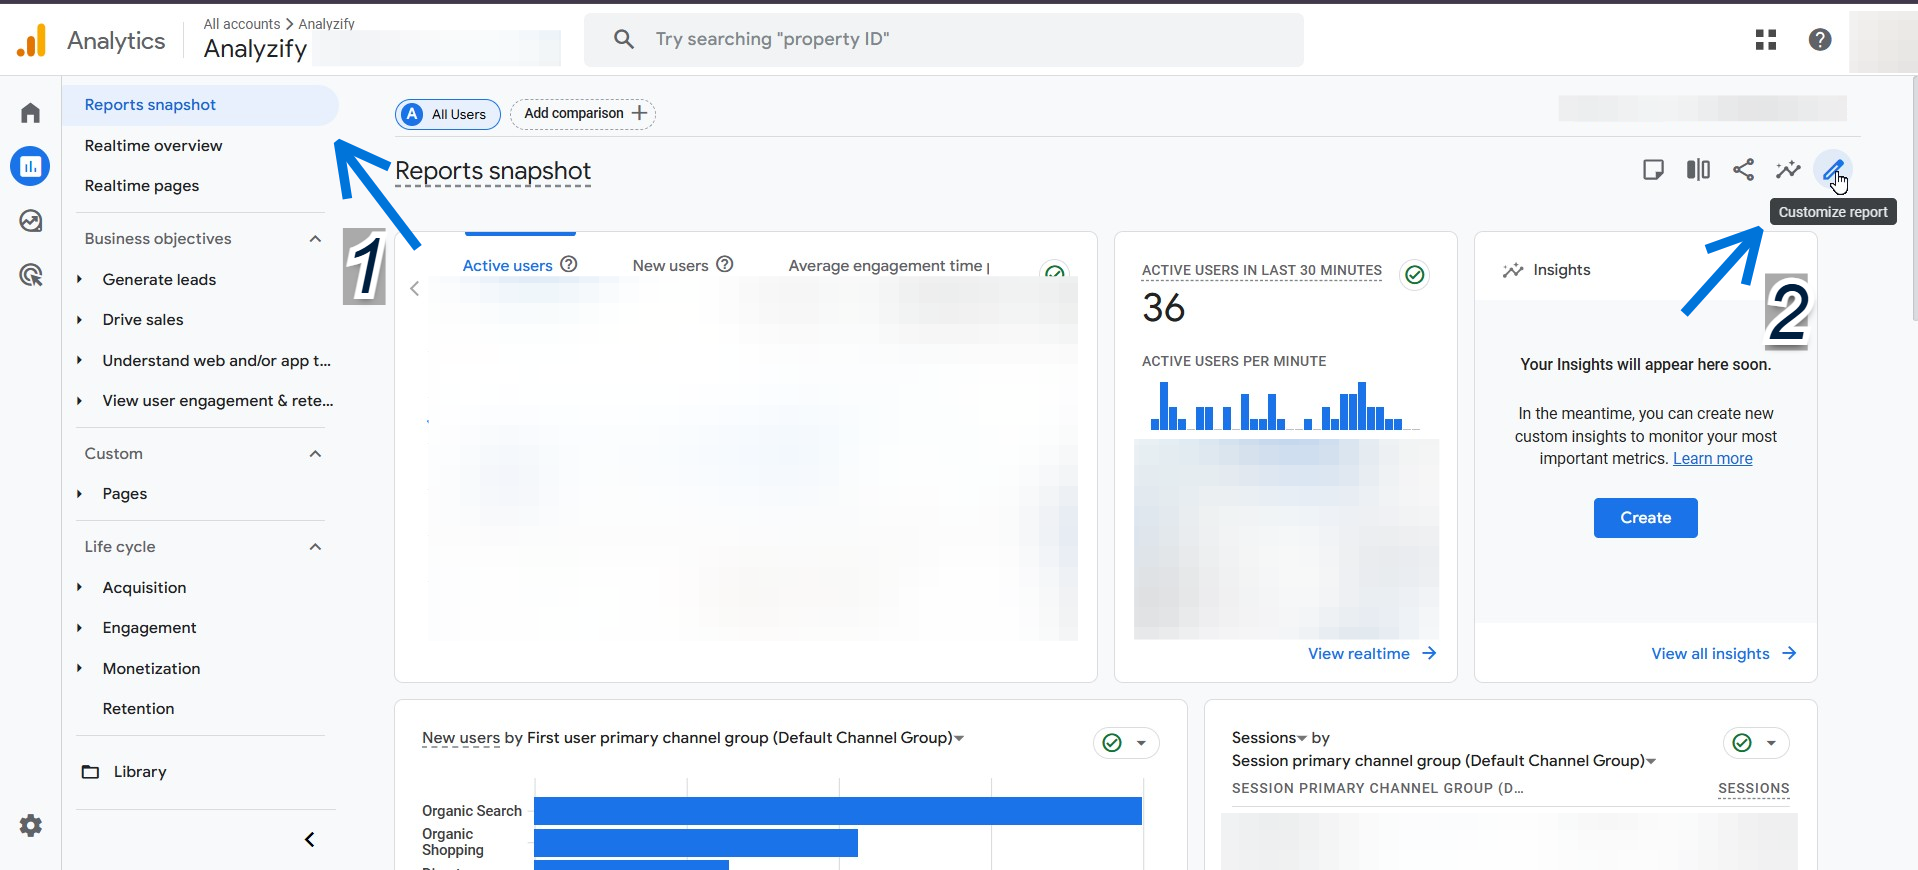
- From an existing report: Navigate to any standard report in the “Reports” section and click the Customize report button in the top-right corner. This lets you adjust that specific report directly.
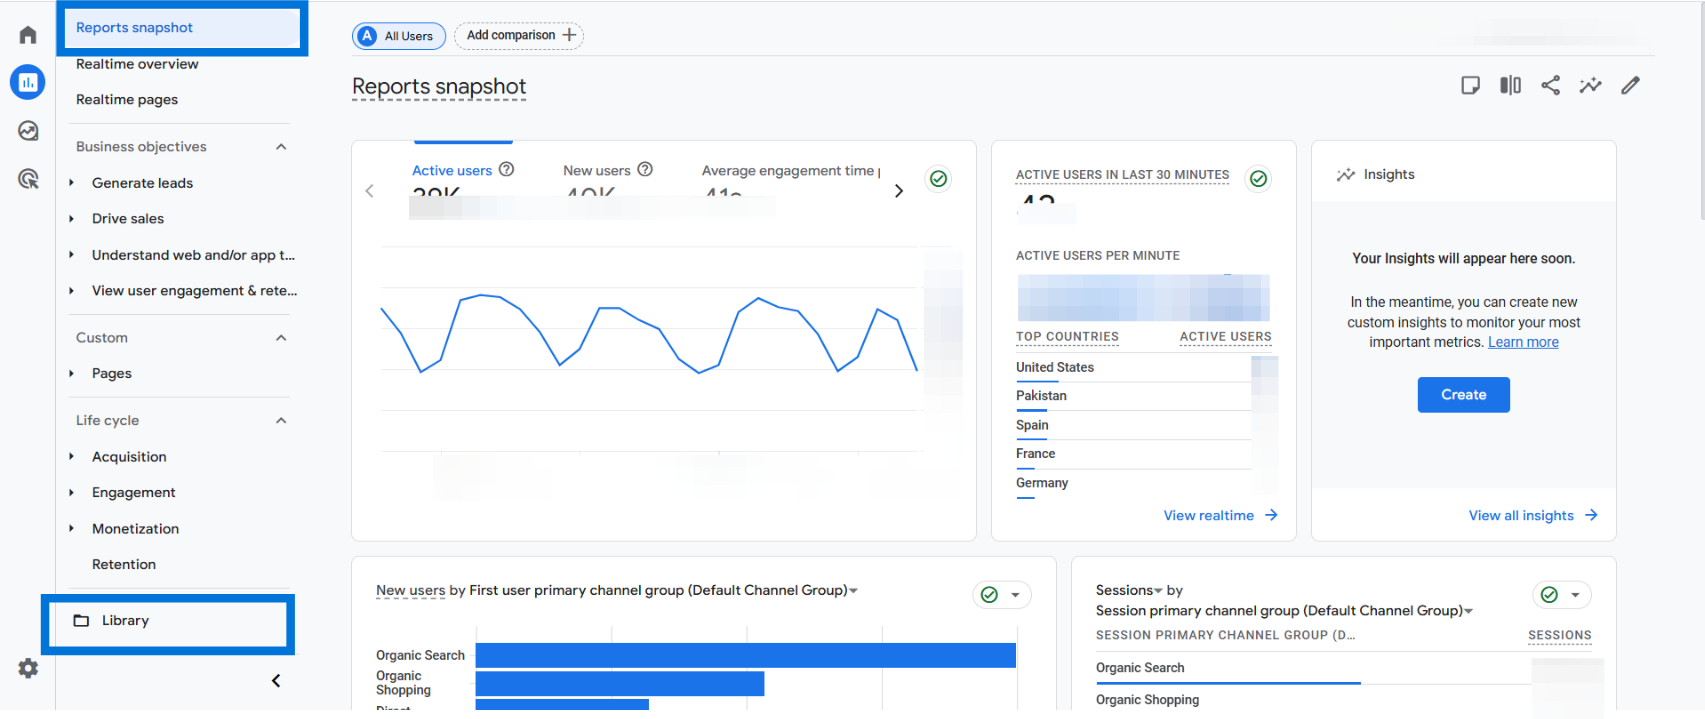
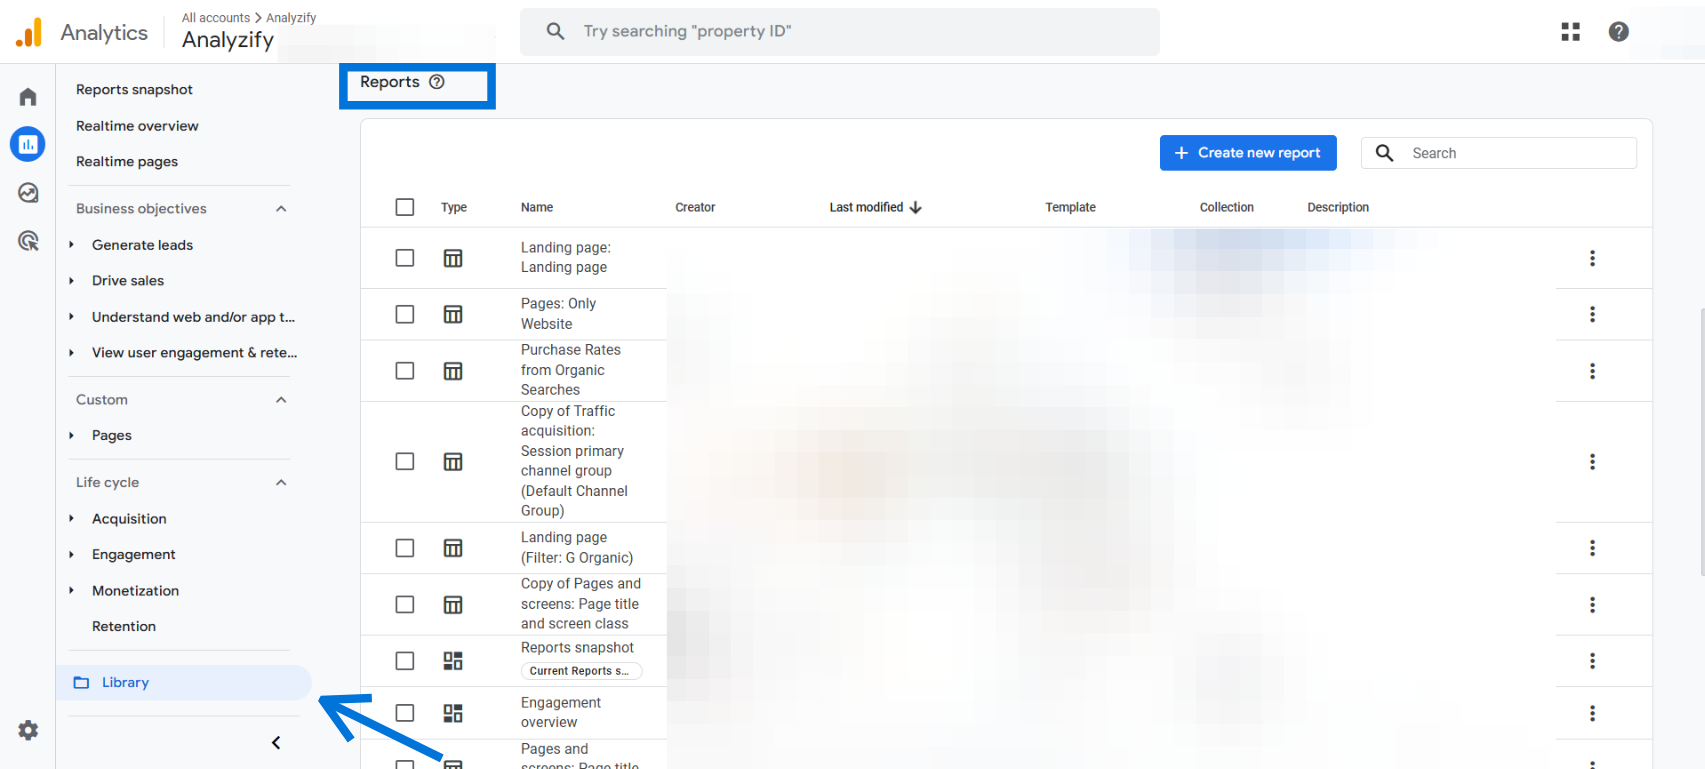
- From the Library: Go to Reports > Library to manage all your standard reports. Here, you can edit existing ones, create brand new reports from scratch or templates, organize them into collections, and control which ones appear in the left-hand menu.
Understanding these two methods is key if you want to fully customize reports in Google Analytics (GA4).
While both routes give you similar editing options, the Library Reports offers broader control over visibility, grouping, and report structure.
How to Customize Reports in GA4 Using the Library
Once you’ve customized a report in GA4, the next step is to manage its visibility and structure using the Library.
This is where you decide which reports are visible in the left-hand navigation and how they’re organized.
What Is the GA4 Library?
The Library is a central workspace for organizing standard reports. It lets you:
- Create new reports
- Group reports into topics
- Add reports to collections
- Publish or unpublish reports
- Reorder or remove content from the sidebar
This makes the Library essential if you want your customized reports to be accessible and neatly organized.
🎯 Bonus Content: Learn how to use GA4 to track content effectiveness with detailed reports on user engagement, scrolls, and page views.
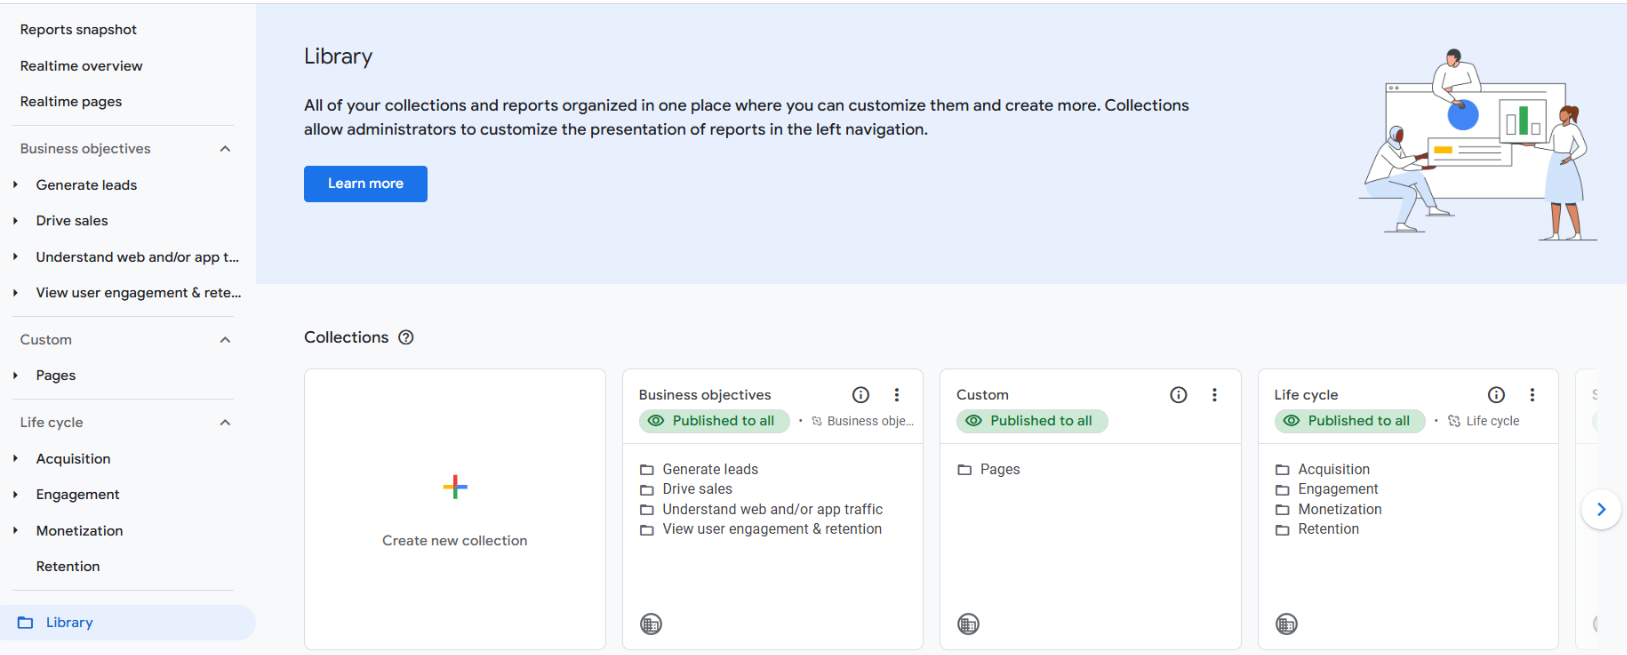
Key Concepts of Library in GA4
- Collection: A high-level grouping of reports (e.g., Lifecycle, User). These appear in the left-hand GA4 menu.
- Topic: A sub-group inside a collection (e.g., Acquisition, Engagement). Each topic contains individual reports.
By default, GA4 includes two published collections: Lifecycle and User. But you can create your own.
How to Access and Use the Library Reports
To open the Library, go to Reports > Library. Here’s what you can do:
- View existing collections
- Create new collections or topics
- Edit collections to include your custom reports
- Publish changes to make them visible to all users
If you’ve saved a custom report but don’t see it in the sidebar, it’s probably unpublished. Drag it into a collection, save, and publish to make it visible.
The Library gives you full control over how users navigate GA4, and that’s a major benefit when you customize reports in Google Analytics (GA4).
How to Customize Reports in Google Analytics (GA4) from Scratch
Beyond editing existing reports, you can also create entirely new ones from scratch.
This is especially useful when the default reports don’t meet your needs, like when you want to focus on a single subdomain or isolate a specific traffic segment.
Follow these steps to create a new custom report in Google Analytics (GA4):
This process is the foundation of how to customize reports in Google Analytics (GA4) in a scalable and organized way.
How To Get Accurate Data for Custom GA4 Reports
Customizing reports in Google Analytics (GA4) only makes an impact when your data is accurate and complete. That’s why your tracking setup matters.
Analyzify connects your Shopify store to over 10 data destinations, including Google Analytics 4, Google Ads, Meta (Facebook) CAPI, TikTok, Bing, BigQuery, and more, so your reports are built on clean, enriched, and consistent data.
With built-in integrations and server-side tracking support, Analyzify helps you:
- Improve data quality for your GA4 custom reports
- Track key events like purchases with up to 98% accuracy
- Enable advanced reporting through BigQuery and server-side events
- Manage all marketing and analytics tags via Google Tag Manager
If you want your GA4 custom reports to reflect real performance, start by building on trustworthy data.
 Built for Shopify - No Dev Work Required - Fast Setup
 Standart Tracking Methods Aren't Enough for Shopify
Let Analyzify combine client-side and server-side tracking. So you capture every important event, even when browser script fail.Examples of Customized Reports in Google Analytics (GA4)
Now that you understand the mechanics, let’s look at some practical examples. These use cases show exactly how to customize reports in Google Analytics (GA4) to match real-world needs.
1. Report for Mobile Traffic Only
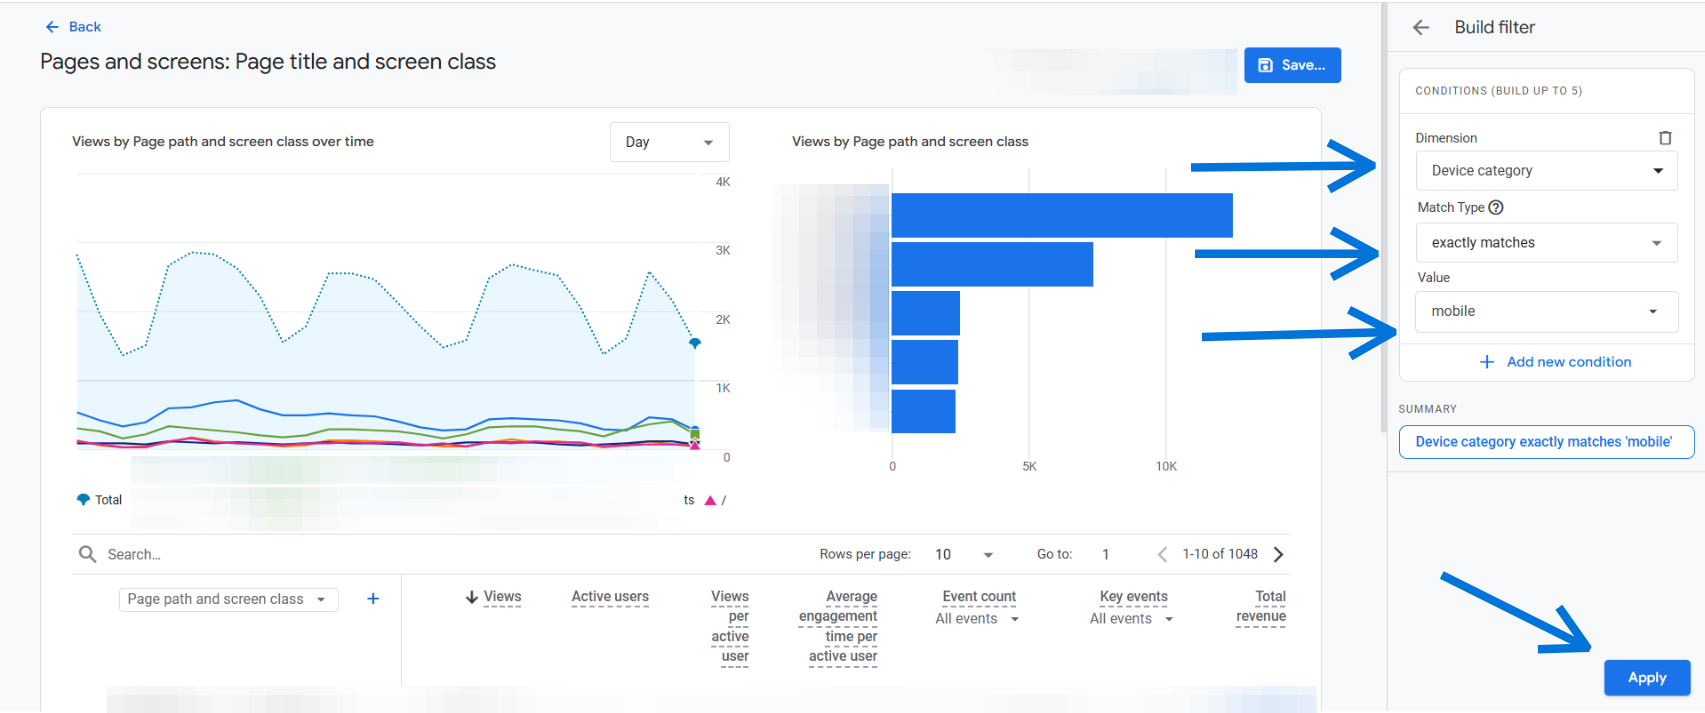
Want to analyze how mobile users interact with your site? Start with Reports > Engagement > Pages and click Customize report.
- Add a filter: Device category = mobile
- Save as a new report, e.g., “Mobile Page Views”
- Go to the Library, add it to your Engagement topic, and publish
Now, you’ve got a dedicated report for mobile traffic, no need to reapply filters each time.
2. Subdomain-Specific Traffic Sources
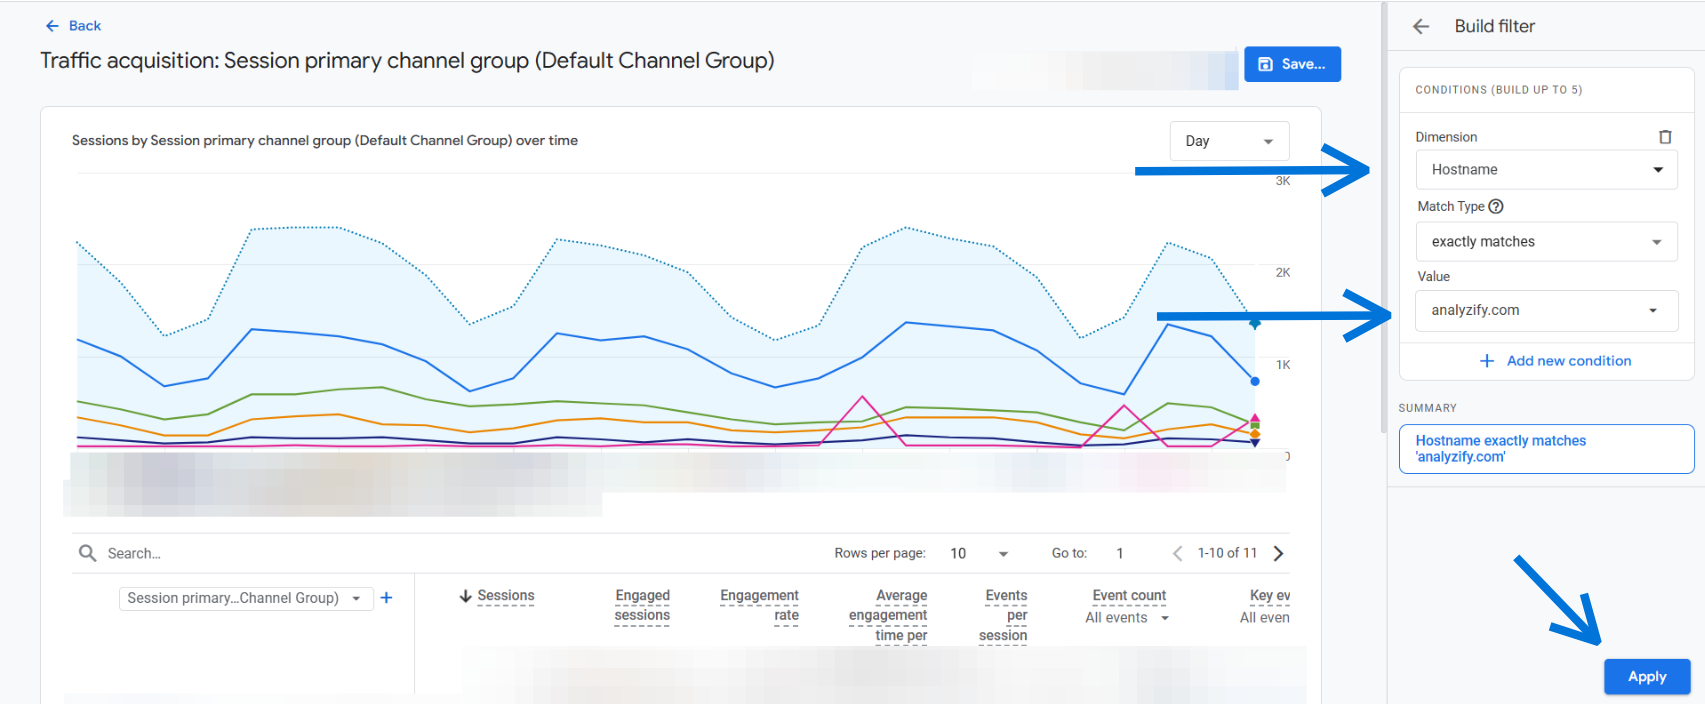
Let’s say your GA4 property tracks multiple subdomains, but you want a report focused only on one.
- Create a new report using the Traffic acquisition template
- Add a filter: Hostname = blog.yoursite.com
- Save and name the report, then add it to a custom collection
- Publish the collection to make it visible in the sidebar
This setup mimics the “View” structure from Universal Analytics.
3. Site Search Terms
If you track search activity on your site (via the view_search_results event), you can build a focused report on search behavior.
- Create a new detail report from a blank template
- Set primary dimension as Search term
- Add metrics like Event count, Total users
- Apply filter: Event name = view_search_results
- Hide charts if unnecessary, save, and publish
This gives you a clean report showing what users search for most.
4. Google Search Console Integration
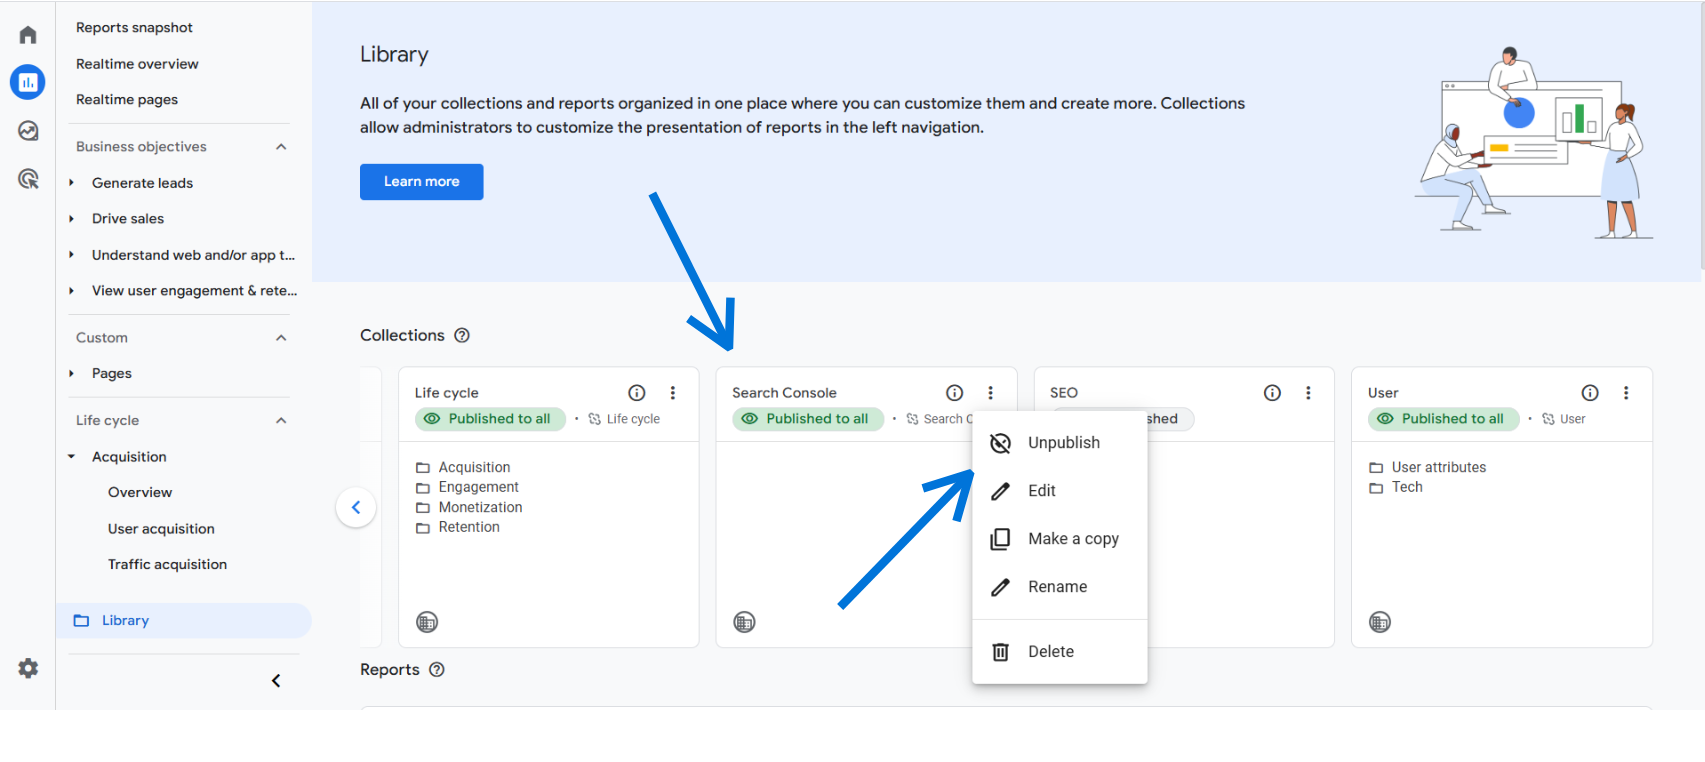
Once you connect Search Console to GA4, it creates a new collection. However, it won’t appear in the menu until you manually publish it.
- Go to Reports > Library
- Look for the Search Console collection
- Click the three dots and select Publish
This makes search performance data instantly accessible from the main GA4 navigation.
These examples highlight how you can customize reports in Google Analytics (GA4) to solve specific reporting challenges. With just a few steps, you can surface the exact insights you need, without switching to Explorations.
Limitations of GA4 Report Customization
While the ability to customize reports in Google Analytics (GA4) is a major improvement over static dashboards, it still comes with some notable limitations. Understanding these gaps will help you set realistic expectations, and avoid wasted time.
- No Support for Secondary Dimensions: Currently, you can only define one primary dimension per report. There’s no way to display multiple dimensions side by side like in Universal Analytics. This restricts deeper breakdowns unless you use Explorations or BigQuery.
- Limited Chart Customization: GA4 offers only three chart types: bar, line, and scatter. Even worse, these visualizations display just the top 5 rows of data. For most use cases, especially trend tracking, the charts are more decorative than functional.
- No Cross-Property or Bulk Report Duplication: There’s no built-in way to export or clone custom reports across multiple properties. If you’re managing several GA4 setups (like agencies do), you’ll need to recreate reports manually in each one.
- Feature Availability Varies by Property: Some features, like key metrics in Overview reports or summary cards, may be available in one property but missing in another. Google hasn’t made this behavior fully transparent.
- Collection Order Can’t Be Customized: You can create and publish collections, but you can’t rearrange their order in the sidebar. This makes navigation harder if you rely heavily on custom groupings.
Conclusion: Customizing Reports in Google Analytics (GA4)
Knowing how to customize reports in Google Analytics (GA4) gives you control over your data presentation, allowing you to focus on what matters.
The process takes a few extra steps, especially with filters and publishing, but once you get used to the flow, it becomes an essential part of your analytics workflow.
If you’re managing a team or multiple properties, building a consistent system for custom reports will save you time and improve clarity across the board. And when default reports fall short, you’ll know exactly how to build your own.