
Tracking profit on Shopify is not as straightforward as it might seem. While the platform offers basic financial reports, many merchants realize too late that the numbers don’t tell the full story. Shopify’s built-in reports are useful for a quick glance at product margins, but they often leave out essential cost data that affects actual profitability.
Here are 5 key takeaways:
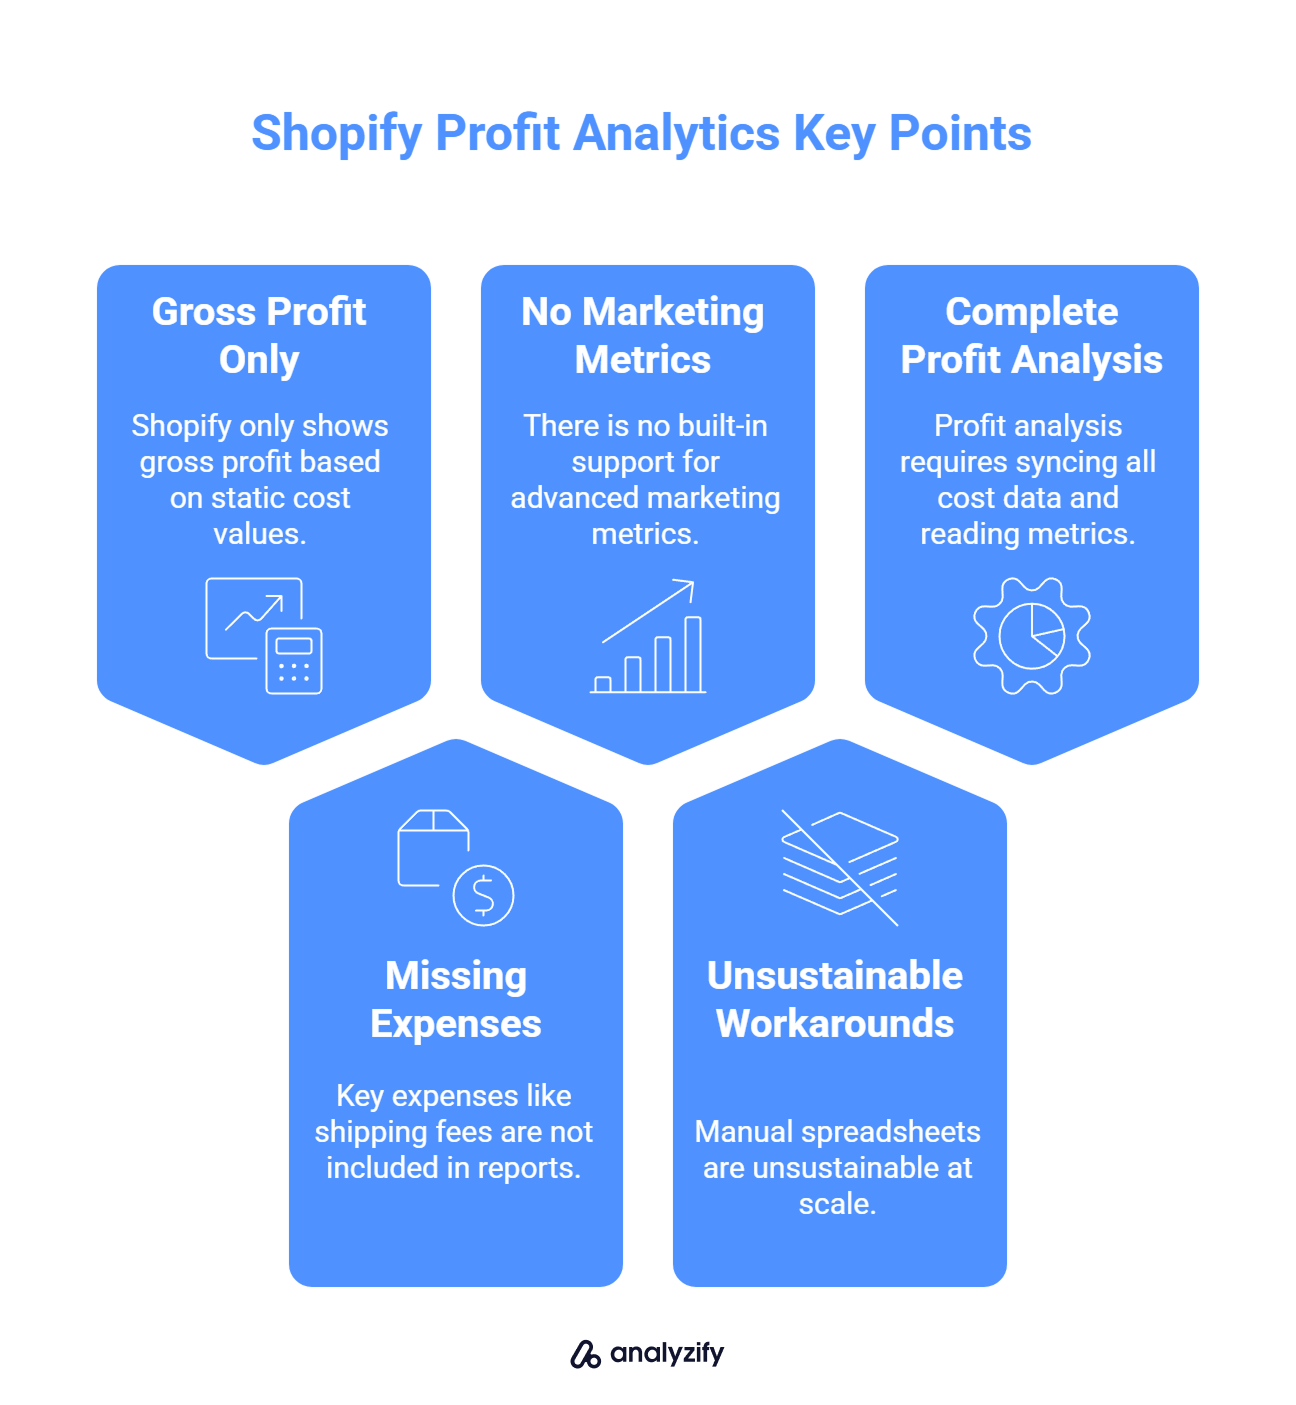
✅ Shopify does not calculate net profit, it only shows gross profit based on static cost values.
✅ Key expenses like shipping fees, ad spend, and transaction costs are not included in native reports.
✅ There is no built-in support for advanced marketing metrics such as MER or nCAC.
✅ Manual workarounds like spreadsheets are common but become unsustainable at scale.
✅ A complete profit analysis requires syncing all cost data and reading metrics in context, not in isolation.
Let’s begin by looking at what Shopify’s reports do include and where those limits begin.
What Shopify’s Profit Reports Actually Show
Shopify’s native reports include a basic set of profit-related metrics. These can help you see product-level performance but fall short when it comes to a complete business overview.
You can access these under: Analytics → Reports → Category filter → Profit Margin
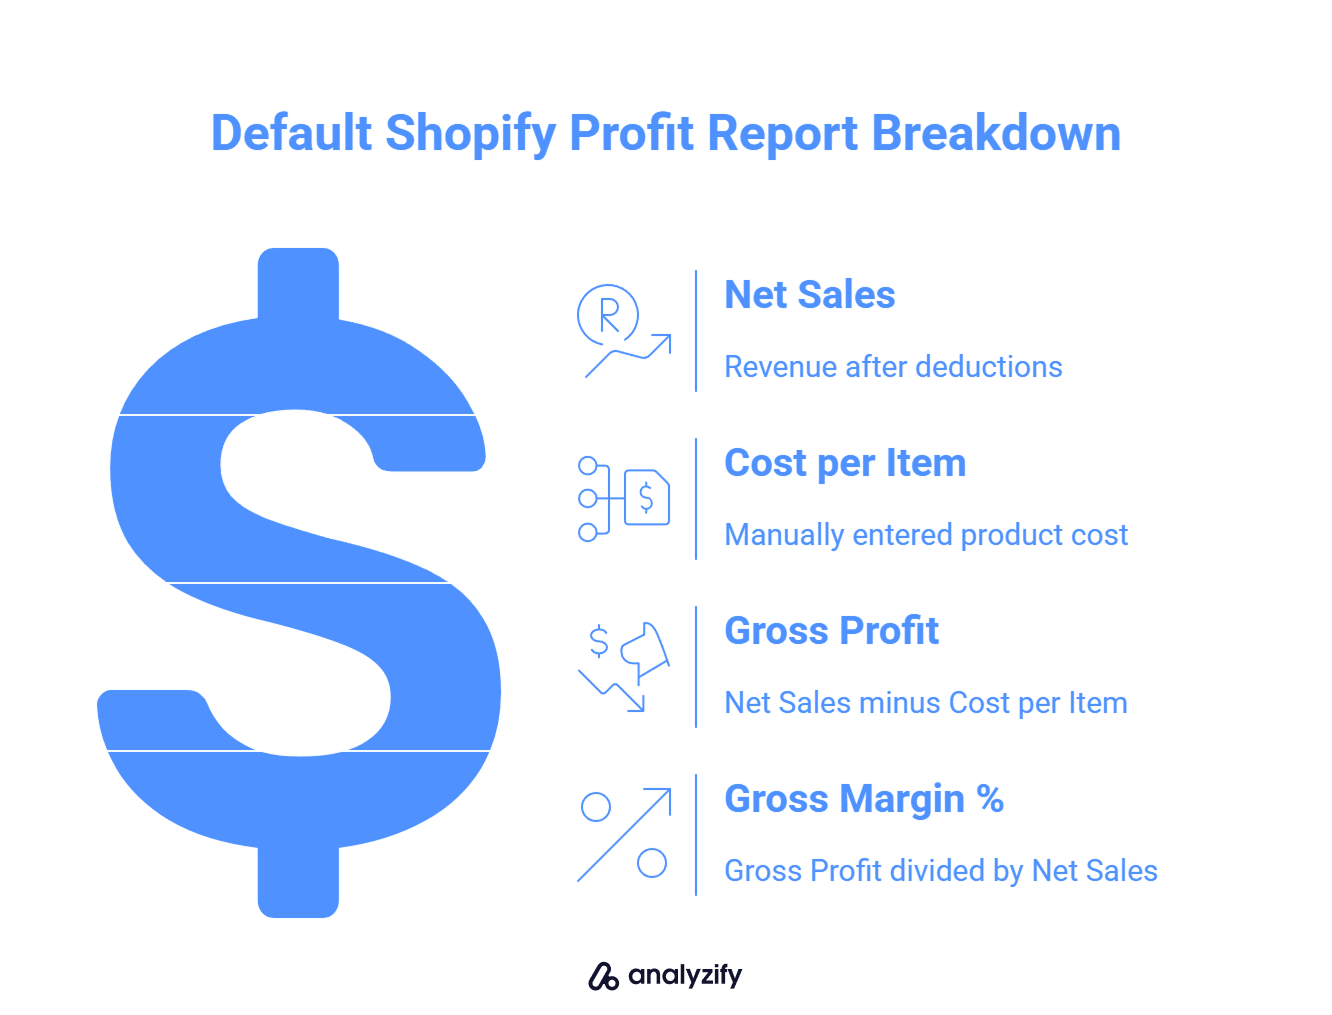
The default Profit Margin reports typically include:
Net Sales – Revenue after discounts, returns, and taxes
Cost per Item – A static value entered manually per product
Gross Profit – Net Sales minus Cost per Item
Gross Margin % – Gross Profit divided by Net Sales
These reports are filterable by product, variant, POS location, and date range. They give a helpful starting point for understanding which items generate better markup.
However, this is as far as the built-in reports go. They do not reflect the full cost of doing business and for many merchants, that creates blind spots in decision-making.
Bonus: What Is GMV And How Does It Work
Key Profit Metrics Shopify Doesn’t Track by Default
While Shopify tracks gross profit, it does not provide a true profit and loss view. Several key cost factors are excluded by default, which means you may be overestimating your store’s profitability if you rely on these reports alone.
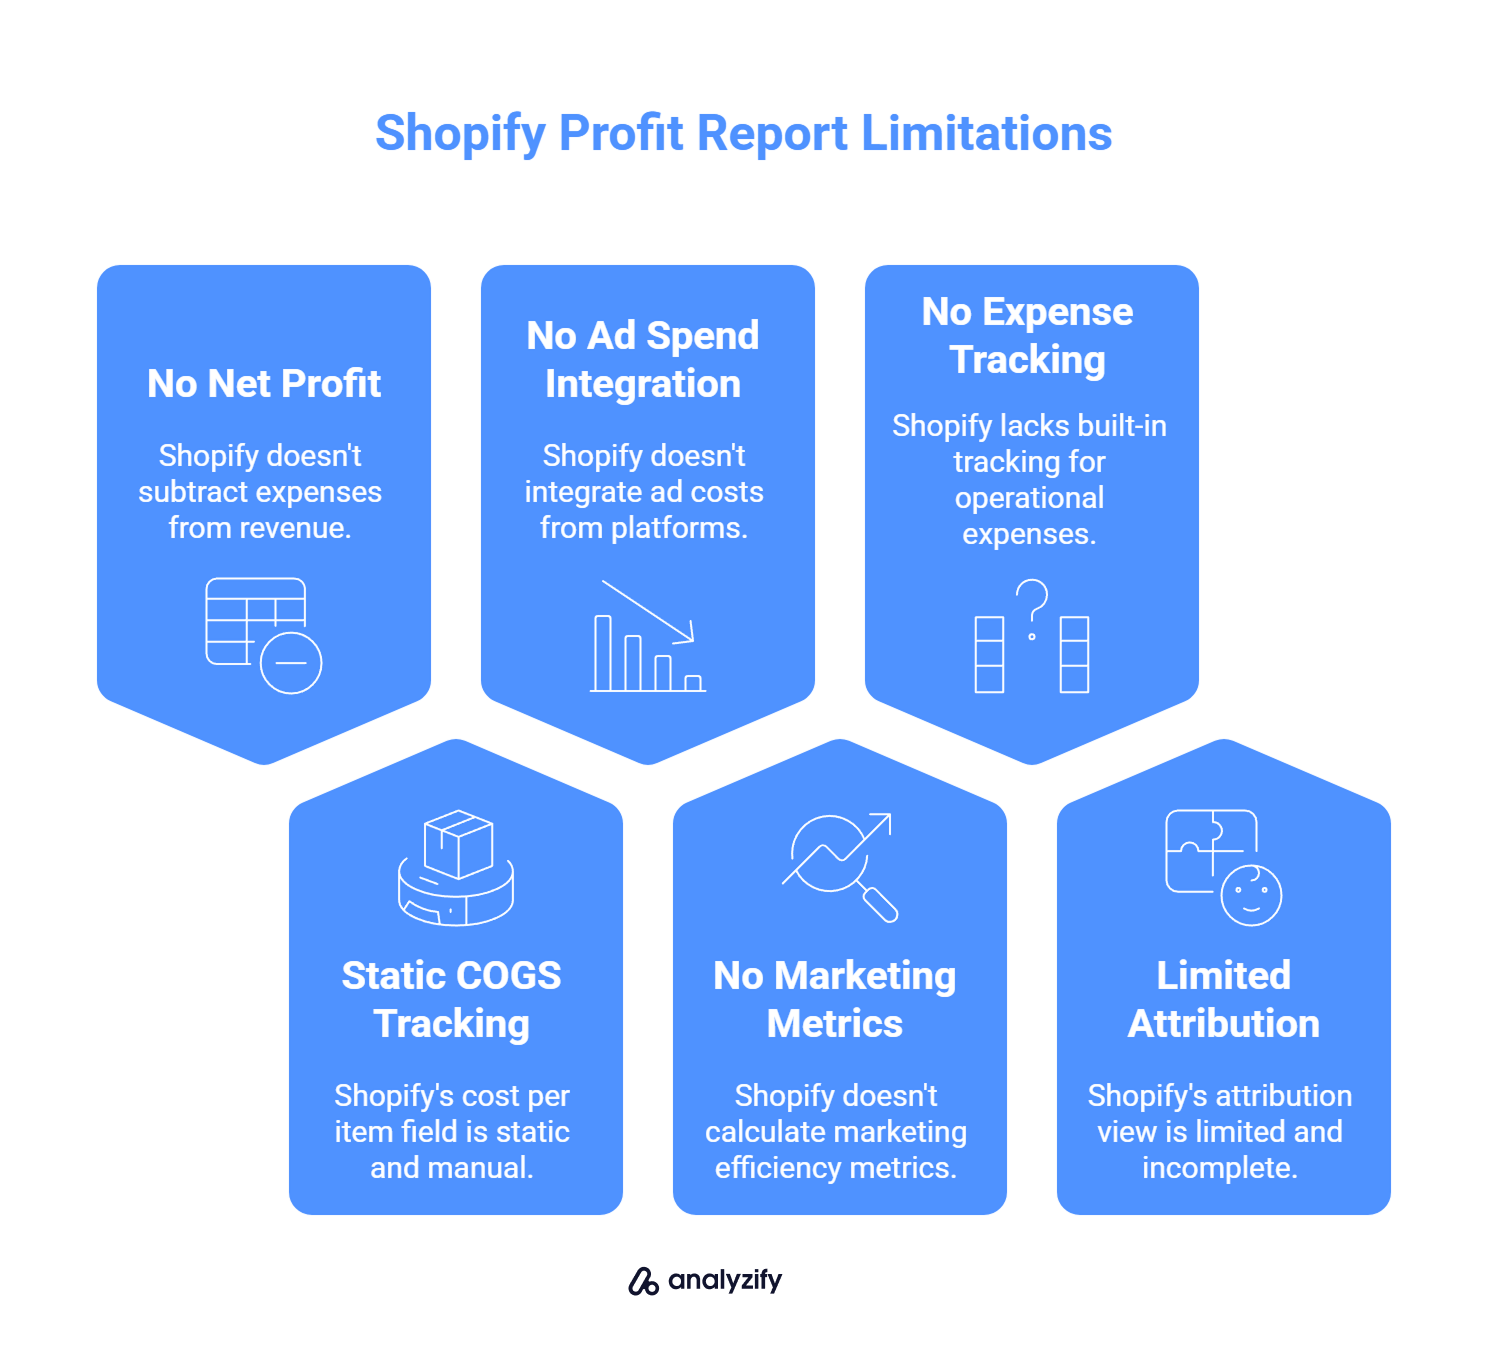
Here are the main limitations:
- No Net Profit Calculation
Shopify does not subtract ad spend, transaction fees, shipping costs, or app subscriptions from revenue. Net profit, the most important metric, is not available natively.
- No Dynamic COGS Tracking
Shopify uses a static “cost per item” field that must be updated manually. It does not adjust based on supplier changes, regional shipping, or fulfillment variations.
- No Ad Spend Integration
Shopify doesn’t pull in ad costs from platforms like Meta, Google, or TikTok. This makes it impossible to evaluate profitability by channel or campaign using Shopify alone.
- No Marketing Efficiency Metrics
Metrics like MER (Marketing Efficiency Ratio) and nCAC (New Customer Acquisition Cost) are not calculated in Shopify. These are essential for understanding how well your ad spend converts into revenue.
- No Operational Expense Tracking
There is no built-in place to track custom fees, refunds, or payment processing charges. These small but recurring costs affect your bottom line over time.
- No Multi-Channel Attribution Support
Shopify’s attribution view is limited. You can’t see the full customer journey or understand which channels influenced a sale unless you use additional tools.
These missing elements explain why many merchants feel surprised when revenue is high but profit remains low. Without a full view of all costs, even successful campaigns or products can appear more profitable than they actually are.
Bonus: Learn Why GA4 Revenue Doesn’t Match Shopify (And How to Improve It)
Why These Gaps Matter for Profit Accuracy
Understanding what Shopify doesn’t track is only part of the problem. The real impact shows up when decisions are made based on incomplete or misleading data.
Here’s why these gaps create risk:
![]()
High revenue doesn’t guarantee strong profit
You might see a sharp increase in sales and assume your business is growing, but without accounting for rising ad costs, shipping fees, or return rates, your margins may actually be shrinking. Shopify’s default reports don’t reveal this unless you do the math yourself.
Gross profit can give false confidence
Since Shopify uses fixed COGS values and doesn’t account for operational costs, gross profit can appear healthy even when net profit is close to zero. This disconnect becomes especially noticeable during peak seasons or large campaigns when costs fluctuate.
You can’t identify loss-making products or campaigns
A product might be driving high sales but losing money due to fulfillment or ad costs. Without detailed profit attribution, this won’t be obvious. Shopify’s native data doesn’t flag these situations and that can lead to scaling unprofitable efforts.
You miss the opportunity to react early
If a new ad campaign has high spend and low return, it won’t stand out in Shopify’s default views. But if you were tracking MER and nCAC, you’d spot this quickly and adjust. The lack of visibility delays decision-making and increases financial risk.
To see a clear example, imagine this breakdown:
Your product sells for $50
Shopify shows $20 cost per item, so it reports $30 gross profit.
But you also spent:
$18 on Meta ads
$5 on shipping
$2 in transaction fees
Your actual profit is only $5, yet Shopify will show $30 unless you track the rest manually.
This kind of distortion makes it hard to know which efforts are helping or hurting your bottom line.
Manual Workarounds: Spreadsheets and Their Limitations
To close the gaps in Shopify’s reports, many merchants turn to spreadsheets. This approach works in theory, you collect all your expense data and calculate net profit manually. But in practice, it comes with serious trade-offs.
![]()
Here’s where manual tracking typically falls short:
It’s not real-time: Data needs to be updated frequently. Delayed input leads to outdated numbers, especially with fast-moving ad budgets or inventory costs.
It’s prone to error: Manual data entry always carries the risk of mistakes. One wrong formula or missing expense can throw off your profit view completely.
It doesn’t scale: For stores with multiple products, channels, or fulfillment partners, spreadsheet management becomes overwhelming. The more variables you track, the more fragile the setup becomes.
It lacks integration: You won’t have direct sync with Shopify, ad platforms, or payment processors. This means pulling reports from multiple sources and trying to match everything manually.
For small stores with stable pricing and limited campaigns, spreadsheets might be enough for a while. But as soon as operations get more complex, the workload increases and the margin for error grows with it.
What a Real Shopify Profit Tracking Setup Should Include
Once you understand what Shopify’s native reports are missing, the next step is knowing what a complete profit tracking setup should look like.
A reliable setup is about having the right data, consistently synced and interpreted in context.
Here are the essential components of a well-rounded profit tracking system:
![]()
Dynamic COGS tracking that updates based on product variants, suppliers, shipping zones, or fulfillment methods. This ensures that your cost calculations reflect real changes rather than static estimates.
Ad platform cost integration with Meta, Google, TikTok, and others, so you can track marketing spend accurately across campaigns and channels.
Expense automation for recurring costs like app subscriptions, shipping fees, transaction charges, and custom expenses. Manually entering these each time is both inefficient and error-prone.
Net profit calculation at the product, order, and customer level, not just overall store performance. This helps identify high-margin products and unprofitable ones.
MER and nCAC metrics built into your reporting, so you can evaluate how efficient your ad spend is and how much it costs to acquire new customers.
Refund and return adjustments that automatically reflect in your profit calculations. This is especially important if you offer free returns or store credit.
Attribution insights that connect profit data with sales channels or campaign sources. Without this, it’s hard to know what’s driving revenue sustainably.
Support for currency conversions and multiple stores, if you’re operating across regions. This helps keep your reporting consistent when exchange rates or tax rules vary.
Some merchants handle parts of this manually, others use apps that centralize it. Either way, the goal is the same: track not just what you earned, but what you actually kept and why.
A system that delivers order-level net profit, campaign-level marketing efficiency, and real-time visibility into changing costs is far more useful than any standalone sales report.
How to Read Shopify Reports Without Misleading Yourself
Even if you have access to more complete data, how you interpret it still matters. Reading Shopify profit reports in isolation can lead to incorrect conclusions, especially when key metrics are not viewed together.
Here’s how to approach profit data more effectively:
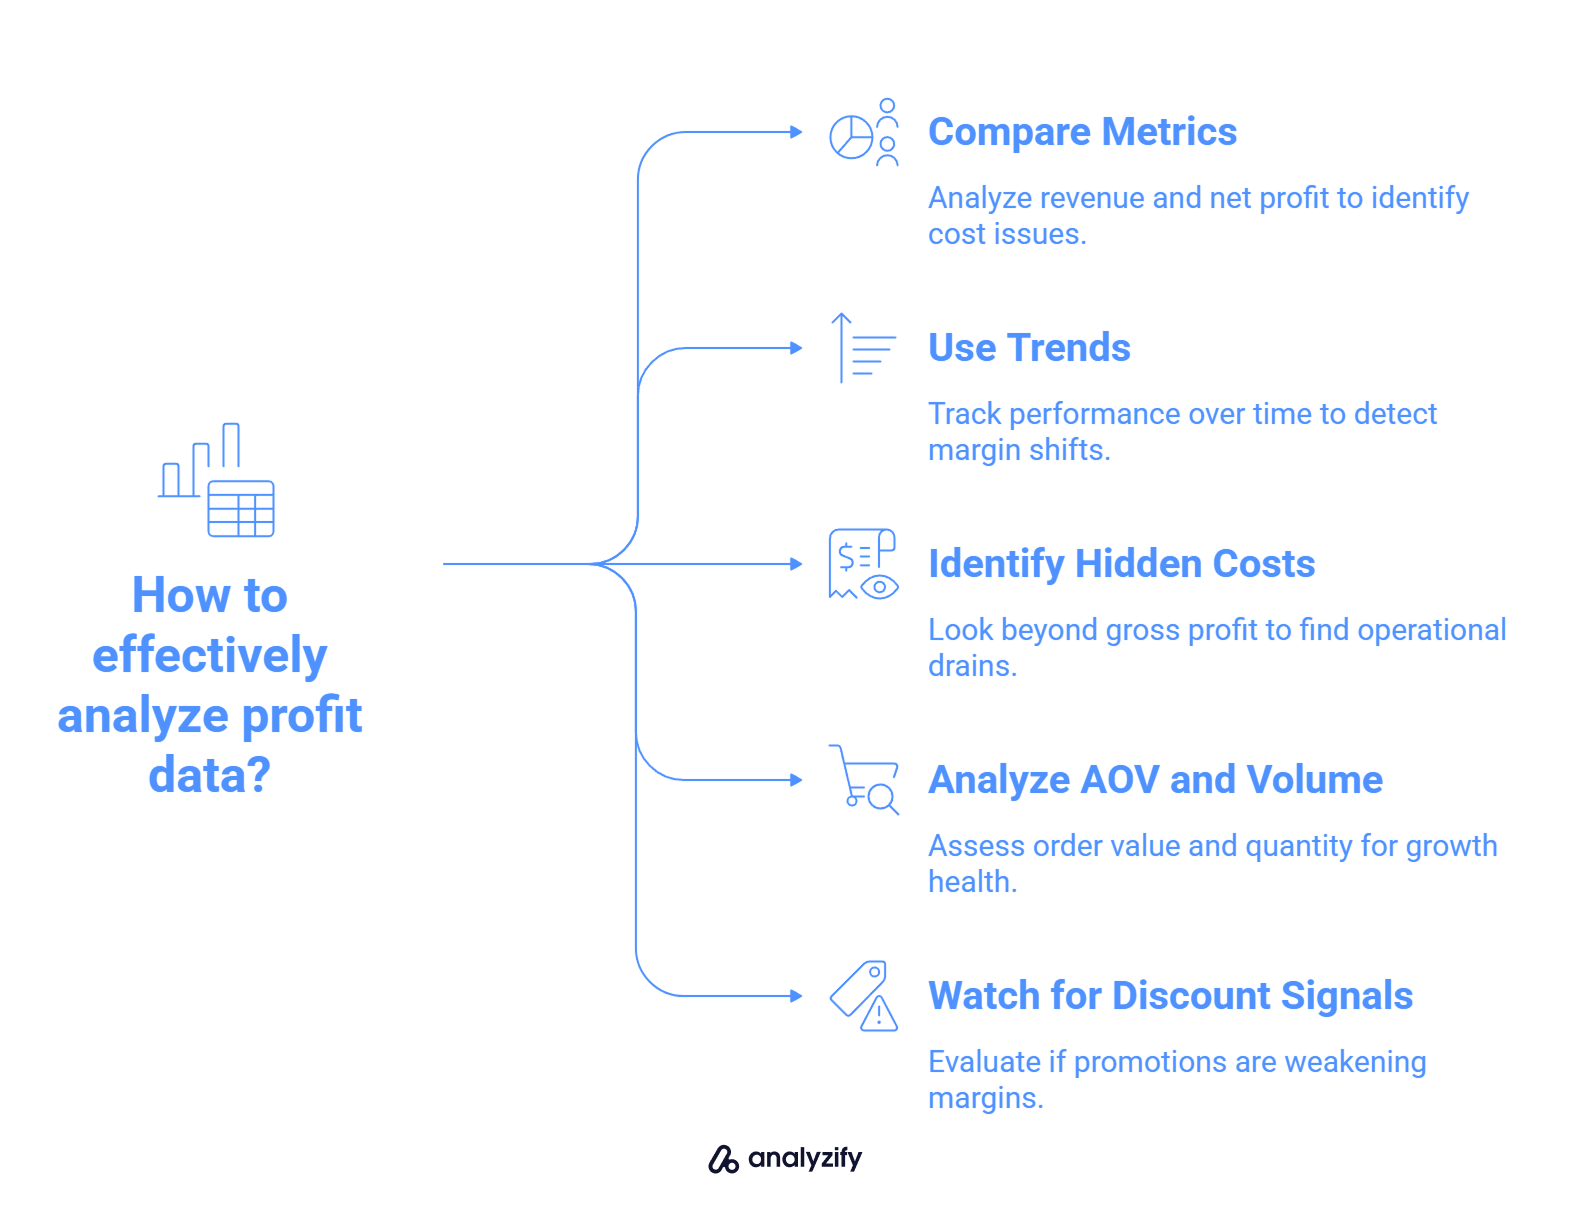
Always compare multiple metrics side by side. For example, if revenue is growing but net profit is flat, that usually signals rising costs. If ad spend is increasing but MER is dropping, your marketing might be driving sales at a declining return.
Use trends over time, not snapshots. One-day or one-week spikes rarely tell the full story. Instead, compare MoM or QoQ performance to identify cost creep or shifts in profit margin.
Look beyond gross profit to identify hidden drains. Operational costs like shipping fees, high return rates, and payment processing charges don’t appear in Shopify’s default views but can quietly reduce your margins over time.
Use AOV and order volume together. A higher AOV might suggest strong bundling or upselling, but if total orders are down, the growth might not be as healthy as it appears.
Watch for false signals from discount-heavy sales. Big promotions can temporarily inflate revenue while weakening margins, especially if the increase comes from low-value buyers or one-time purchases.
A consistent interpretation strategy makes your reporting much more actionable. Instead of reacting to single metrics, you’ll start to understand how the different parts of your business affect each other and where to adjust.
Final Takeaway: Use Shopify Reports, But Don’t Rely on Them Alone
Shopify’s built-in profit reports are useful for reviewing basic product-level performance, but they don’t provide the full financial picture. Key costs like ad spend, shipping, and payment fees are excluded, which means the platform shows only part of your actual profitability.
To make better business decisions, you need a system that captures all relevant expenses and gives you a complete view of net profit.
Shopify reports help with identifying trends and margin differences between products, but they don’t explain why your profit is growing or shrinking.
Tracking only revenue or gross profit can lead to false confidence and missed problems in areas like fulfillment or marketing spend.
If you want reliable insights, your setup needs to include the missing cost data and connect profit metrics to real business actions. That’s how you shift from reviewing numbers to improving results.