Cookie banners get ignored by 70% of users, yet they’re crucial for both legal compliance and data collection. Clear patterns have emerged showing what actually works to improve cookie banner acceptance rates.
Key findings reveal:
- Default settings can increase acceptance rates by up to 83%, but often lead to users blocking cookies later
- Banner text length directly impacts engagement - longer messages decrease acceptance by 17%
- Morning visitors show 15% higher engagement with cookie choices
- Mobile users are 23% more likely to accept default settings
- Message clarity matters more than visual design - technical terms reduce acceptance by 20%
Rather than using aggressive tactics that drive users away, successful cookie banner acceptance rates depend on understanding user behavior and implementing proven strategies.
Let’s examine exactly what works and how to implement these changes effectively.
Bonus: Want to explore the best GDPR apps for your Shopify store? Check out our detailed comparison and reviews.
What Research Shows About Cookie Banner Acceptance Rates
Lab experiments and real-world data show clear patterns in how users interact with cookie banners. Here are the actual numbers that demonstrate these patterns.
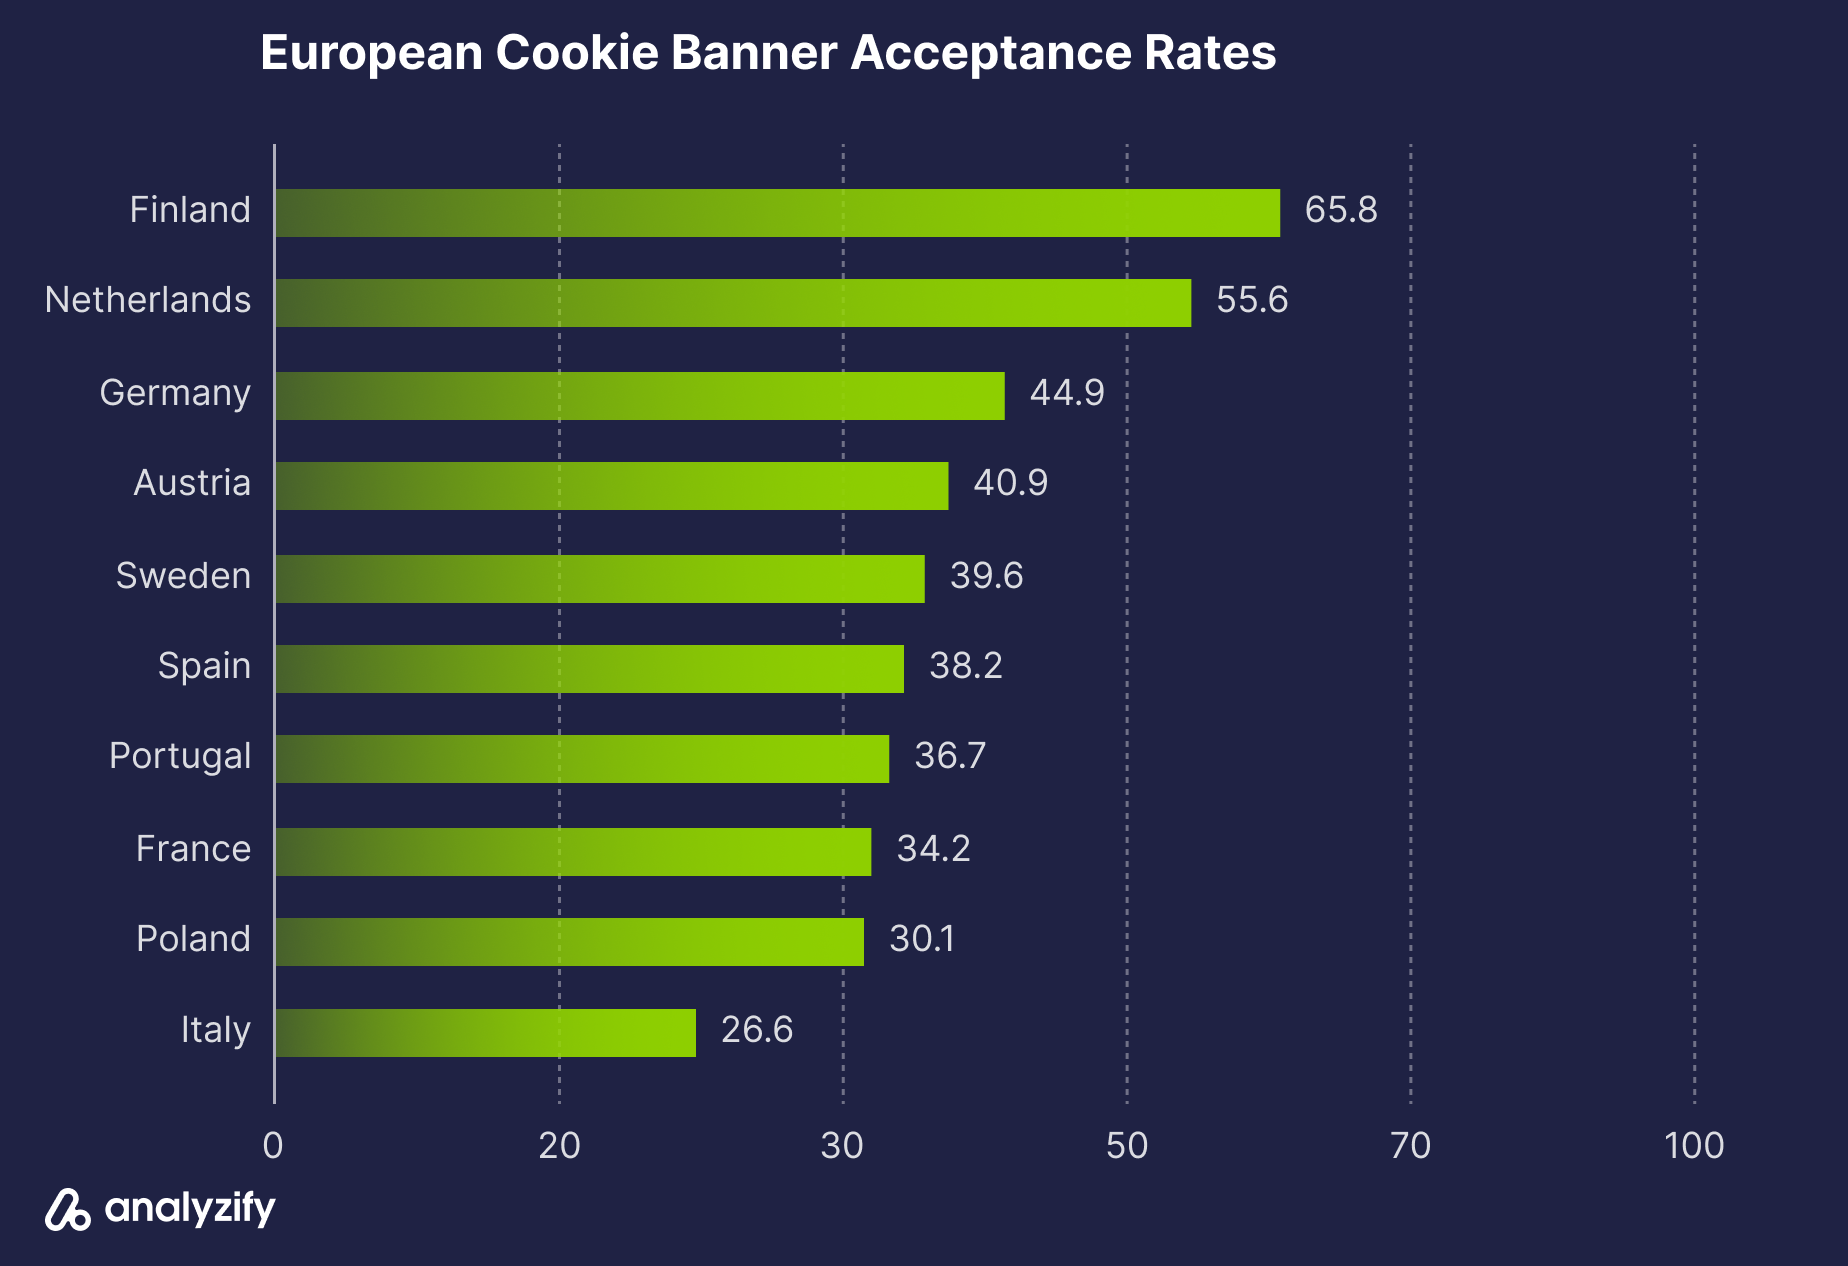
European Cookie Banner Acceptance Rates:
- Finland: 65.8% of users actively manage settings
- Netherlands: 55.6% actively manage settings
- Germany: 44.9% actively manage settings
- Italy: 26.6% actively manage settings
These differences across countries suggest that local digital habits and awareness affect how users handle cookie consent. The comparison between EU and US markets shows even more distinct patterns.
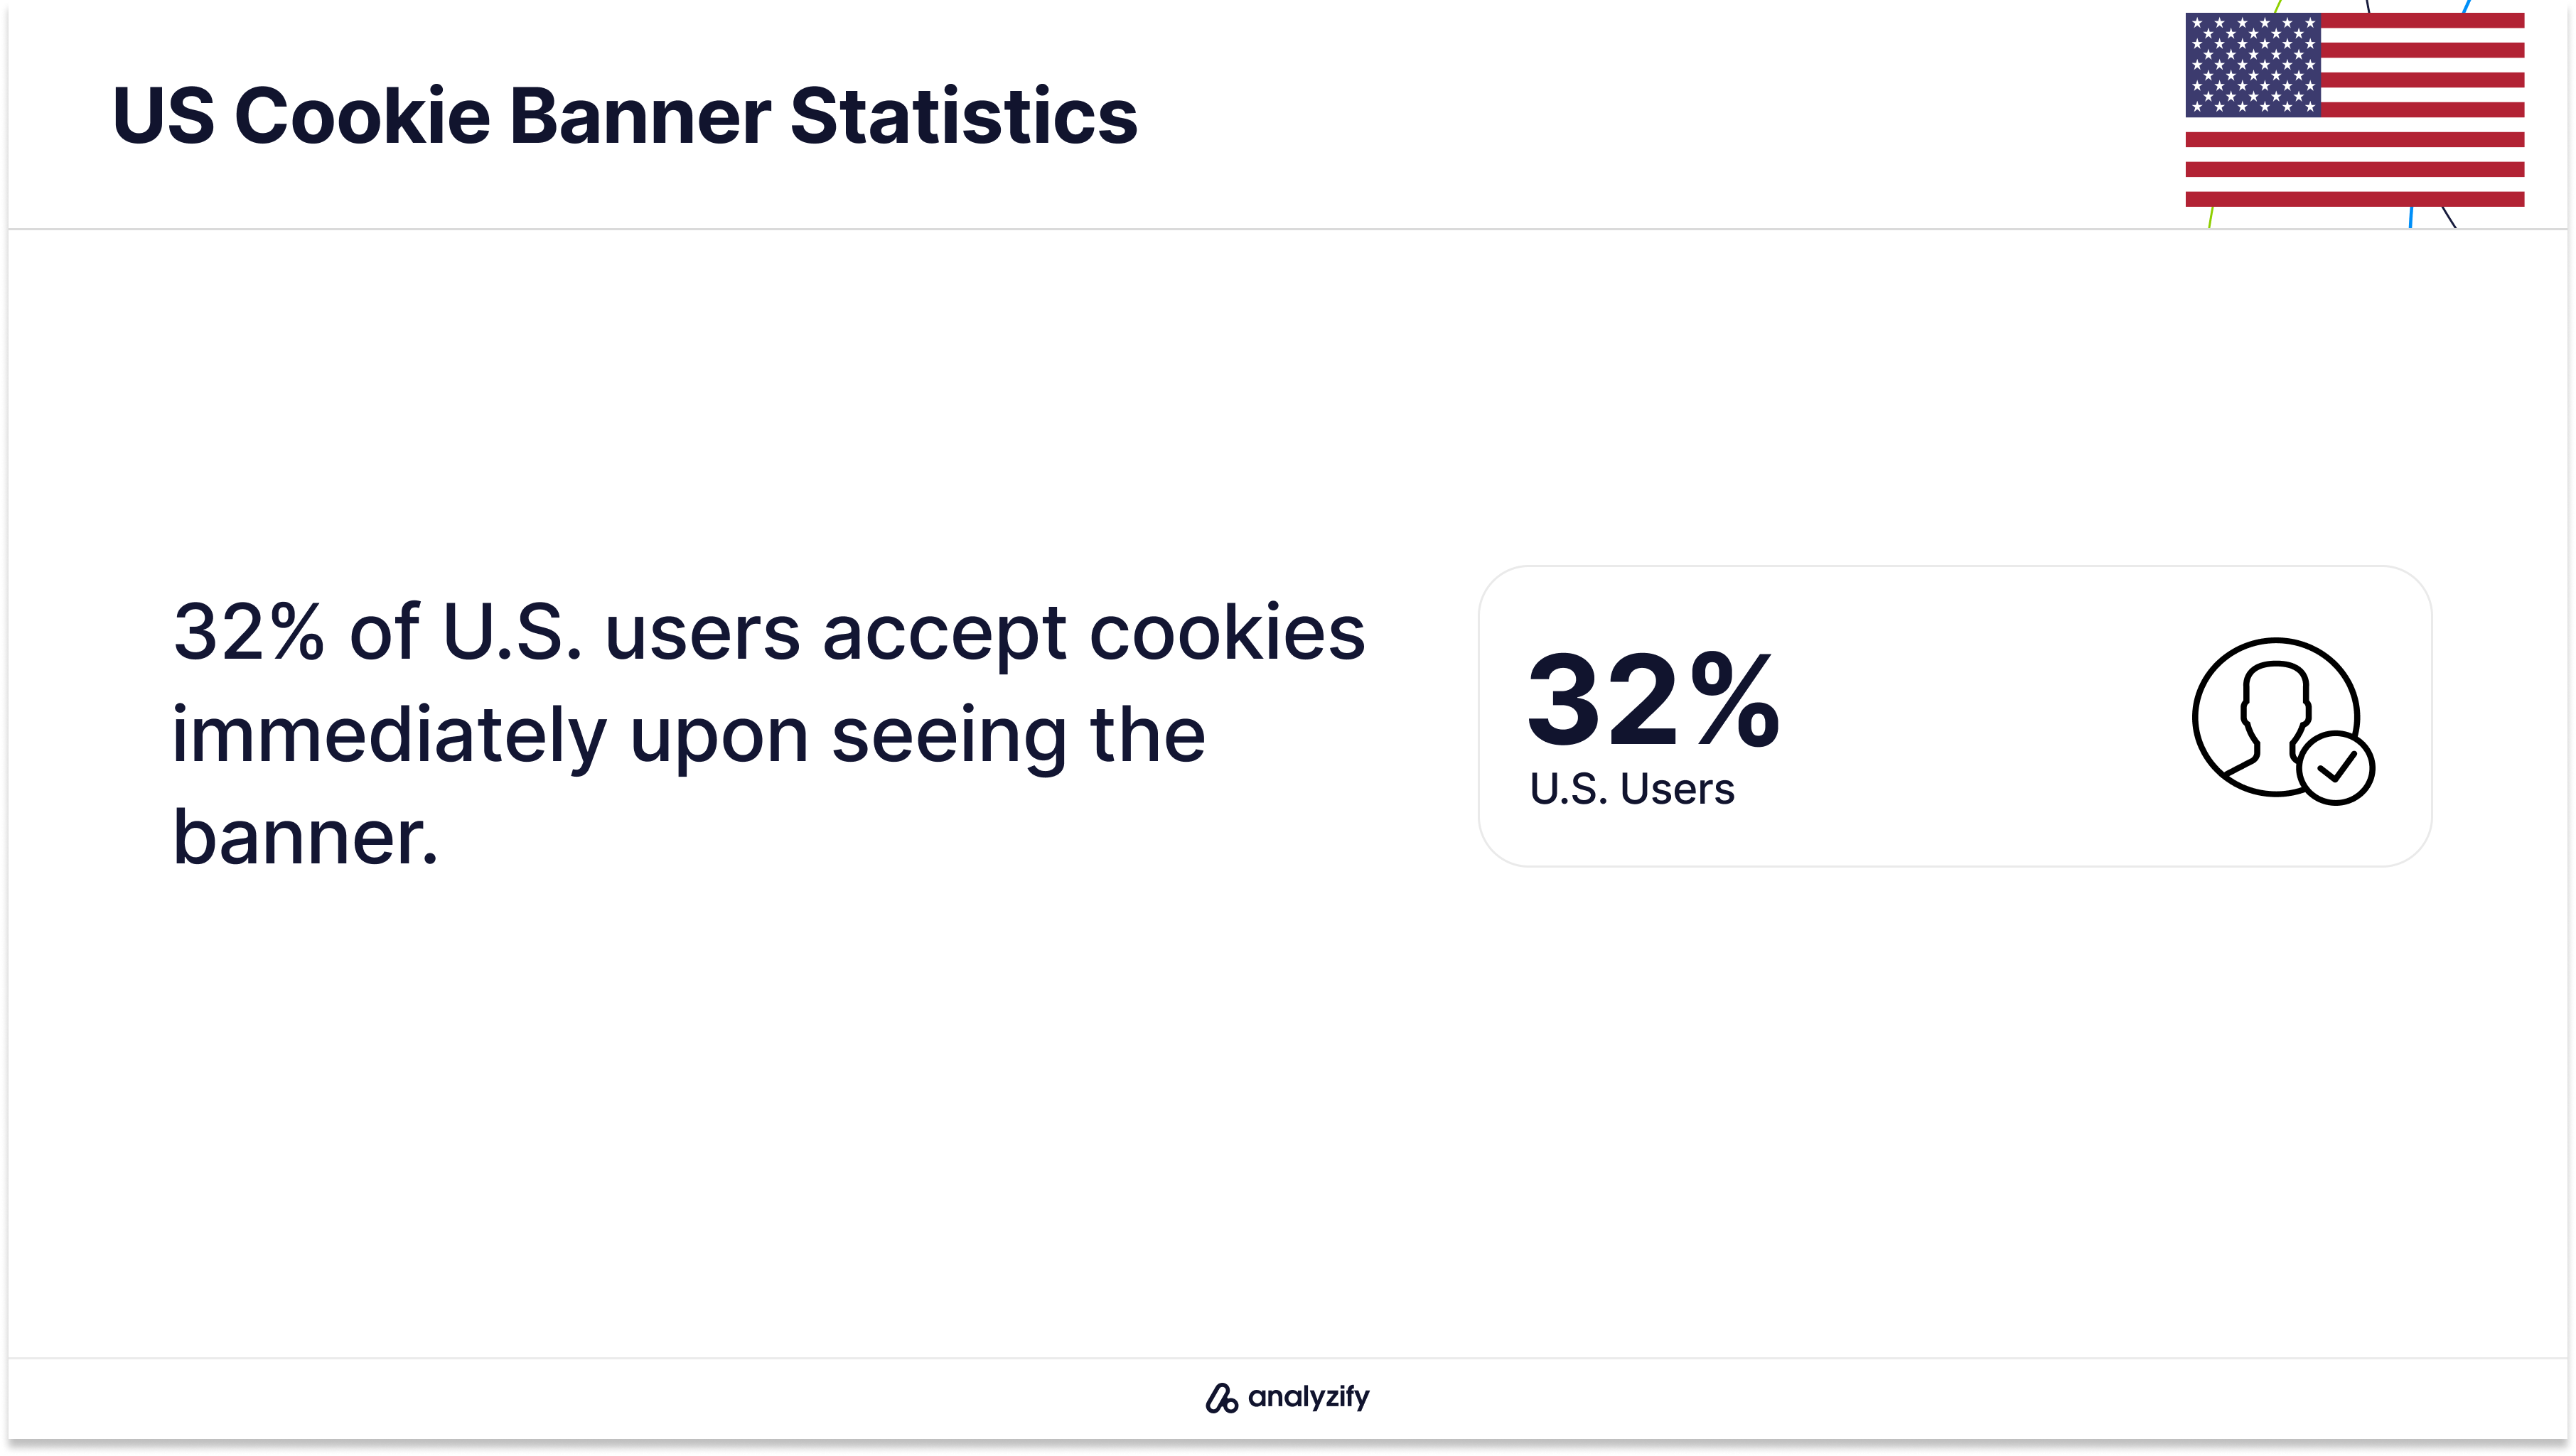
US User Responses to Cookie Banners:
- 32% accept cookies immediately
- 31% make different choices on different websites
- 15% accept but change advanced settings when available
- 9% refuse cookies consistently
- 13% don’t understand their cookie options
Lab research shows specific results with different banner types.
Tests with standard cookie banners found:
- 60% average acceptance rate
- 15-20 seconds spent reading policies when users choose to look
- 83% higher acceptance rates with default settings
- 40% lower acceptance when banners offer multiple choices
The timing of when banners appear affects user choices:
- Users accept more often when focused on their main task
- Banner position changes both acceptance rates and attention
- Immediate vs delayed banner showing leads to different acceptance rates
These numbers help us understand which banner elements actually influence user decisions. Next, let’s look at the specific design elements that testing shows make the biggest difference in acceptance rates.
Bonus: Expore Online Shopping Trends in 2025!
Design Elements That Change Cookie Banner Acceptance Rates
Testing reveals that specific design elements consistently affect whether users accept or reject cookies. Through both lab studies and real-world website data, certain patterns emerge in how design choices impact acceptance rates.
Banner text length directly affects whether users engage with cookie choices. Research shows that longer messages actually decrease acceptance rates - but not for the reasons most would expect. When cookie banners contained detailed privacy information, users were 17% less likely to accept cookies.
However, this wasn’t because they read and understood the information better. Instead, longer text made users more likely to ignore the banner completely.
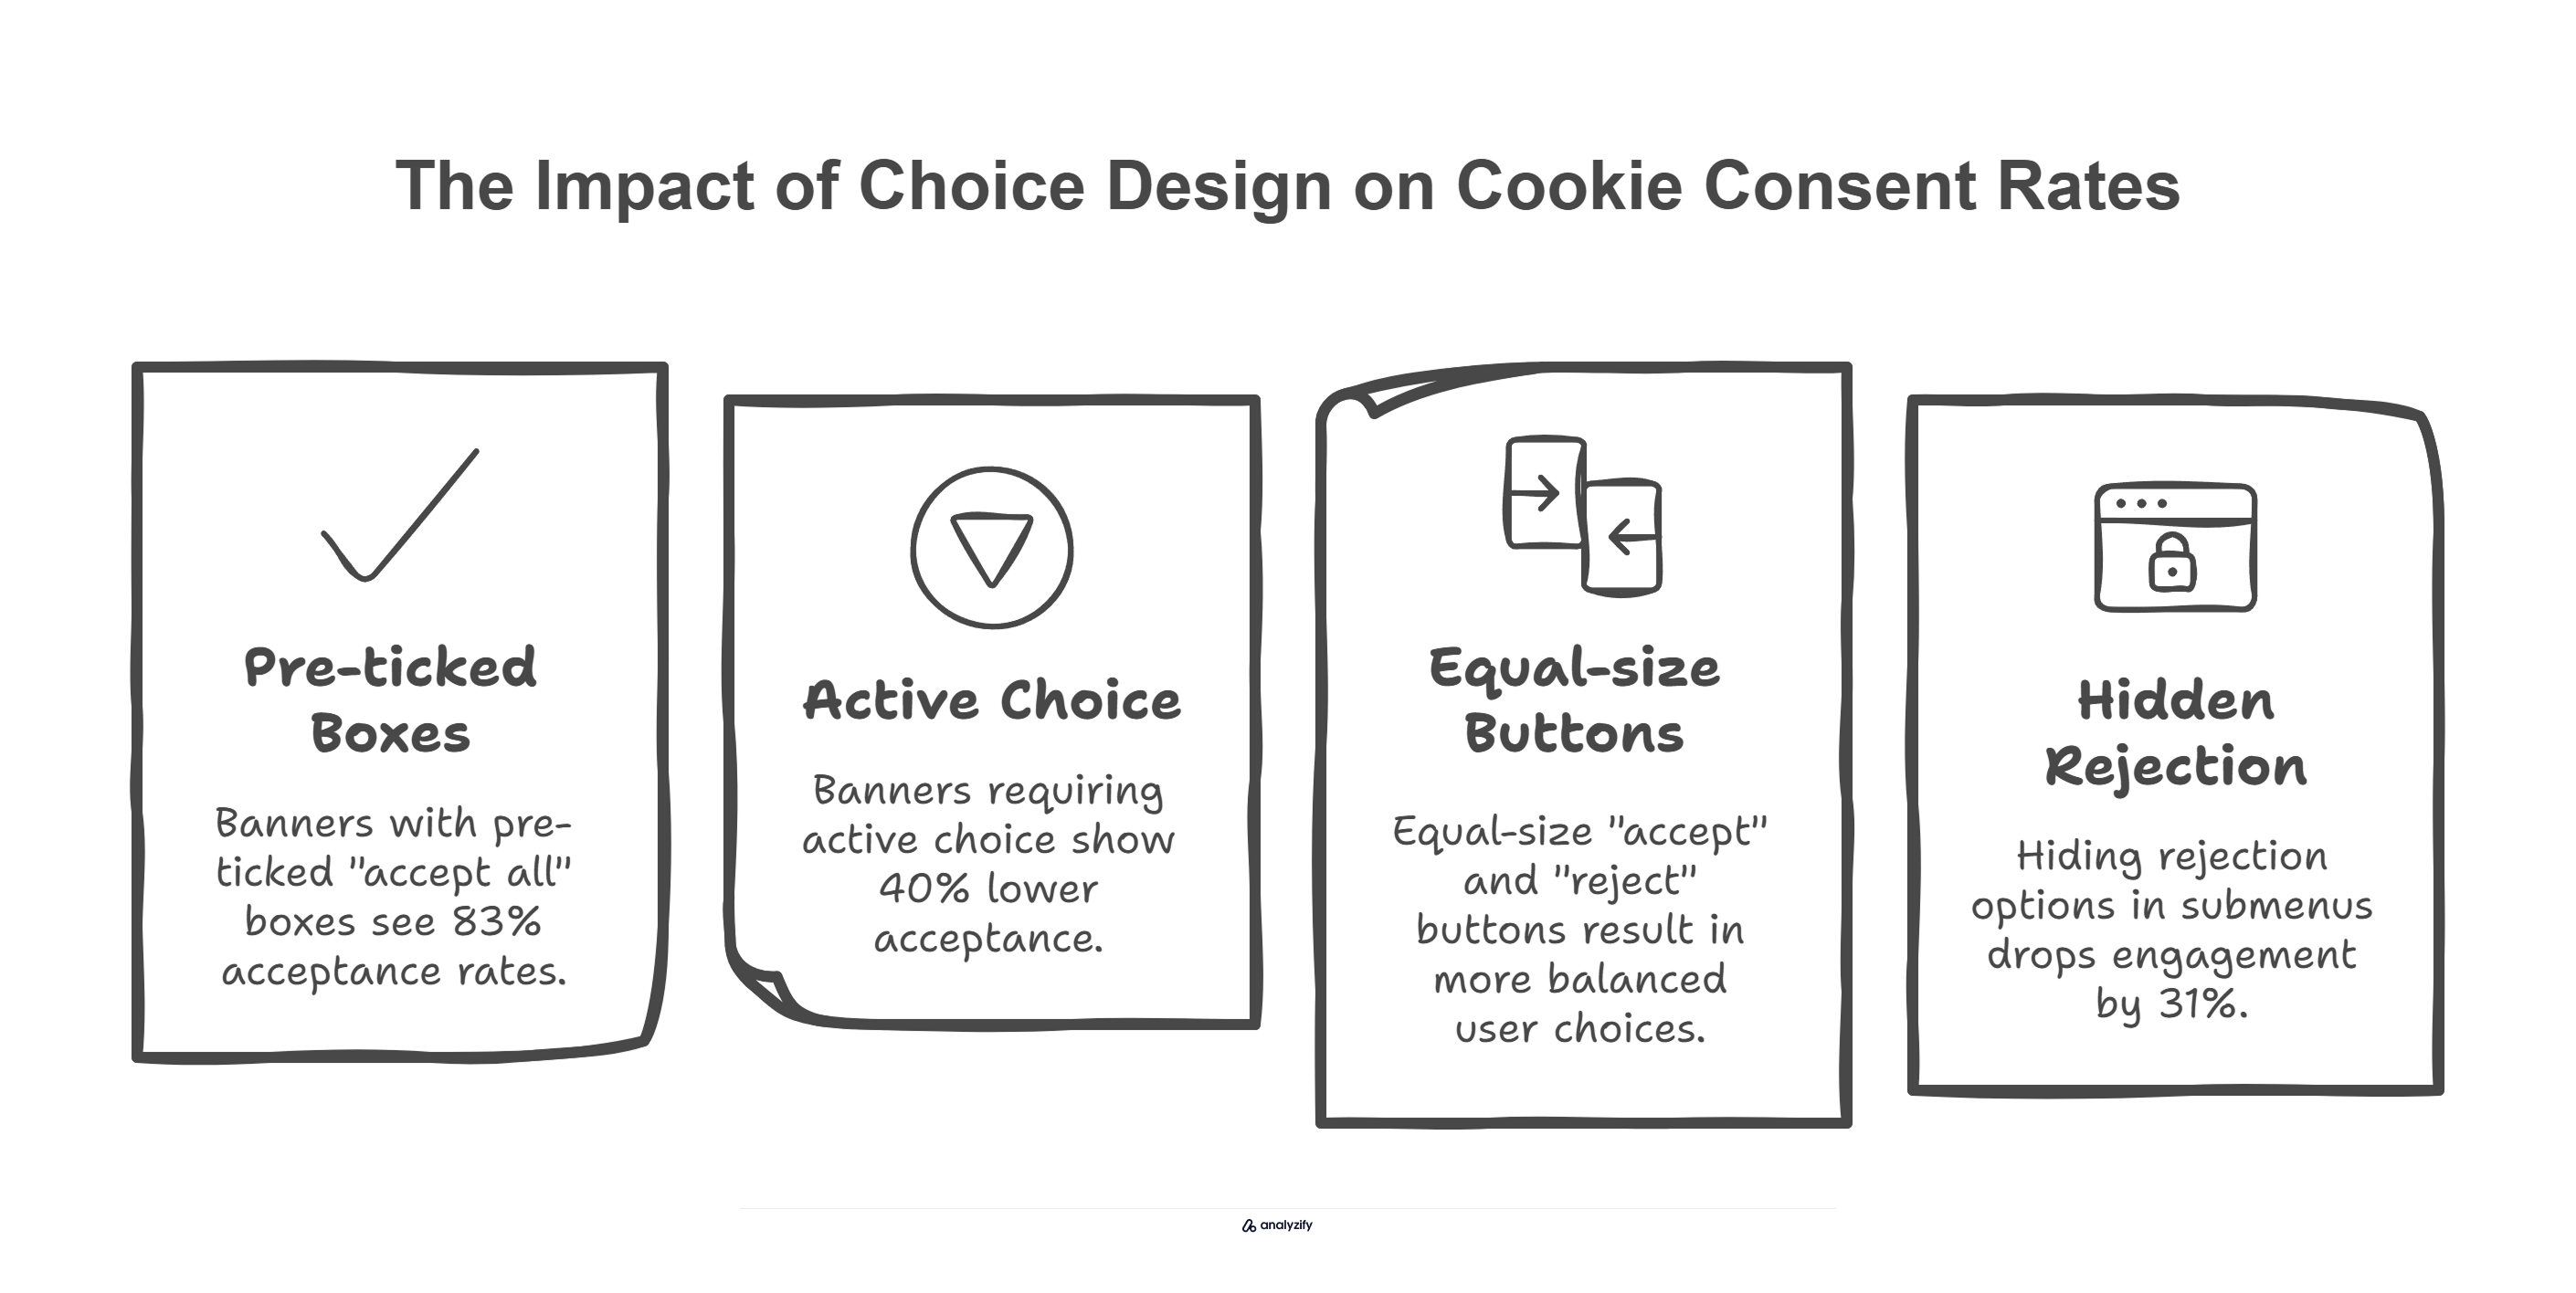
The way choices are presented makes a measurable difference:
- Banners with pre-ticked “accept all” boxes see 83% acceptance rates
- Banners requiring active choice show 40% lower acceptance
- Equal-size “accept” and “reject” buttons result in more balanced user choices
- Hiding rejection options in submenus drops engagement by 31%
Message clarity also plays a crucial role. Studies found that technical terms like “HTTP cookies” or “browser storage” reduced acceptance rates compared to plain language descriptions. For example, changing “third-party cookies” to “allow other companies to track your browsing” led to a 20% decrease in acceptance rates.
Visual hierarchy testing shows:
- Prominent “accept” buttons increase acceptance by 27%
- Color contrast between options affects user choice
- Button placement order influences which option users pick
- Mobile users need larger touch targets for meaningful choice
The timing of the banner display creates distinct patterns in user behavior. Immediate popups see 15% lower acceptance rates than banners that appear after users start engaging with site content.
However, waiting too long to show the banner reduces overall response rates by 23%.
These design elements work together to influence the final acceptance rate. The next section examines how different types of messages affect user decisions when design elements are held constant.
Message Types That Influence Cookie Banner Acceptance Rates
Different message approaches show clear differences in how users respond to cookie banners. Lab testing across 600+ participants revealed specific patterns in which messages work - and which don’t.
Default messaging produces the strongest effect on acceptance rates. When banners tell users that “continuing to browse means accepting cookies,” acceptance jumps to nearly 100%.
However, this high acceptance rate comes with a catch: users who accept through defaults are no more likely to understand what they’ve agreed to than users who see traditional banners.
Protection-focused messages create distinct user reactions:
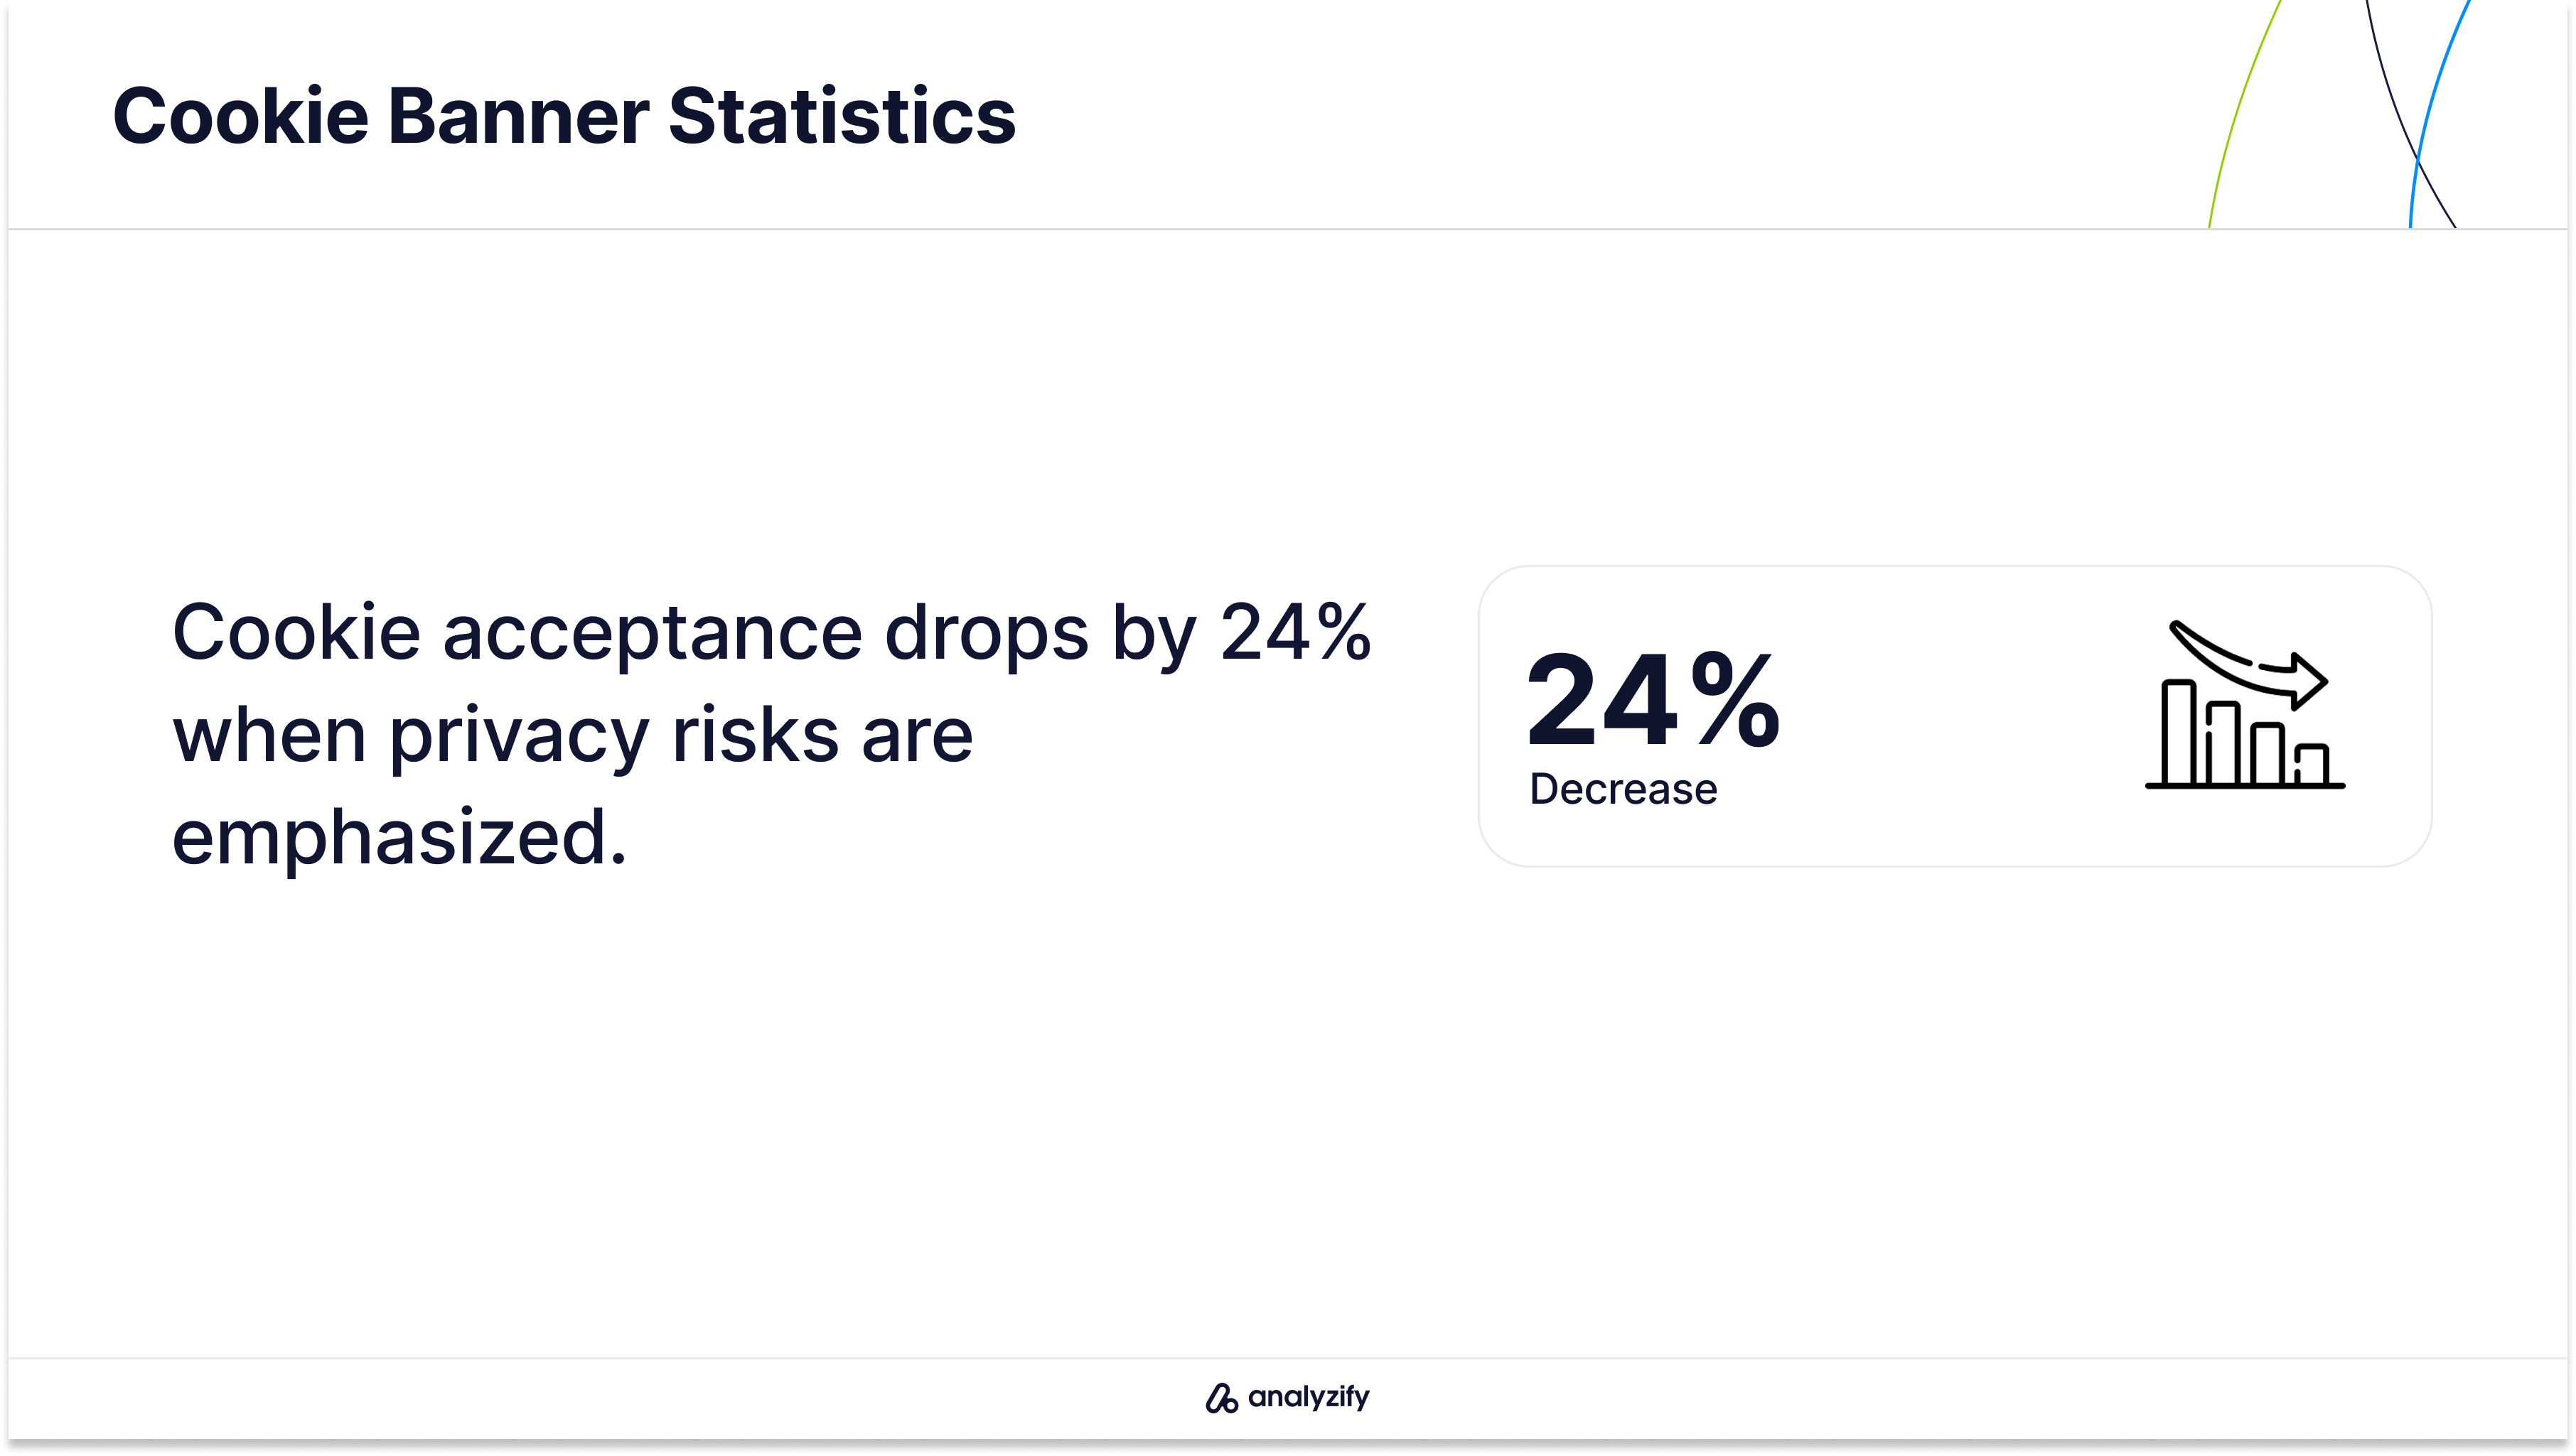
- Messages about privacy threats reduce acceptance by 24%
- Information about data protection increases acceptance by 16%
- Combined threat and protection messages lower user engagement
- Users spend less time reading detailed privacy warnings
Social proof messaging shows mixed results in testing:
- Telling users “most people accept cookies” increases acceptance by 12%
- Messages about privacy-conscious users reduce acceptance
- Regional differences affect how users respond to social messages
- Trust signals from known organizations boost acceptance rates
The actual purpose stated in the banner significantly changes user behavior.
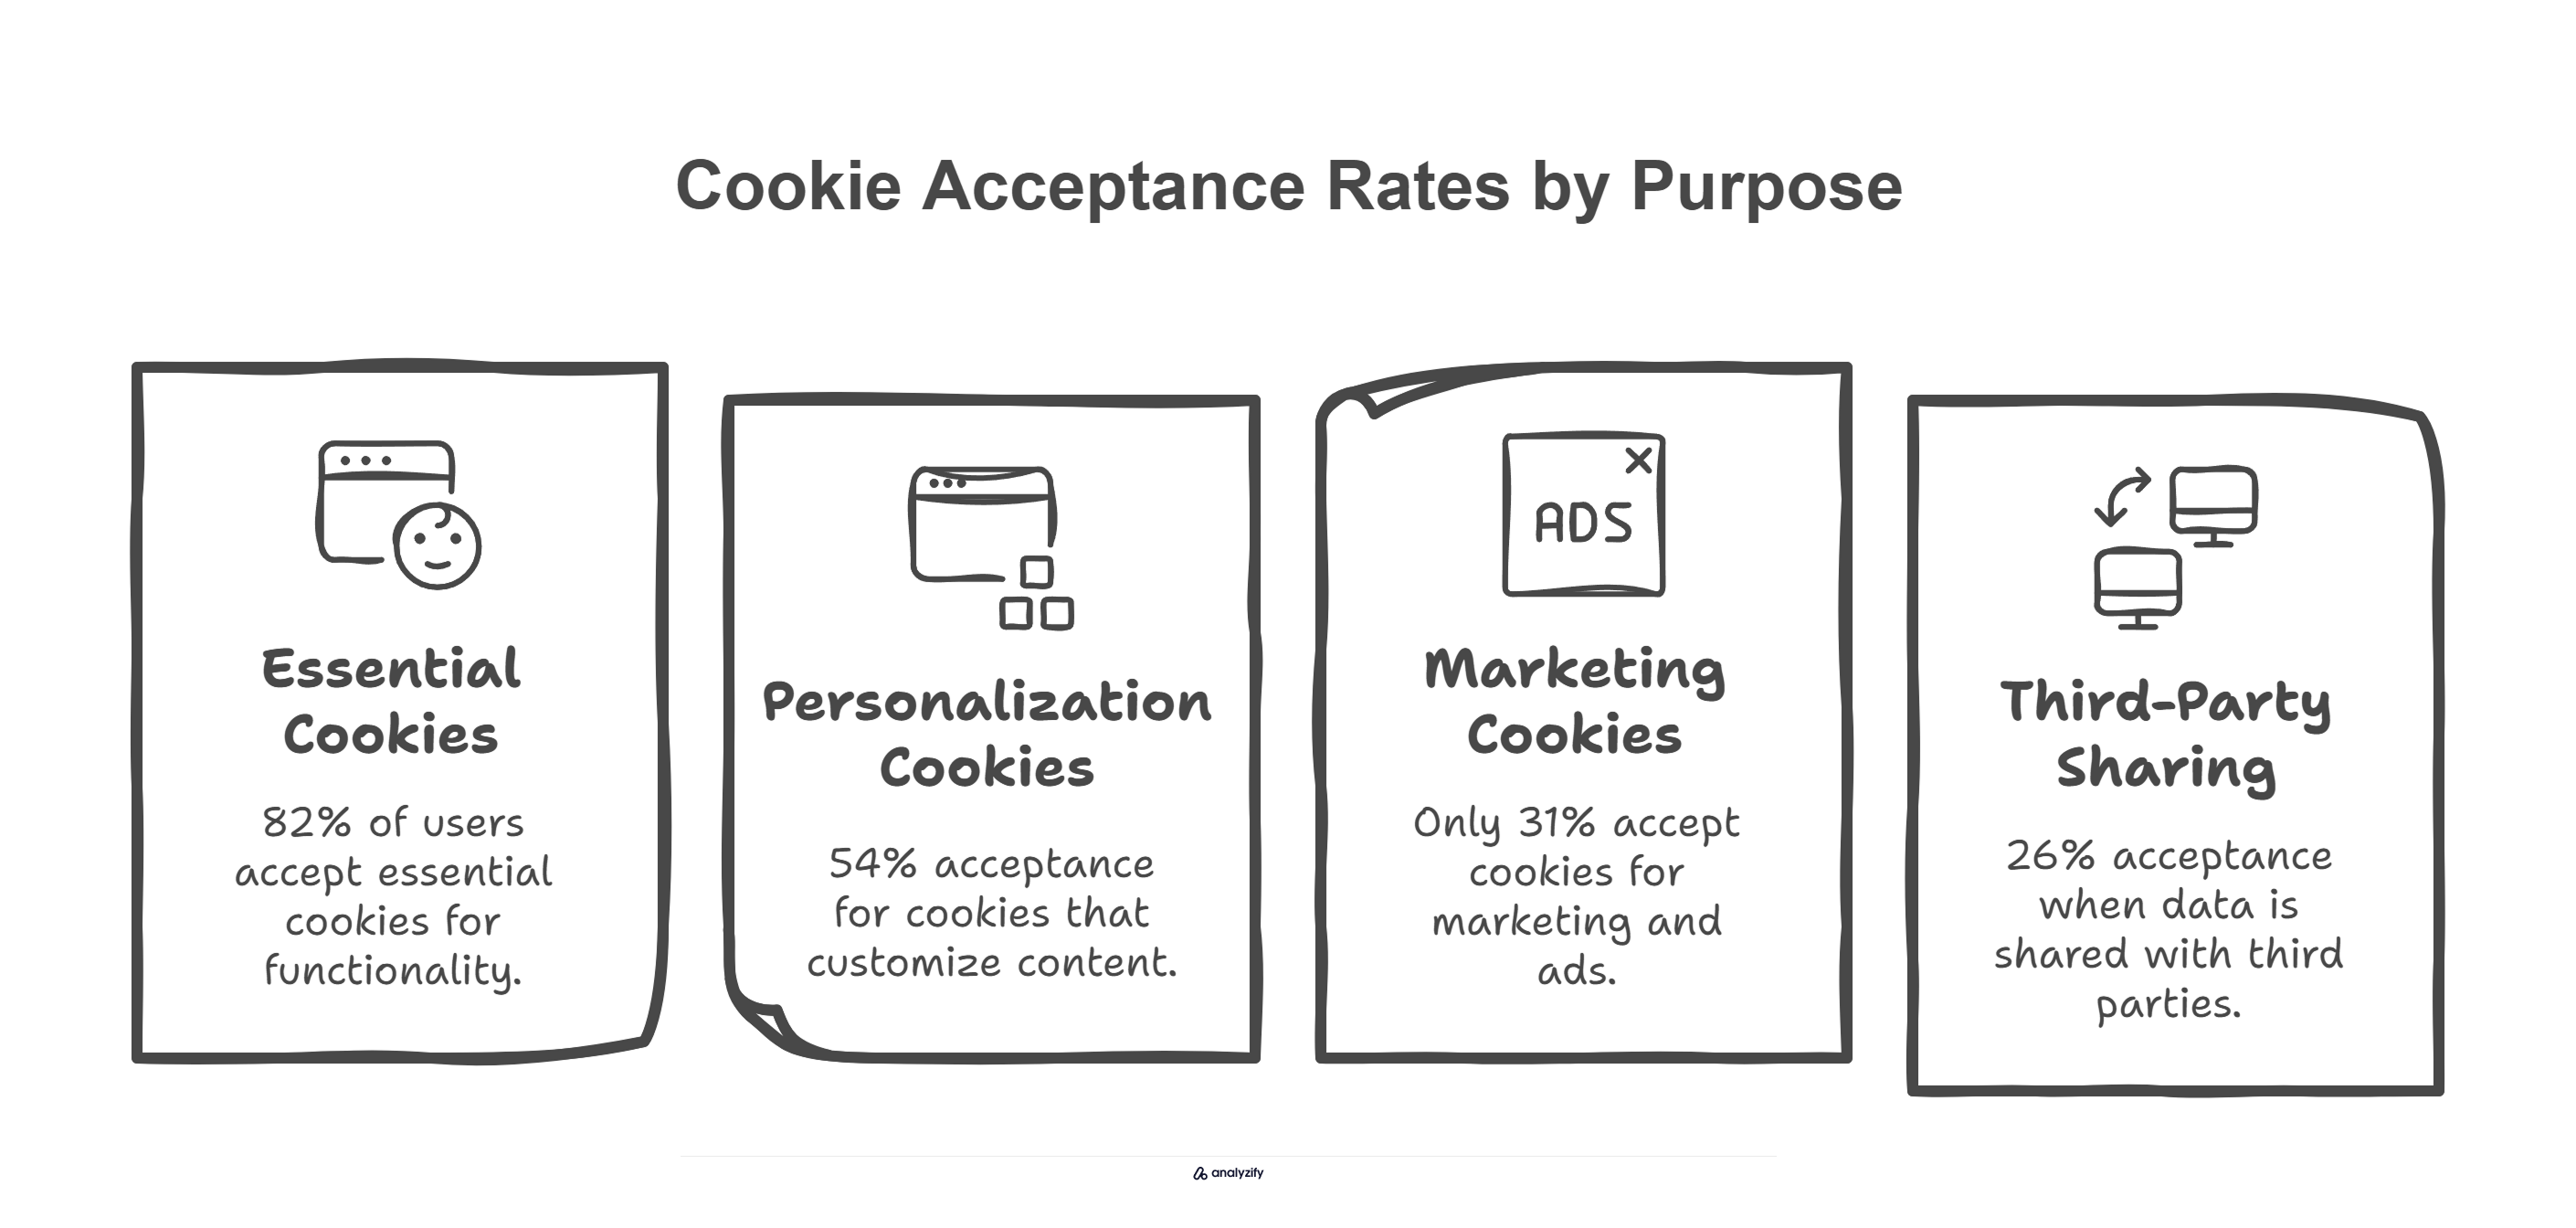
Clear explanations of cookie purposes lead to different acceptance rates:
- Basic website function: 82% acceptance
- Personalization features: 54% acceptance
- Marketing/advertising: 31% acceptance
- Third-party sharing: 26% acceptance
Language complexity matters more than many realize. Banners written at a high school reading level see 15% higher engagement than those using legal or technical terms. However, oversimplifying the message can make users suspicious and less likely to accept.
These message types combine with the design elements we discussed earlier to determine final acceptance rates. The next section looks at how to measure and track which combinations work best for different audiences.
Bonus: Explore Best Marketing Conferences to Attend in 2025!
Measuring and Testing Cookie Banner Acceptance Rates
Understanding how to track and measure banner performance helps identify what actually works. Research shows specific metrics matter more than others when measuring banner effectiveness.
Basic acceptance rate tracking isn’t enough. A complete measurement approach needs to capture:
The Quality of Acceptance:
- How many users actively choose vs. default accept
- Time spent before making a choice
- Whether users change default settings
- If users return to modify their choices later
Click patterns reveal important user behavior:
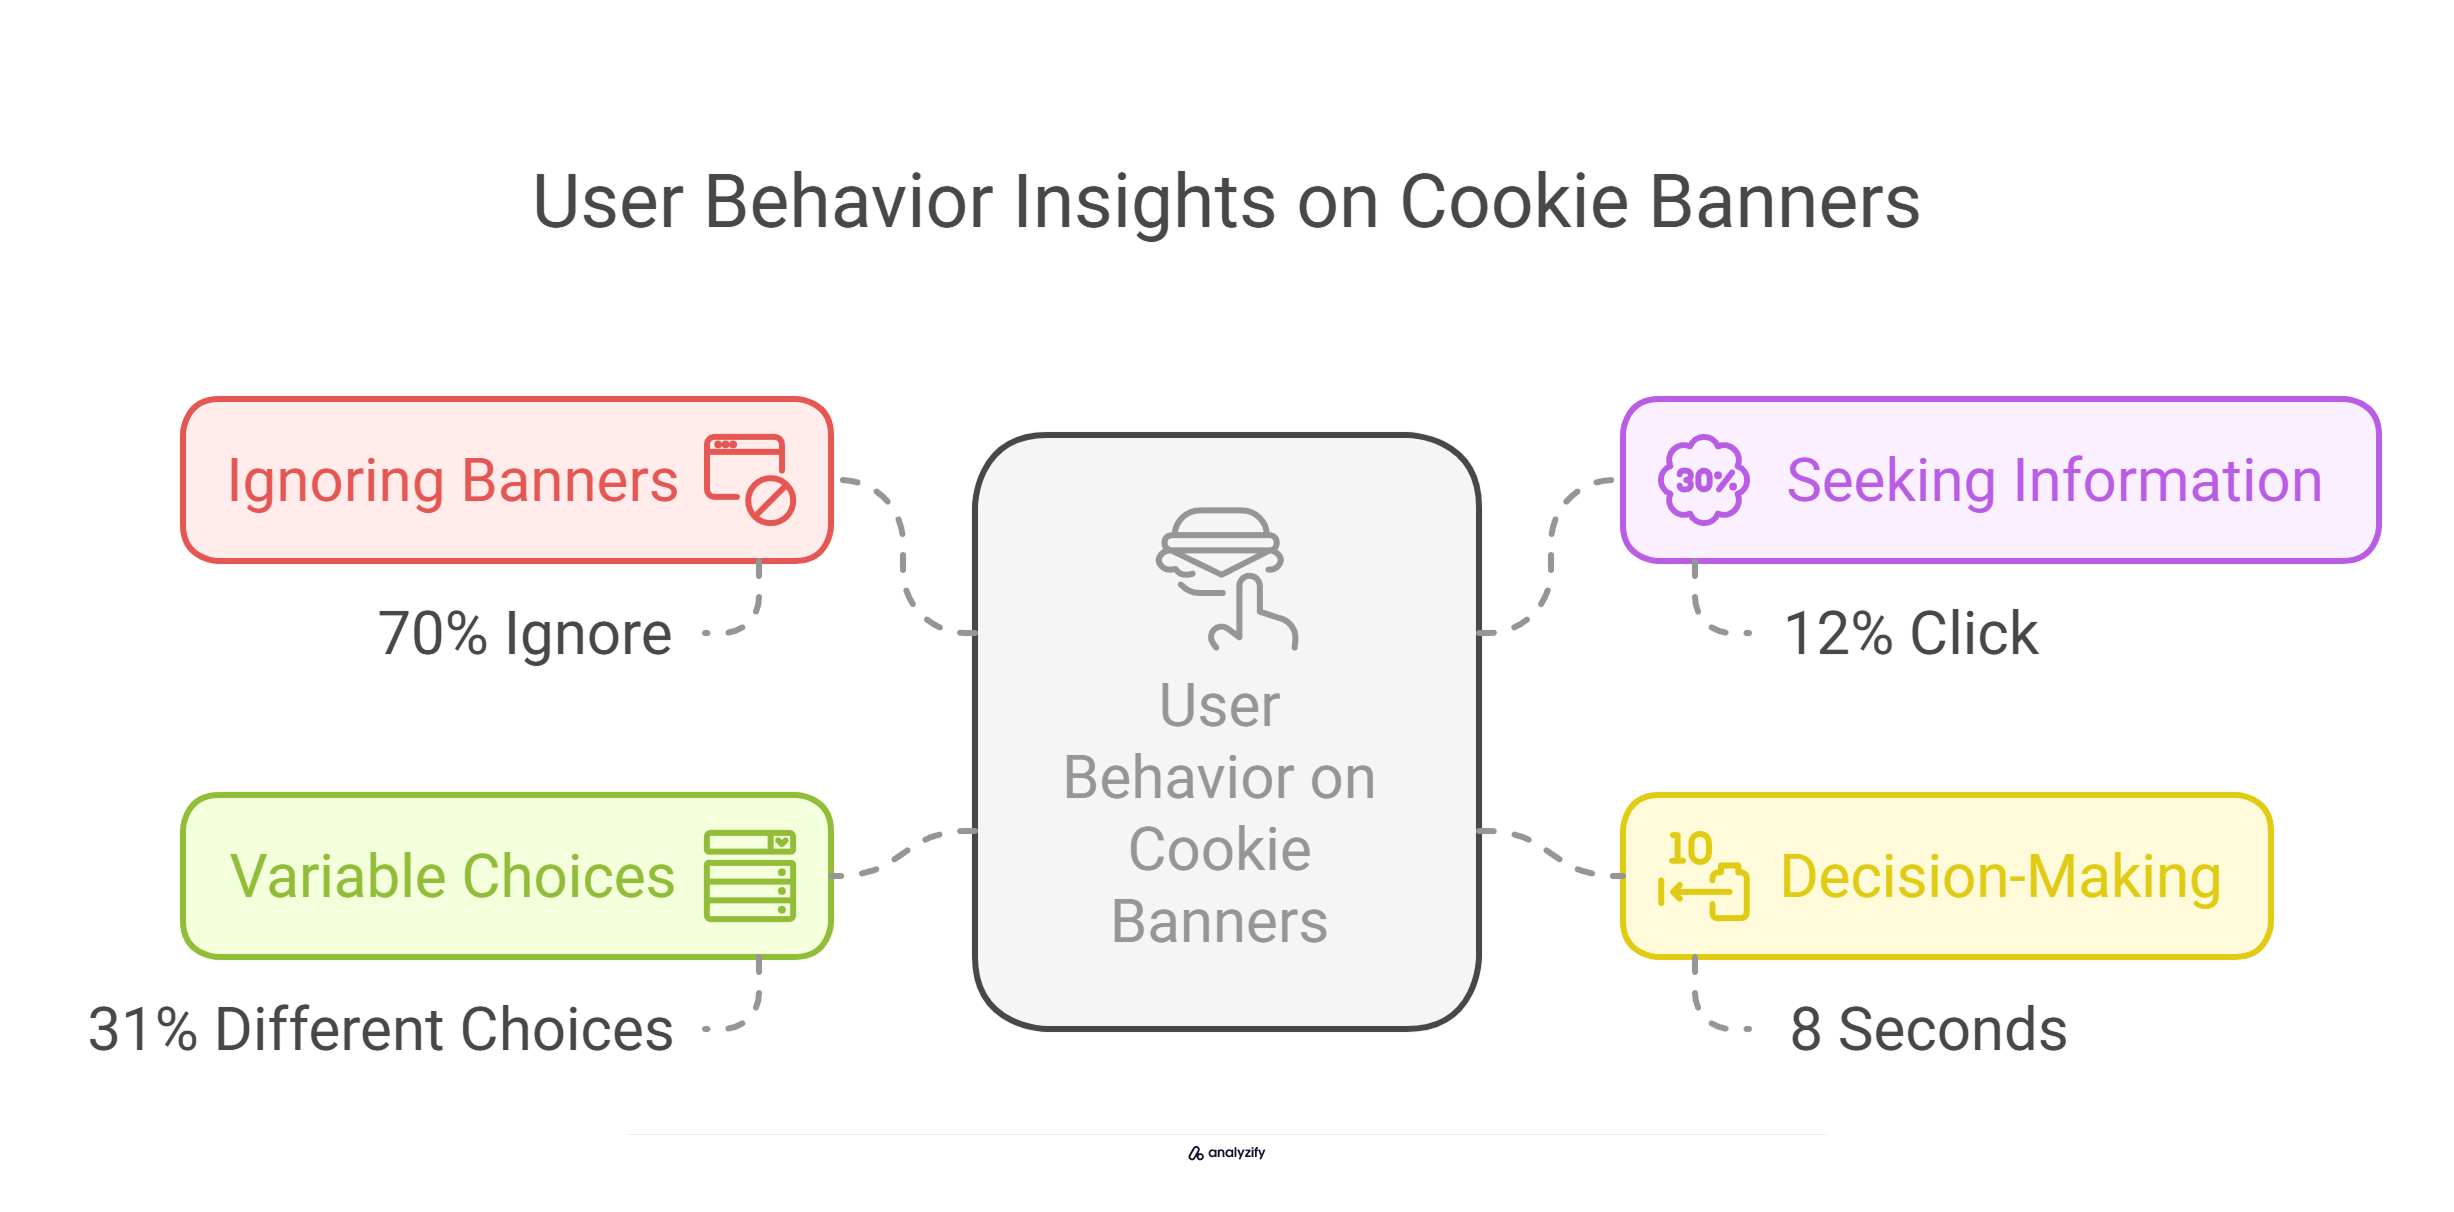
- 70% of users ignore cookie banners when possible
- Only 12% of users click links for more information
- 31% of users make different choices on different sites
- Most users decide within 8 seconds of seeing a banner
Testing needs to track multiple data points to be meaningful.
Lab studies show the most reliable approach combines:
- Direct acceptance rates
- Time to first interaction
- Policy page visit duration
- Settings changes after initial acceptance
One critical finding from extensive testing: high acceptance rates don’t always mean better banner performance. For example, banners with 90%+ acceptance through defaults often lead to higher rates of users later blocking all cookies through browser settings.
Real-world tracking reveals clear patterns in user engagement:
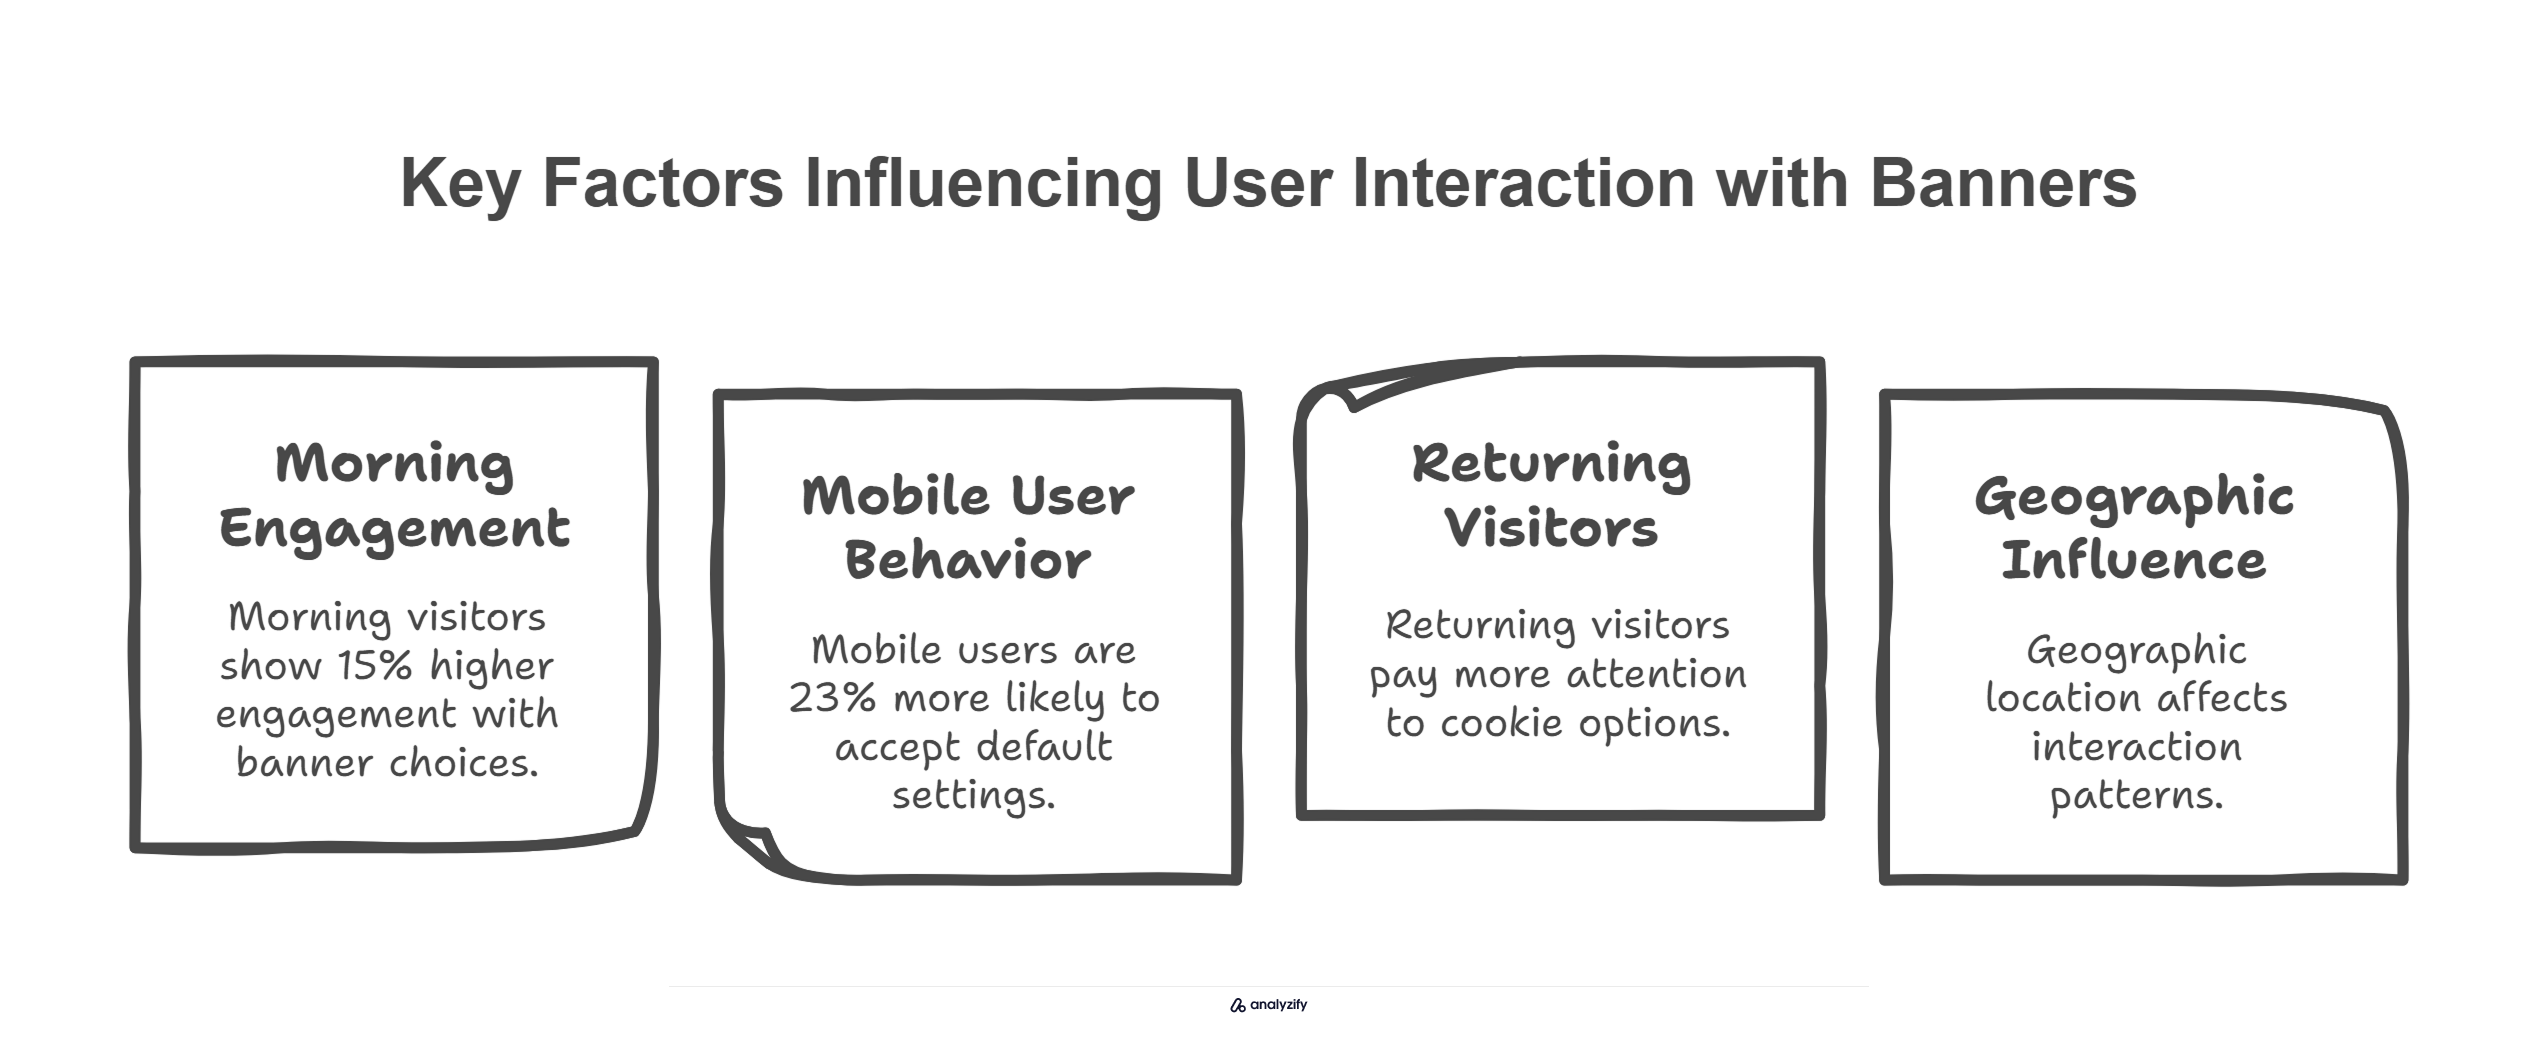
- Morning visitors show 15% higher engagement with banner choices
- Mobile users are 23% more likely to accept default settings
- Returning visitors pay more attention to cookie options
- Geographic location affects interaction patterns
The key is measuring not just whether users accept, but how they interact with different banner elements. This data helps identify which combinations of design and messaging actually work - rather than just forcing acceptance through aggressive defaults.
How to Improve Cookie Banner Acceptance Rate: Top FAQs
Here are the most frequently asked questions about improving cookie banner acceptance rates, based on research and real-world data:
What is the average cookie banner acceptance rate?
Research shows an average acceptance rate of 60% for standard cookie banners.
However, this rate varies significantly by region, with European countries showing different patterns - Finland has 65.8% active management, while Italy shows 26.6%.
In the US, about 32% of users accept cookies immediately, while 31% make different choices depending on the website.
How can I improve my cookie banner acceptance rate?
You can improve cookie banner acceptance rates through several proven methods:
- Use clear, non-technical language (technical terms reduce acceptance by 20%)
- Keep banner text concise (longer messages decrease acceptance by 17%)
- Consider timing (showing banners after users engage with content increases acceptance)
- Use plain language descriptions instead of technical terms
- Ensure proper visual hierarchy with clear button placement
- Position banners strategically (timing and placement affect both acceptance rates and attention)
Should I use default accept settings in my cookie banner?
While default accept settings can increase cookie banner acceptance rates by up to 83%, this approach comes with risks.
Users who accept through defaults are more likely to later block all cookies through browser settings and don’t better understand what they’ve agreed to.
Additionally, some jurisdictions may have legal requirements regarding default settings, so consider both compliance and user experience when making this decision.
What’s the difference in cookie banner acceptance between mobile and desktop users?
Mobile users show distinctly different behavior patterns compared to desktop users. They are 23% more likely to accept default settings, and require larger touch targets for meaningful choice.
Mobile-specific design considerations are important since the limited screen space affects how users interact with cookie banners.
How long do users typically spend reading cookie policies?
Most users make their cookie choices very quickly, with the average user deciding within 8 seconds of seeing a banner.
Only 12% of users click links for more information, and when they do, they spend about 15-20 seconds reading policies.
This suggests that clear, concise information in the initial banner is crucial, as most users won’t read detailed policies.