
Tracking profit in Shopify isn’t as straightforward as it may seem. While your sales might look promising, they don’t always reflect the actual health of your business. Profit analytics helps you go beyond surface-level revenue and understand what you’re truly earning after all costs are accounted for.
Here’s what you’ll learn in this guide:
✅ The difference between revenue, gross profit, and net profit
✅ Which metrics matter most when evaluating performance
✅ Where Shopify’s built-in reports fall short (and how to work around them)
✅ How to interpret key profit indicators like MER and nCAC
✅ Why accurate COGS and expense tracking directly impact your decisions
Let’s start by clarifying what profit analytics actually means in a Shopify context.
What Is Profit Analytics in Shopify and Why It Matters
Profit analytics refers to the practice of measuring your store’s actual earnings after subtracting all associated costs. This includes more than just product costs. You need to factor in shipping, marketing, transaction fees, discounts, returns, and other operational expenses.
In Shopify, you can see metrics like Net Sales and Gross Profit from the built-in reports, but many merchants stop there. This gives an incomplete picture.
Here’s what makes profit analytics useful for Shopify merchants:
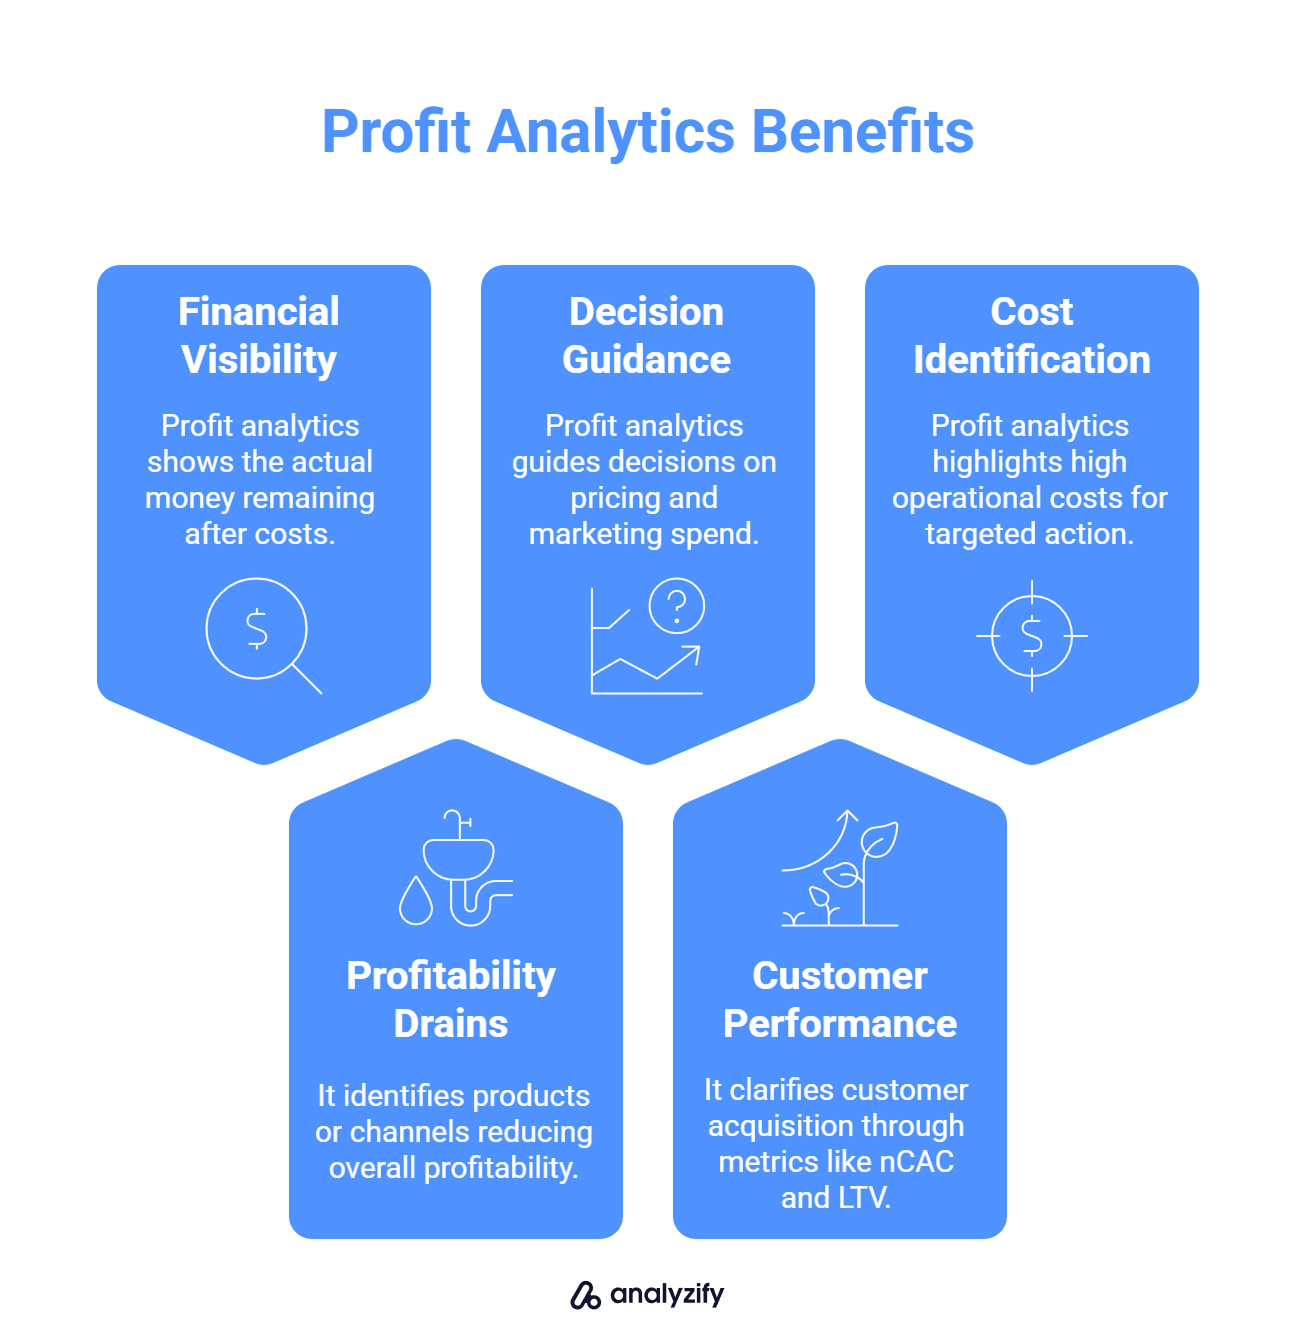
It helps you see how much money stays in the business after all costs, not just how much comes in.
It shows which products, channels, or campaigns are draining profitability even if they drive sales.
It guides decisions around pricing, marketing spend, and inventory by revealing actual margins.
It clarifies customer acquisition performance through metrics like nCAC and Customer Lifetime Value (LTV).
It highlights where operational costs are too high so you can take targeted action.
Many merchants assume they’re profitable based on top-line revenue, but true profit can only be calculated when every cost is taken into account.
Key Metrics to Track in Shopify Profit Analytics
To understand your store’s financial performance, you need to look at more than just sales numbers. Below are the key profit-related metrics every Shopify merchant should track, each plays a different role in showing how your business is doing.
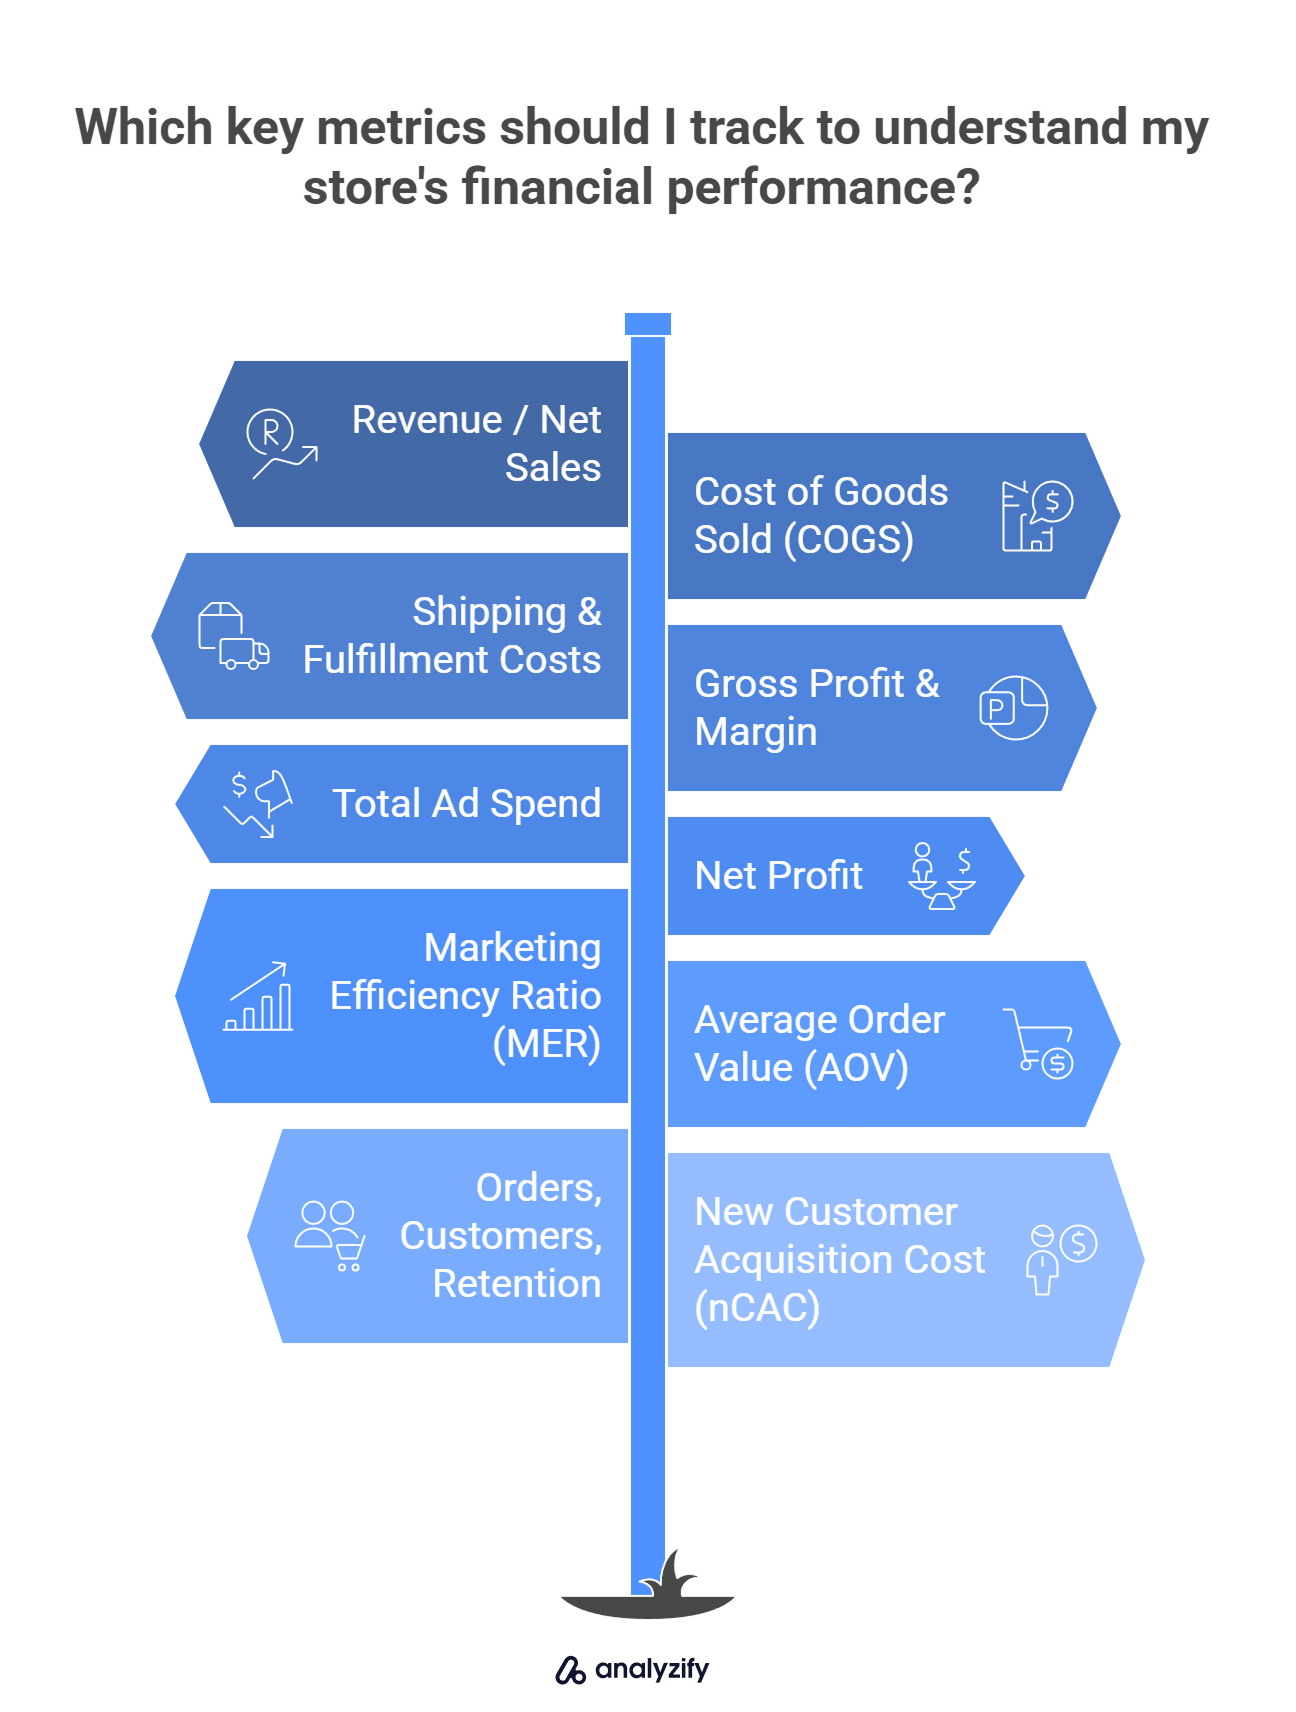
Revenue / Net Sales
This is the total amount earned from sales after subtracting discounts, returns, and taxes. It’s the starting point for all profit calculations.
Important: Net sales do not account for product costs, shipping, or ad spend. It’s not your profit.
Cost of Goods Sold (COGS)
COGS is the total cost of producing or acquiring the products you sold. It includes manufacturing, purchasing, packaging, and sometimes fulfillment fees.
Tip: For accuracy, use dynamic COGS tracking that adjusts with product variants, suppliers, or shipping zones. Static cost fields in Shopify often result in gaps.
Shipping Charges and Fulfillment Fees
These include what you pay to carriers, 3PLs, or fulfillment services to deliver orders. If not tracked, shipping costs can silently reduce your actual margins.
Some merchants add this into COGS, but tracking it separately gives clearer insight into logistics spending.
Gross Profit and Gross Margin
Gross Profit = Net Sales − COGS
Gross Margin = (Gross Profit ÷ Net Sales) × 100
These metrics show how efficiently you’re producing and selling products, before accounting for marketing or overhead.
Gross profit tells you how much you have left to cover all other business costs.
Bonus: What Is GMV And How Does It Work
Total Ad Spend
This is the combined cost of ads across all platforms (Meta, Google, TikTok, etc.). Ad spend is a major variable cost that directly affects profitability.
Make sure you’re tracking this with real-time data. Delayed or missing attribution can skew results.
Net Profit
This is the actual money your store earns after all expenses, including COGS, shipping, transaction fees, ad spend, app subscriptions, and refunds.
Net Profit = Gross Profit − All Additional Expenses
This is the most important number on your dashboard.
Marketing Efficiency Ratio (MER)
MER = Total Revenue ÷ Total Ad Spend
This shows how efficiently your marketing budget generates revenue. It’s different from ROAS, which is campaign-based. MER gives a high-level view across your entire store.
A dropping MER might signal overspending or poor ad performance, even if revenue looks steady.
Average Order Value (AOV)
AOV = Total Revenue ÷ Number of Orders
A higher AOV means more value per transaction. Monitoring this helps when evaluating upsell strategies or bundling effectiveness.
Orders, Total Customers, New vs Returning
These operational metrics help you understand growth, retention, and order flow:
Orders: Track volume trends over time
New Customers: Shows acquisition performance
Returning Customers: Indicates loyalty and repeat purchase behavior
nCAC (New Customer Acquisition Cost)
This is the average cost of acquiring a new customer through paid channels. It’s a critical metric for evaluating how sustainable your growth is.
nCAC = Total Ad Spend on New Customers ÷ Number of New Customers
If nCAC rises too high, you may be spending more than what those customers are worth.
What Shopify’s Built-In Reports Show (and What They Miss)
Shopify provides a set of default financial reports that can give you a quick snapshot of your sales and product-level profitability. But while helpful for basic analysis, these reports leave out several important components needed for accurate profit tracking.
Here’s what Shopify does well, and where the gaps start to appear.
✅ What You Can See in Shopify’s Native Reports
Shopify’s Profit Margin reports include the following metrics for products or variants:
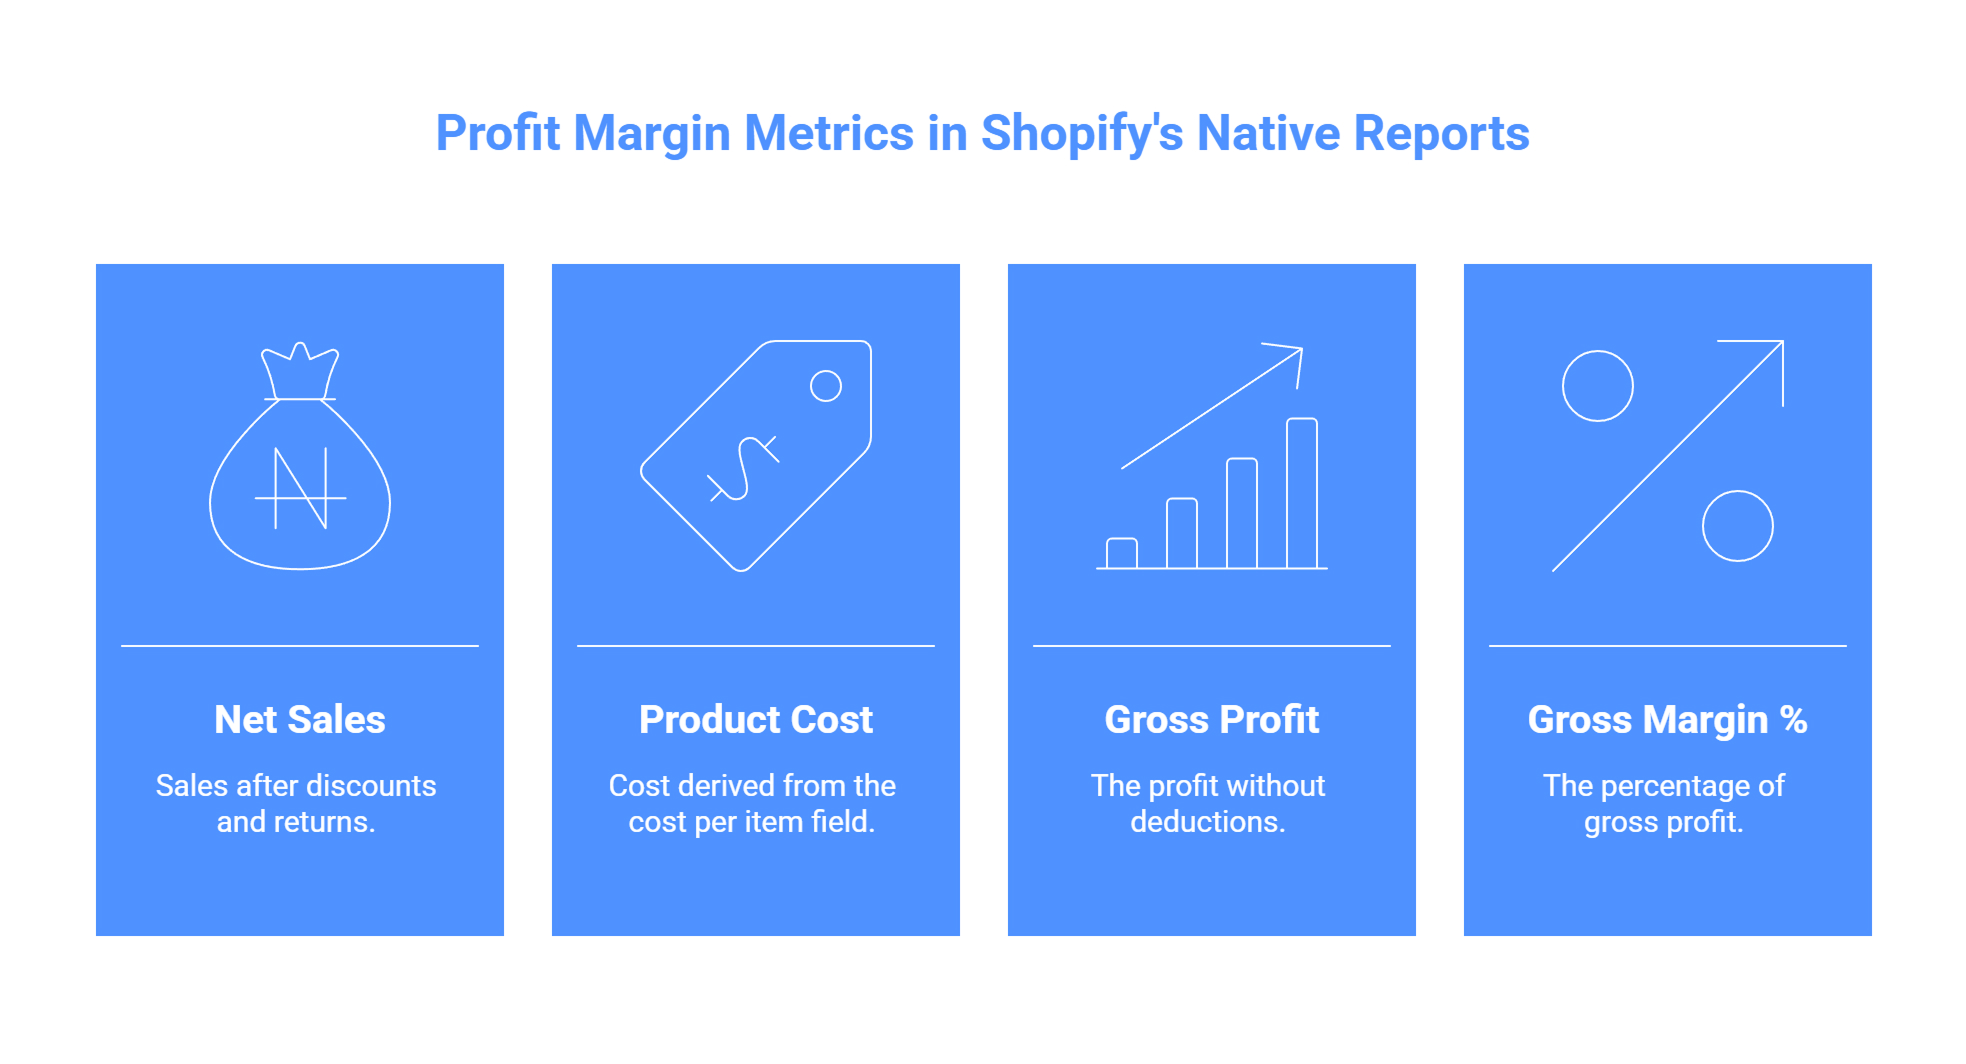
Net Sales (after discounts and returns)
Product Cost (from the “cost per item” field)
Gross Profit
Gross Margin %
These can be filtered by product, variant, POS location, or time period. They’re useful for getting a basic sense of which products have strong margins.
You’ll find them under: Analytics > Reports > Category filter > Profit Margin
❌ What Shopify Doesn’t Track by Default
Despite its reporting tools, Shopify has several limitations when it comes to full profit visibility:
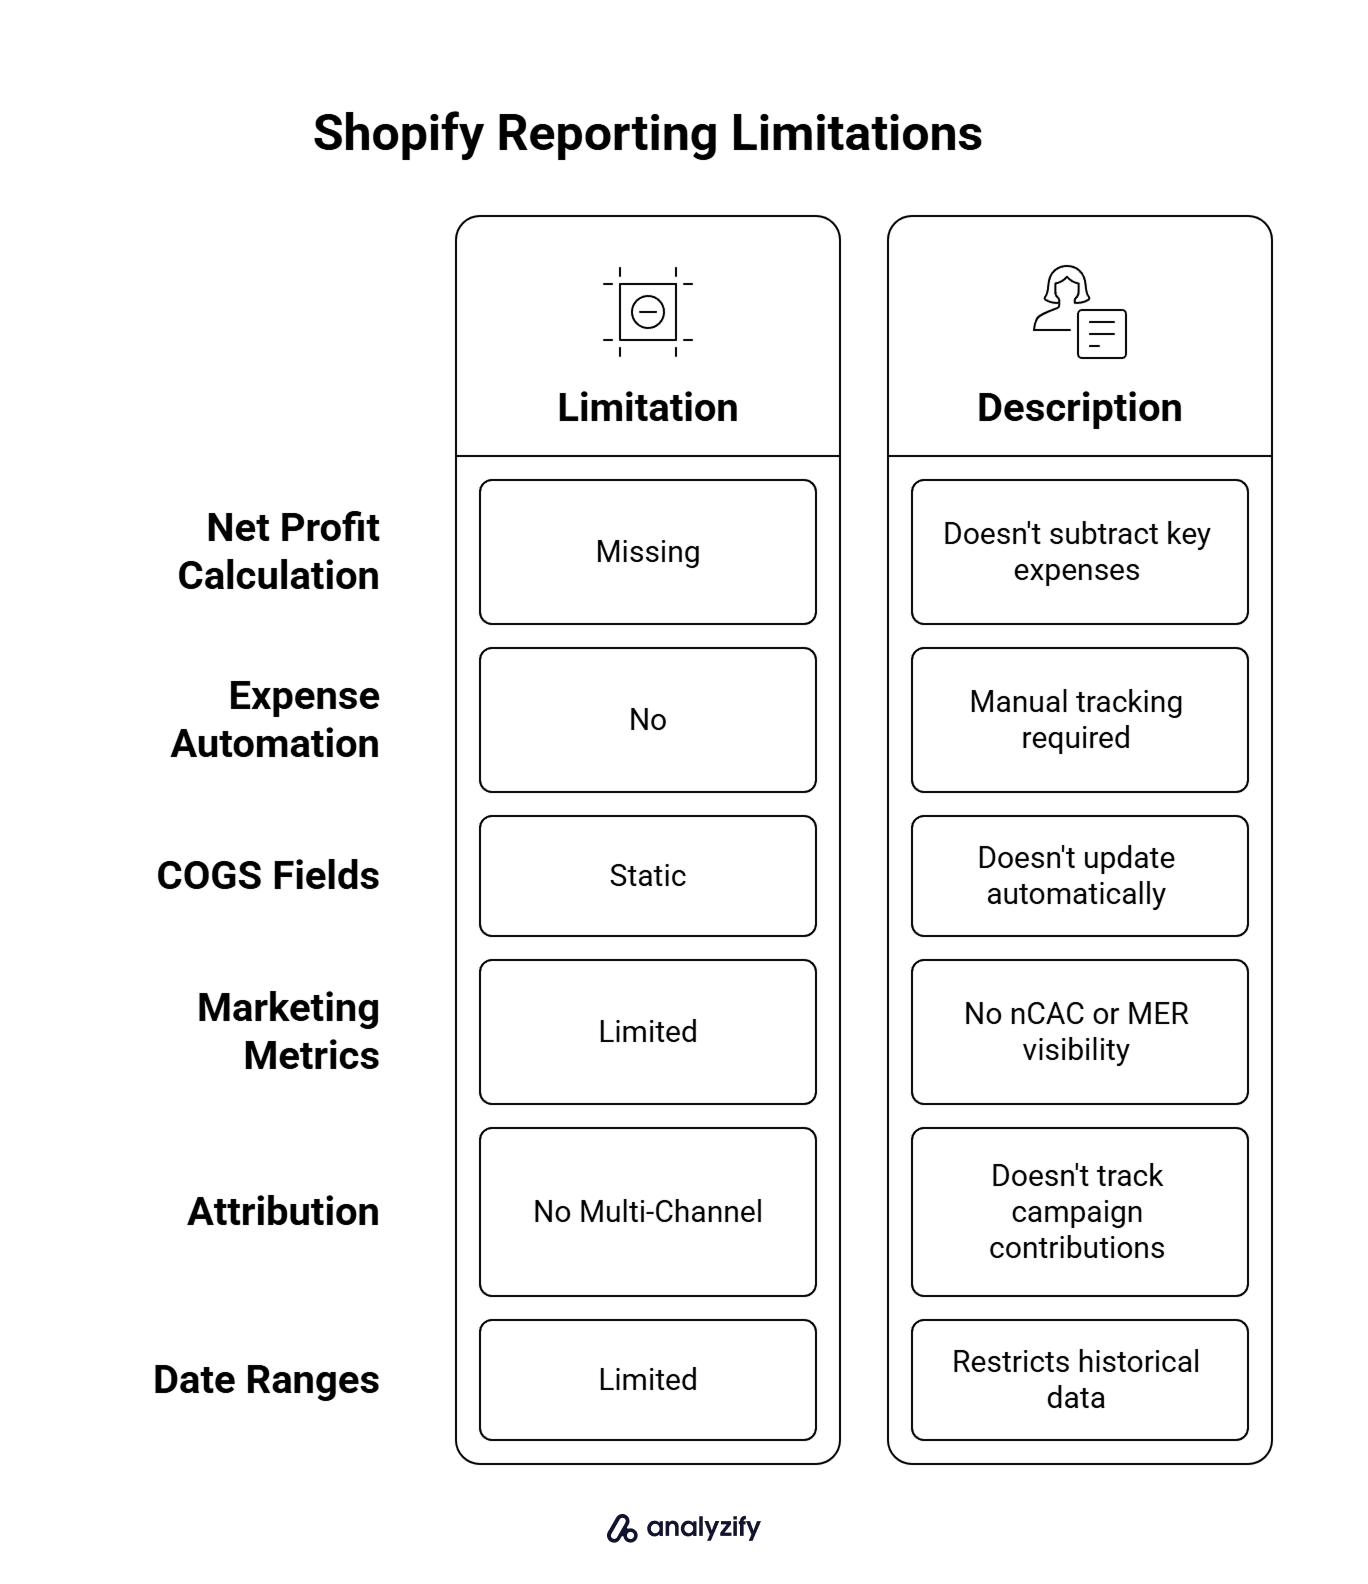
Missing Net Profit Calculation: Shopify doesn’t subtract ad spend, app fees, shipping costs, or transaction fees. So you can’t calculate true bottom-line profit inside Shopify alone.
No Expense Automation: You must manually track and calculate non-product costs. Shopify won’t pull in data from Meta Ads, Google Ads, or fulfillment tools.
Static COGS Fields: The “cost per item” value is static. It doesn’t update if supplier prices or shipping rates change unless you manually edit it.
No nCAC or MER Visibility: These high-level marketing efficiency metrics are not available in Shopify analytics.
No Multi-Channel Attribution: Shopify reports don’t tell you which campaigns, platforms, or touchpoints contributed to the sale unless integrated through third-party tools.
Limited Date Ranges: Some reports restrict historical data, which makes it harder to analyze long-term trends or compare seasonal performance.
 Built for Shopify - No Dev Work Required - Fast Setup
 Standart Tracking Methods Aren't Enough for Shopify
Let Analyzify combine client-side and server-side tracking. So you capture every important event, even when browser script fail.Example
Let’s say your product sells for $50, and your “cost per item” in Shopify is listed as $20. The gross profit is $30.
But if you spent $18 on Meta ads to acquire that customer, $5 on shipping, and $2 in transaction fees, your real profit is just $5.
That breakdown never appears in Shopify’s native reports.
Bonus: Learn Why GA4 Revenue Doesn’t Match Shopify (And How to Improve It)
How to Track Profit More Accurately (Without Guesswork)
If you’re relying only on Shopify reports, it’s easy to overestimate your profitability. To close the gap, you’ll need to either build your own tracking system or use a solution that captures all relevant cost data in one place.
Here are the two main approaches merchants use:
Option 1: Manual Profit Tracking (Spreadsheets)
Some merchants create their own spreadsheets to calculate net profit by manually entering:
![]()
Ad spend from Meta, Google, TikTok
Shipping costs and fulfillment fees
Transaction fees from payment gateways
App subscription costs
Refunds and discounts
Dynamic product costs (if suppliers change pricing)
This method gives you control, but it’s time-consuming, error-prone, and not real-time.
For small stores with a limited product range and consistent pricing, spreadsheets might be enough. But as you scale, manual tracking becomes unsustainable.
Option 2: Use a Profit Tracking Tool
There are tools specifically built to track Shopify profit metrics automatically. We’re not naming or recommending any app here, but a good solution typically includes:
![]()
Real-time syncing of costs across ads, shipping, and payment processors
Dynamic COGS tracking based on product variant, region, or fulfillment method
Automated P&L reports with complete cost breakdowns
Marketing attribution features (so you can see profit by channel or campaign)
nCAC and MER calculations tied directly to your customer and ad data
Support for refunds, taxes, custom fees, and returns
Mobile dashboards and exports to check profit on the go
These tools eliminate the need for manual data pulling, and they help prevent the blind spots that cause merchants to misread performance.
If you choose to use an external solution, focus on one that shows net profit at the product and customer level, not just revenue or ROAS. That’s where true optimization happens.
How to Use Shopify Profit Reports to Make Smarter Business Decisions
Shopify profit reports are only useful if you know how to interpret the numbers together. Here is how to spot common patterns, troubleshoot confusing results, and avoid false confidence from surface-level data.
How to Spot When Revenue Growth Doesn’t Mean Higher Profit
A common mistake is assuming that increasing sales equals better performance. That’s not always true. Here’s how to tell if your revenue growth is actually helping your bottom line:
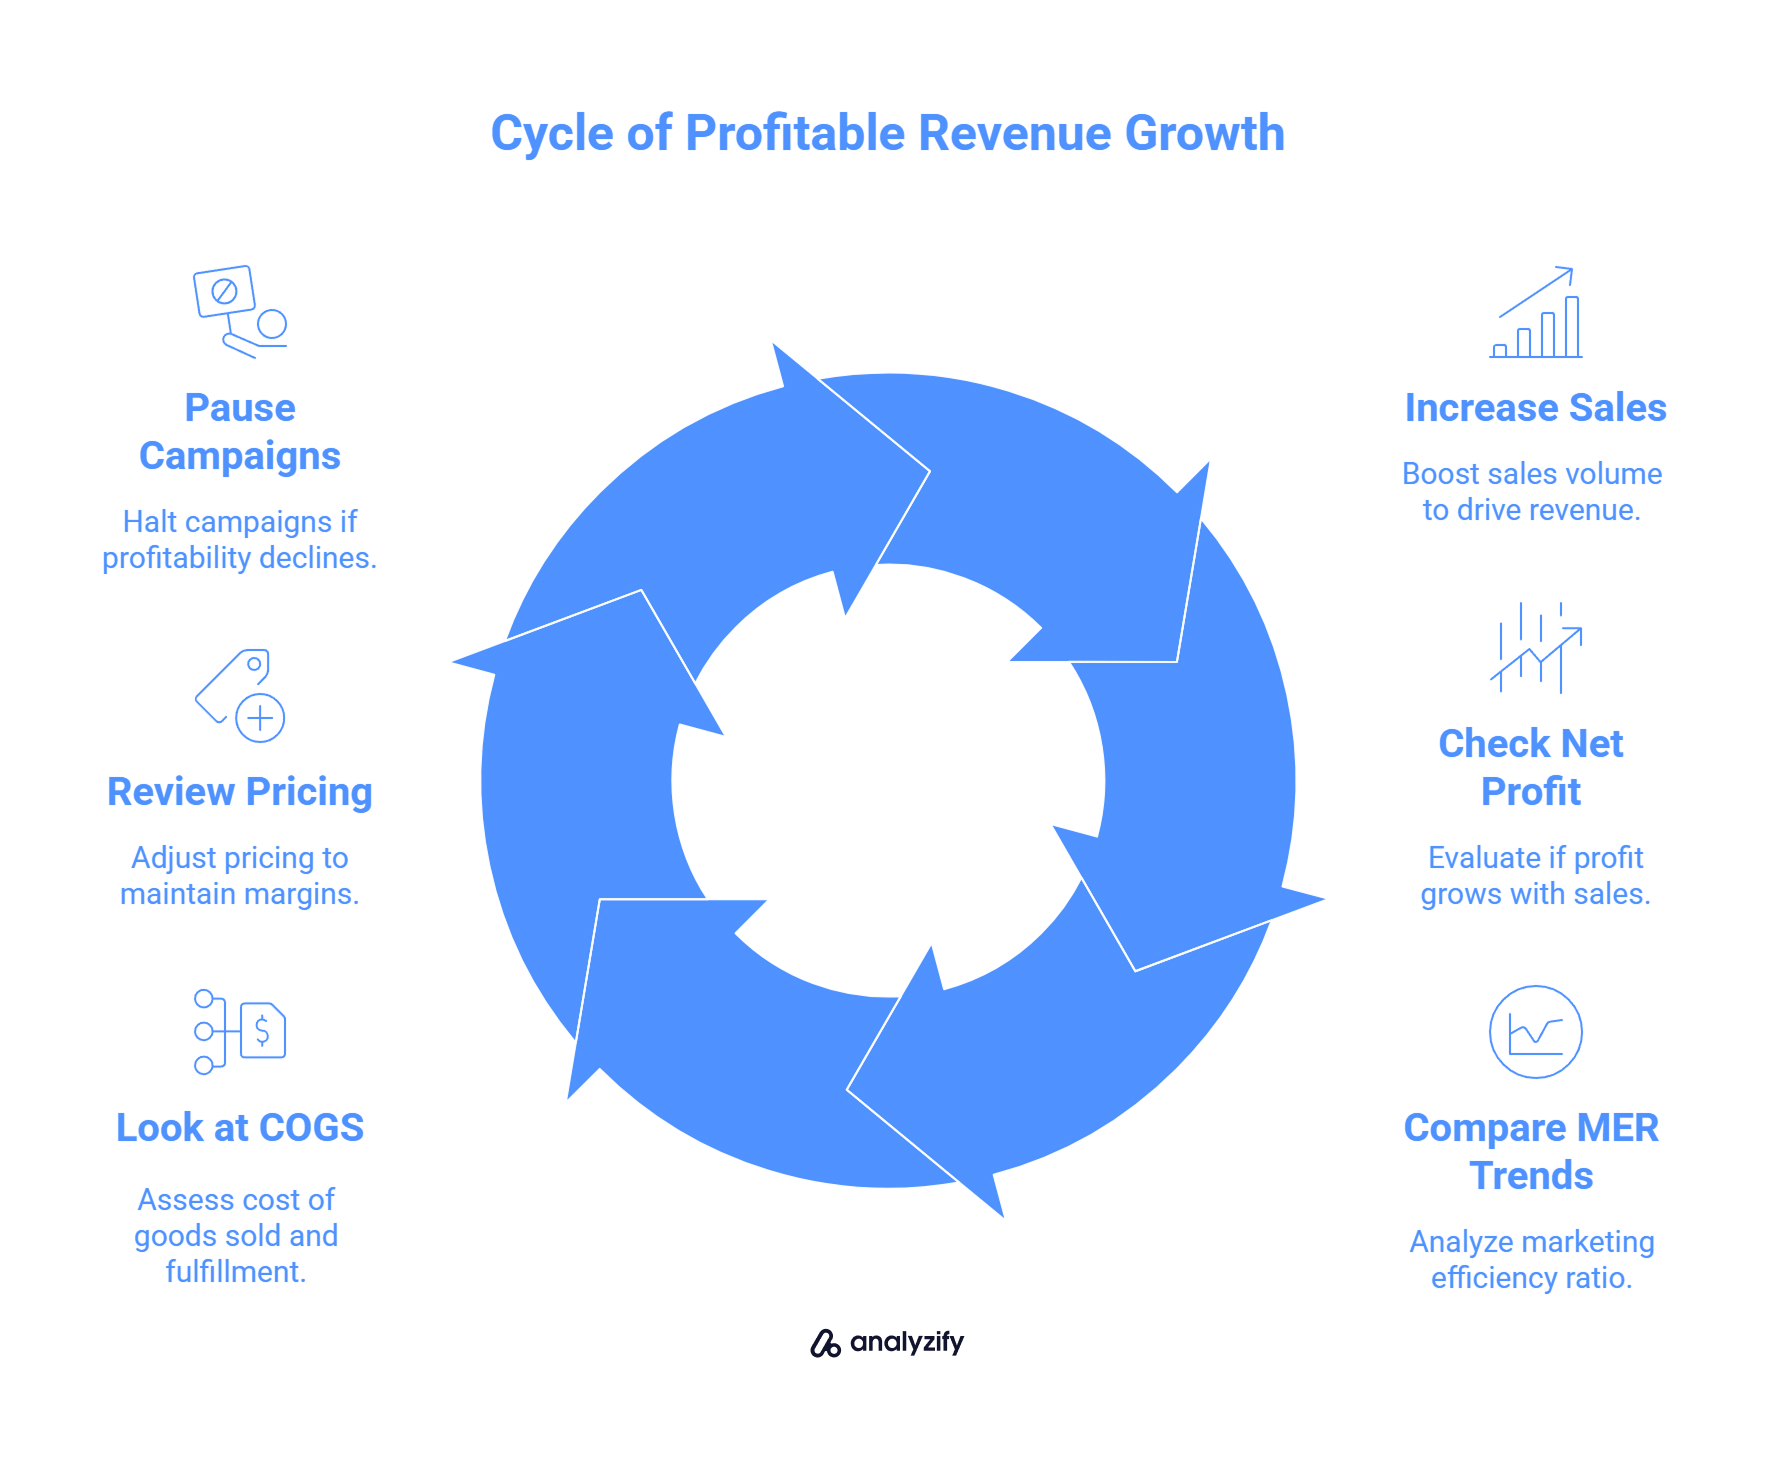
Check Net Profit Alongside Revenue: If net profit isn’t increasing at the same pace (or is dropping), you’re likely spending more to generate sales than before.
Compare MER Trends: A declining MER means your ad spend is growing faster than revenue. If revenue is up but MER is falling, your profitability is weakening.
Look at COGS and Fulfillment Costs: Higher volume can mean higher total costs. If margins are slim to begin with, added shipping and handling may cancel out gains.
If you’re seeing more revenue but profit margins are narrowing, it may be time to pause new campaigns or review pricing.
Built for Shopify - No Dev Work Required - Fast Setup Missing Conversions in GA4 or Meta Ads?
Standart browsing tracking misses conversions - Analyzify adds Server-side tracking for accurate GA4 & Meta reports.Which Metrics to Compare for Reliable Insights
Viewing one metric in isolation rarely gives you the full picture. These metric pairings help highlight the real state of your business:
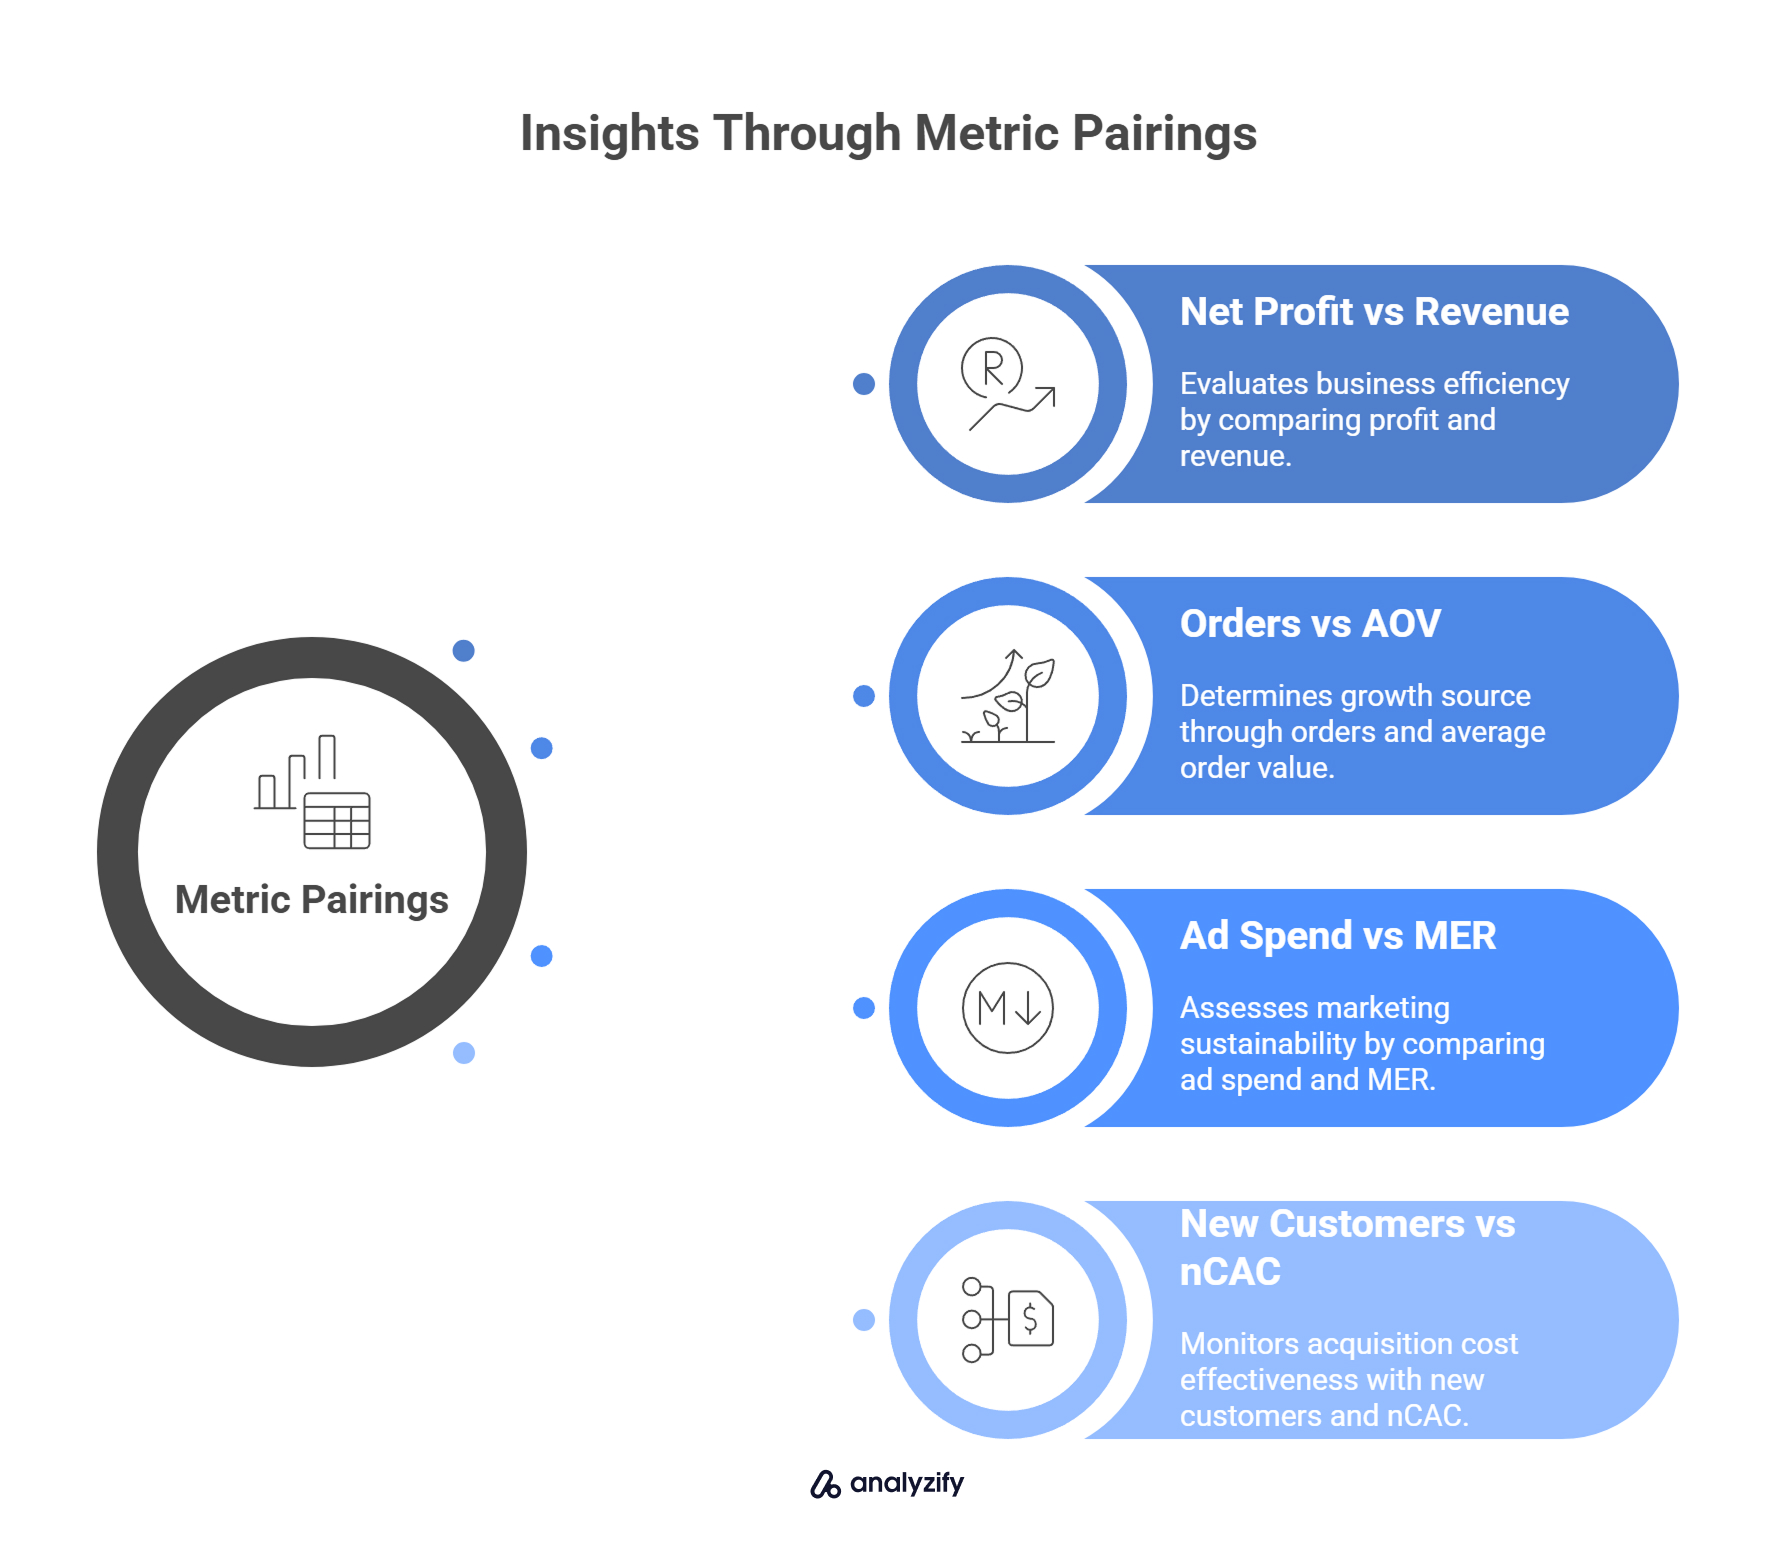
Net Profit vs Revenue: Indicates efficiency. High revenue but flat profit usually signals rising costs.
Orders vs AOV: Helps detect whether growth is coming from more transactions or larger baskets.
Ad Spend vs MER: Tells you whether marketing is scaling sustainably or eating into your budget.
New Customers vs nCAC: Reveals if your acquisition cost is staying in check as you grow.
Look at changes between these values over time, not just in a single report view.
How to Identify Hidden Profit Drains in Your Shopify Reports
Some costs or losses won’t jump out immediately. Here’s where to look:
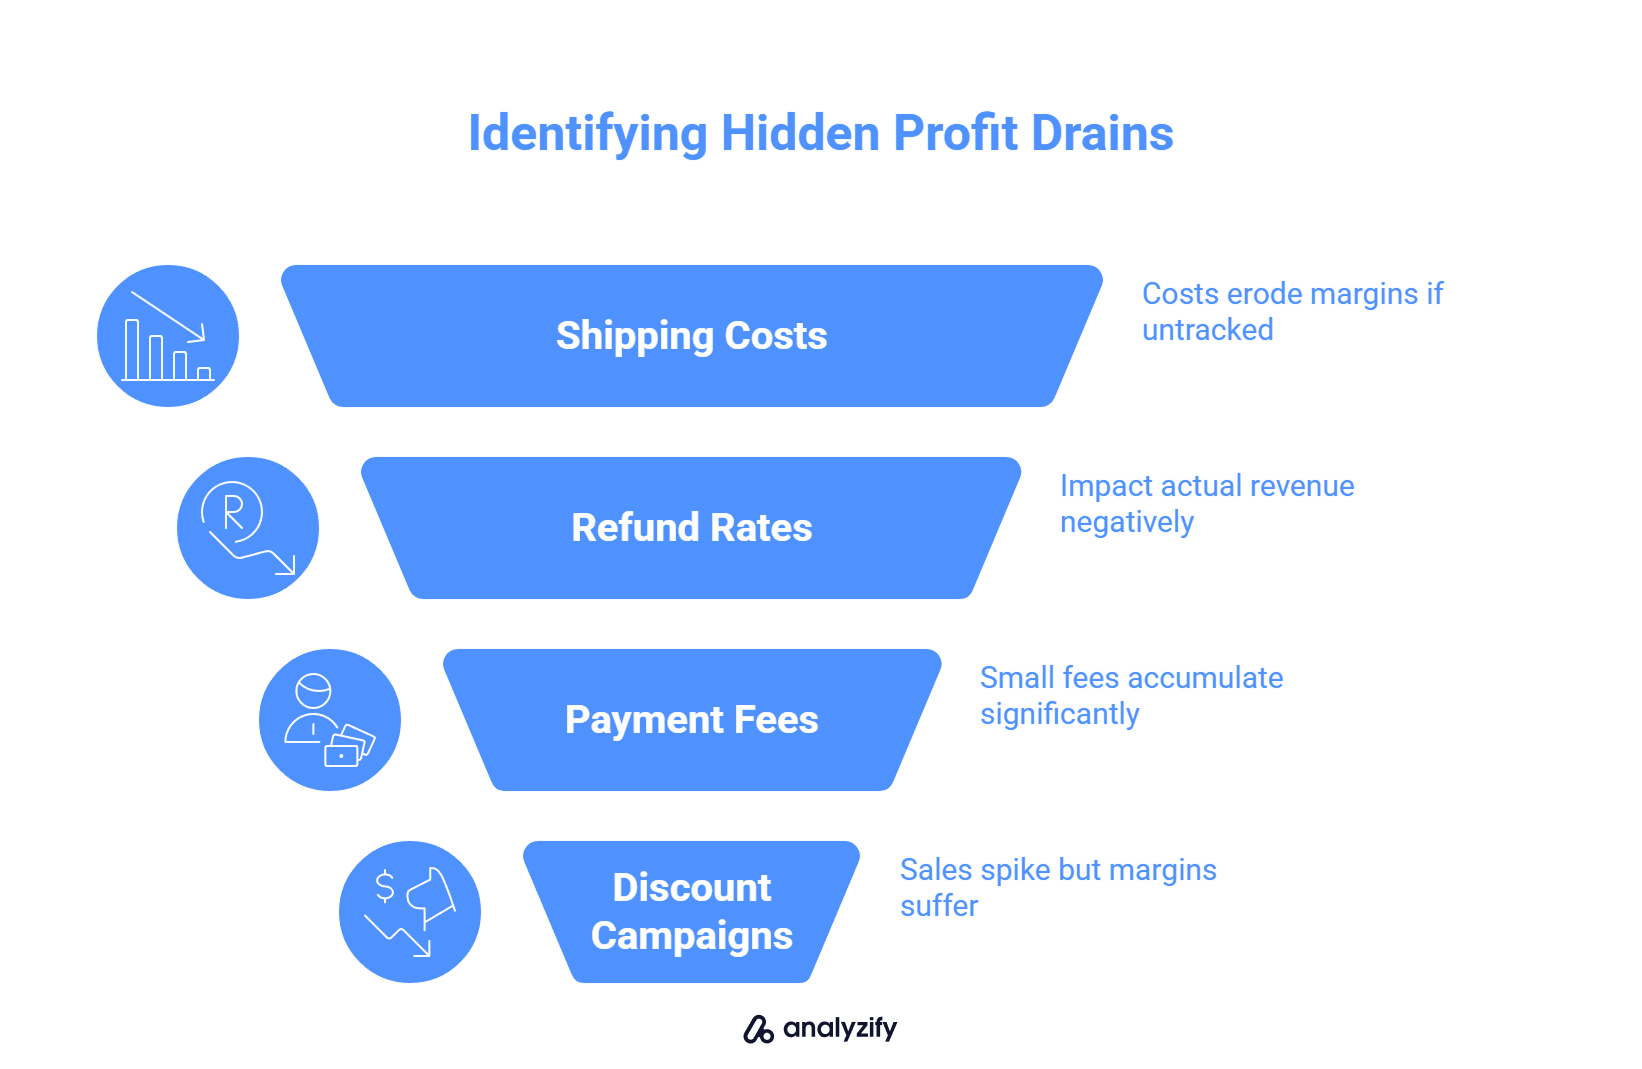
Shipping and fulfillment costs: If they aren’t tracked separately, they can slowly erode margins without obvious warning signs.
Refund and return rates: These impact your actual revenue and are often excluded from top-line reports.
Payment processing and app fees: Shopify doesn’t always break these out. Small per-order fees can become significant at scale.
Discount-heavy campaigns: Sales may spike, but if most orders came from discounts, margins may have suffered.
If your gross margin looks stable but net profit is shrinking, it’s usually due to one of these hidden drains.
Why It’s Important to Monitor Profit Trends Over Time
Looking at one day or one week in isolation often leads to the wrong conclusions. Use time-based comparisons to:
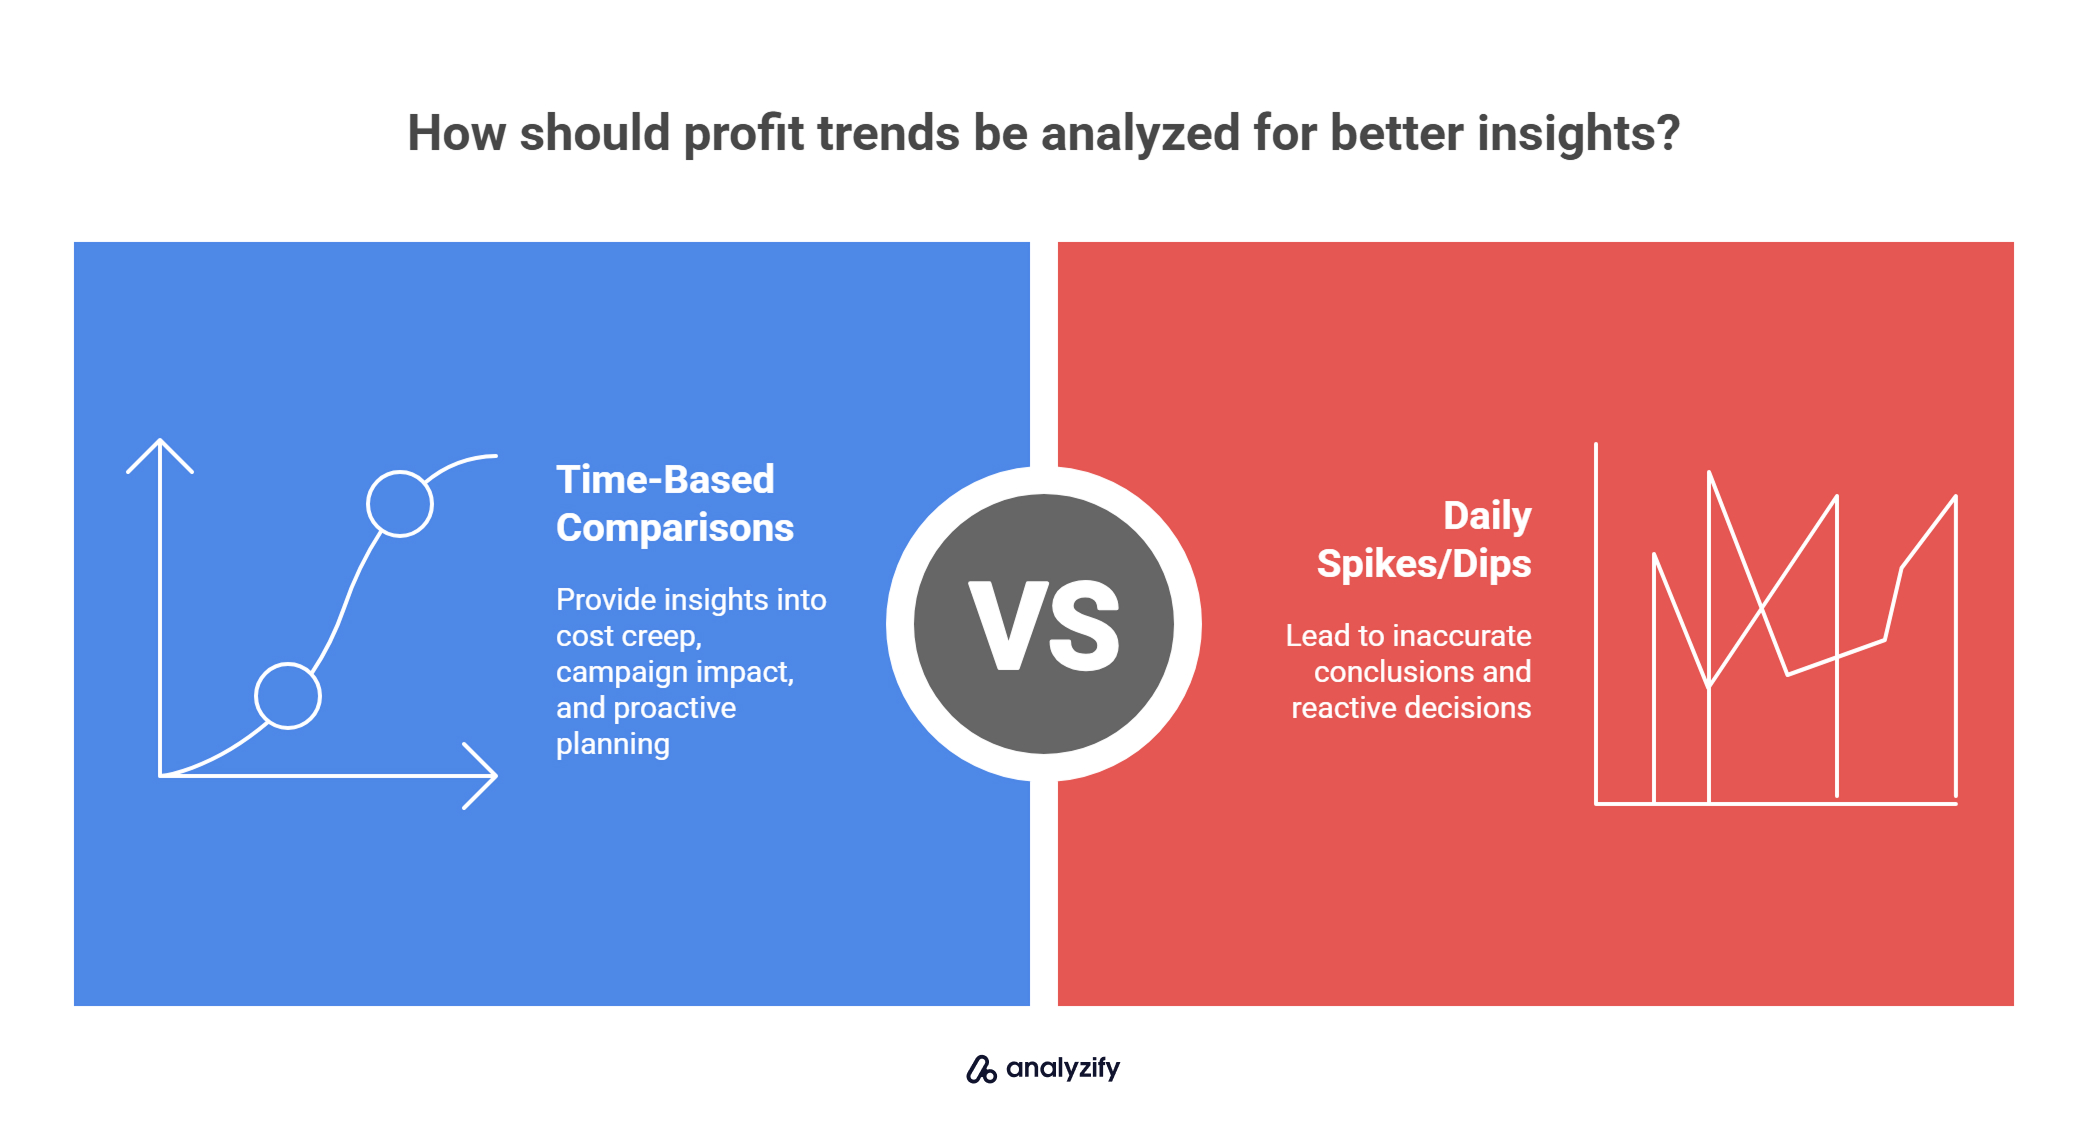
Spot cost creep: A slow increase in shipping, ad spend, or COGS can be missed without month-over-month views.
Track campaign impact: Did a new campaign bring better customers, or just more one-time buyers at a discount?
Plan proactively: Knowing your profit pattern over quarters helps you stock inventory, manage cash flow, and set realistic ad budgets.
The most actionable insights come from comparing consistent metrics over time, not from reacting to daily spikes or dips.
Conclusion: Focus on Profit, Not Just Sales
Shopify makes it easy to see how much you’re selling, but not how much you’re truly earning. To run a profitable business, you need more than revenue reports. You need visibility into costs, margins, and customer acquisition efficiency.
Start by understanding which metrics matter most: net profit, COGS, MER, and nCAC among them. Then, make sure you’re capturing all related costs, whether manually or through a tool that automates the process.
Here’s what matters:
Use Shopify’s native reports as a starting point, but don’t assume they cover everything.
Track your full cost structure, including shipping, ad spend, and refunds.
Read your reports in context, comparing multiple metrics over time to spot real trends.
Look beyond surface metrics, especially when evaluating product or campaign performance.
With the right setup, your profit analytics can do more than summarize past performance. They can help you make better decisions every day.