
Google has just launched an exciting update for Performance Max advertisers: Reports at the Asset Group level.
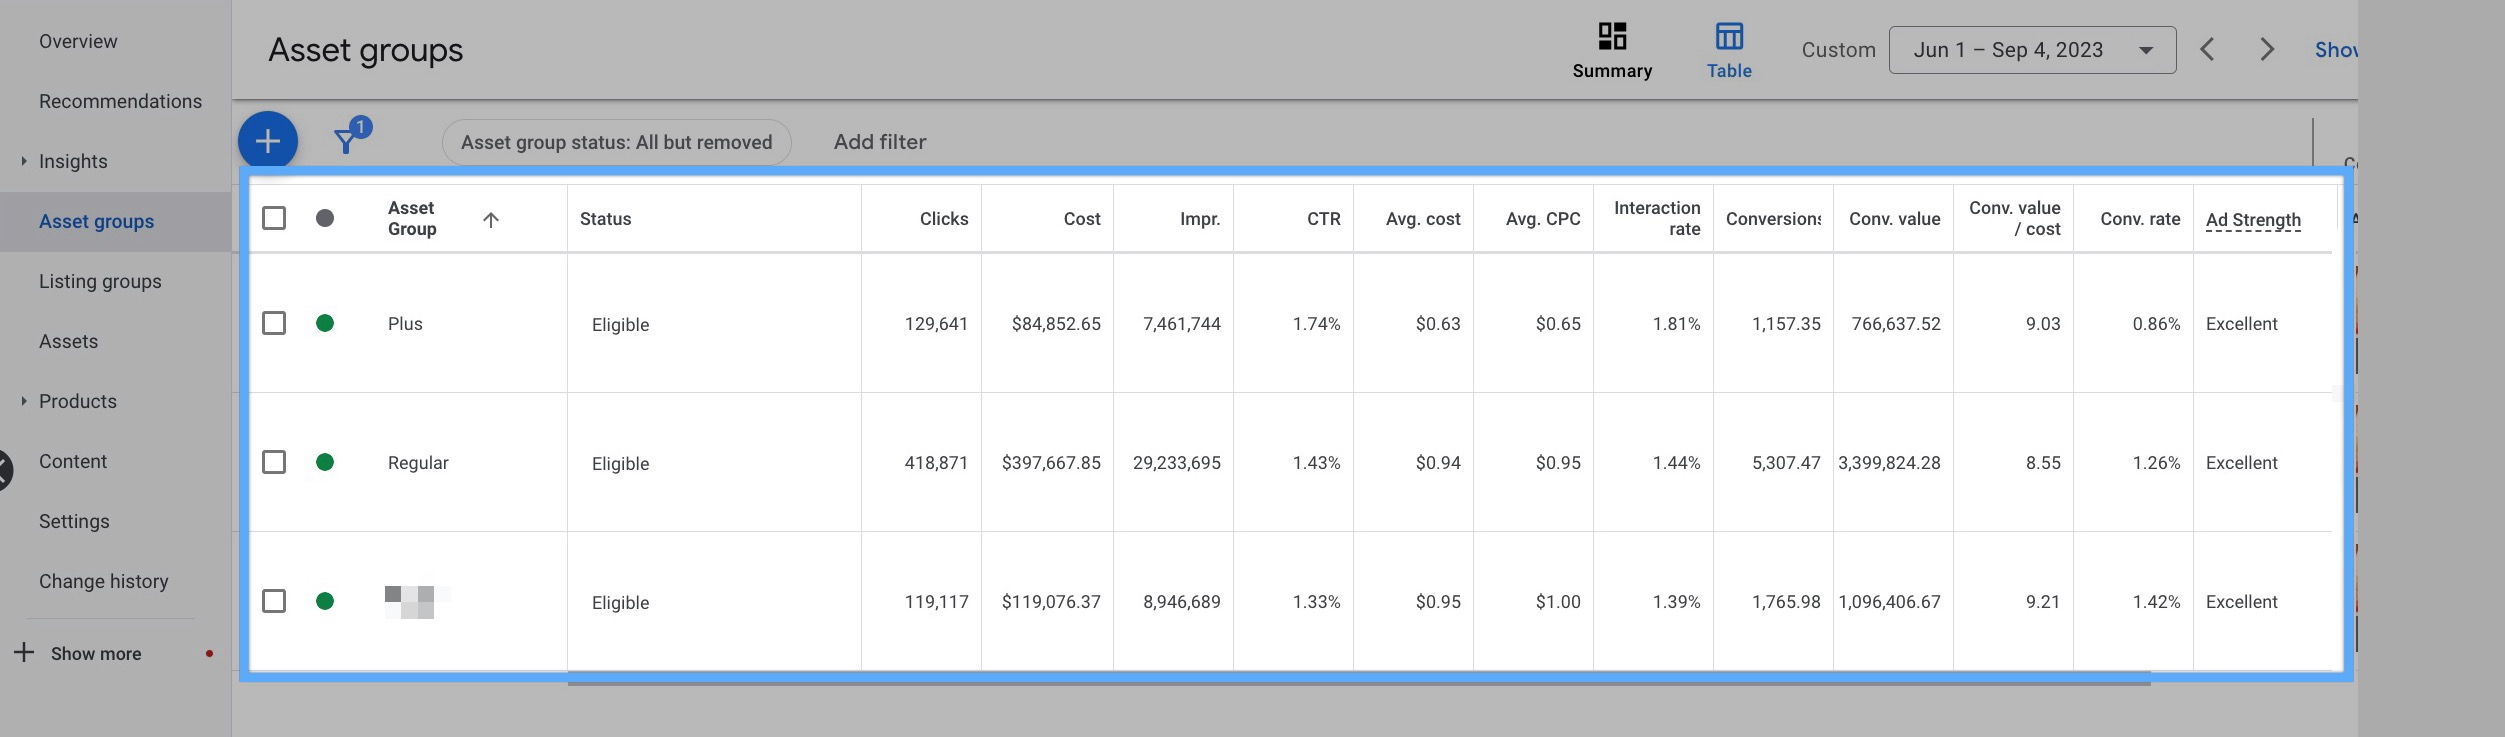
With these reports, you can now finally see the classic performance metrics such as clicks, costs, impressions, CTR, conversions and so on.
Performing insightful analyses, you can better evaluate the asset group level performance and take necessary actions.
While it depends on your business, Ads strategy, and many other metrics, you can use the data on your reports to:
- Create new separate campaigns for the asset groups that perform well
- Exclude the ones that do not impress
Let’s discover more without further ado!
How to Find the Asset Group Report on Google Ads?
You can find the Performance Max Asset Group report on Google Ads very easily.
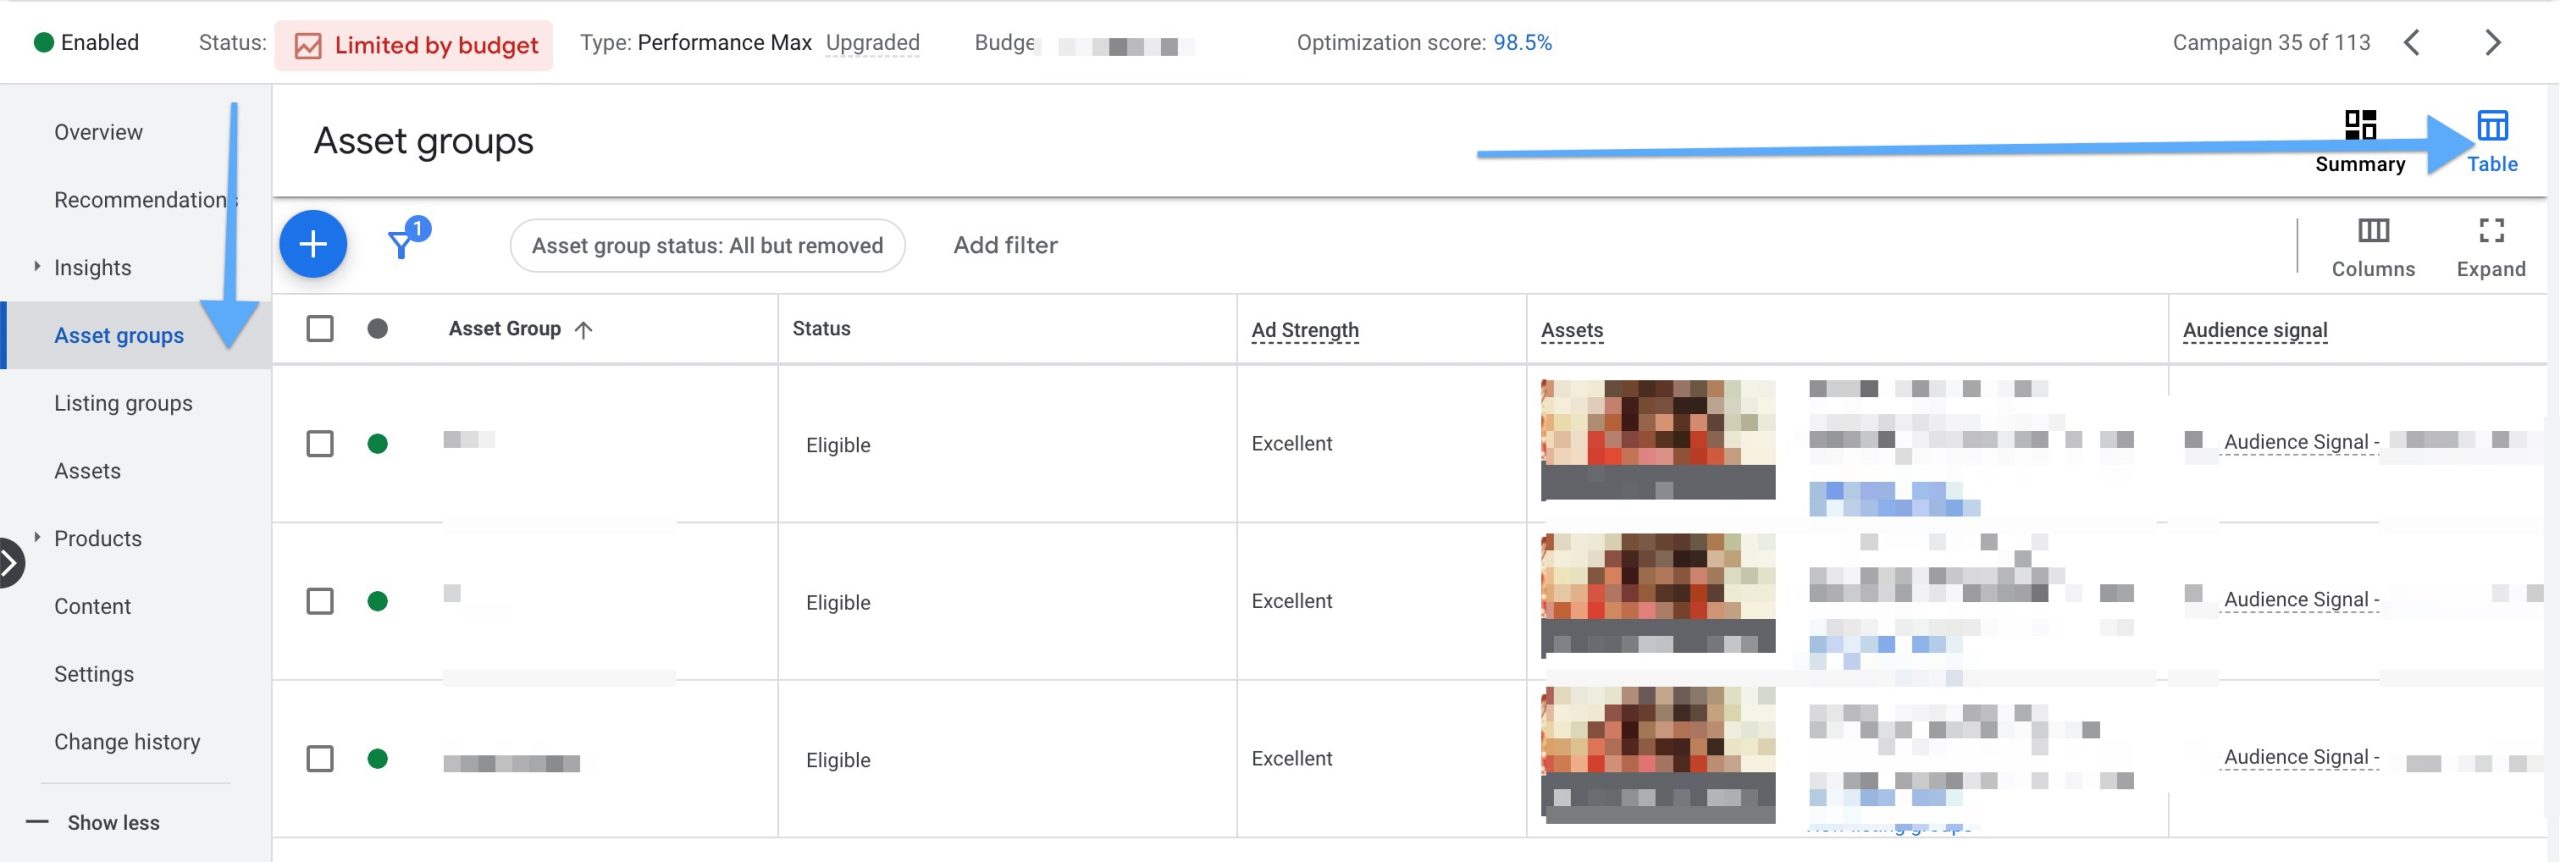
To view this valuable report, just navigate to Google Ads > Campaigns > PMax Campaign > Asset Groups.
Then, you will see the “Summary” table by default.
Here, you should click “Table” next to the “Summary” icon as seen below:
You can also add more to the report, such as new metrics, by clicking “Columns”.
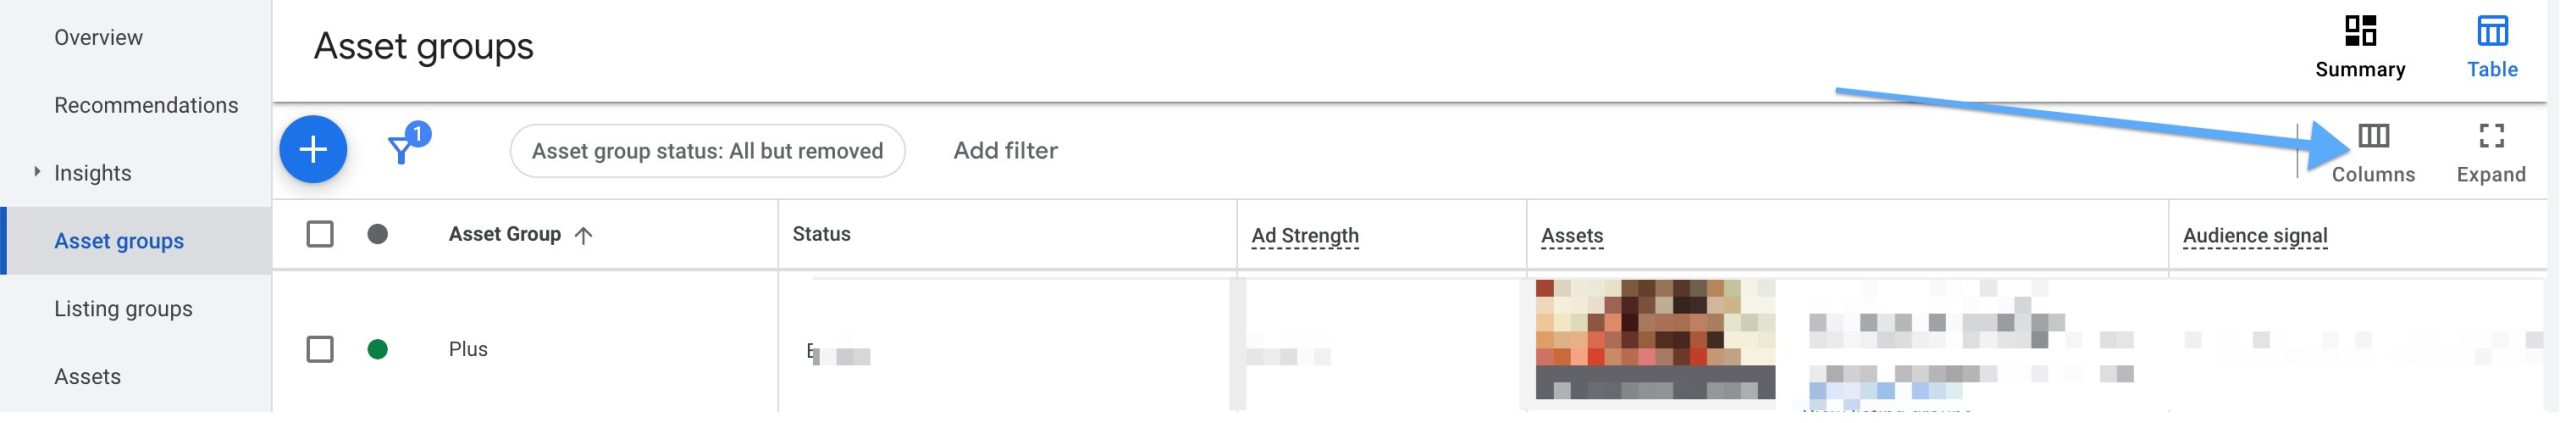
Then, you can customize the report table for further analysis according to the metrics you want to see.
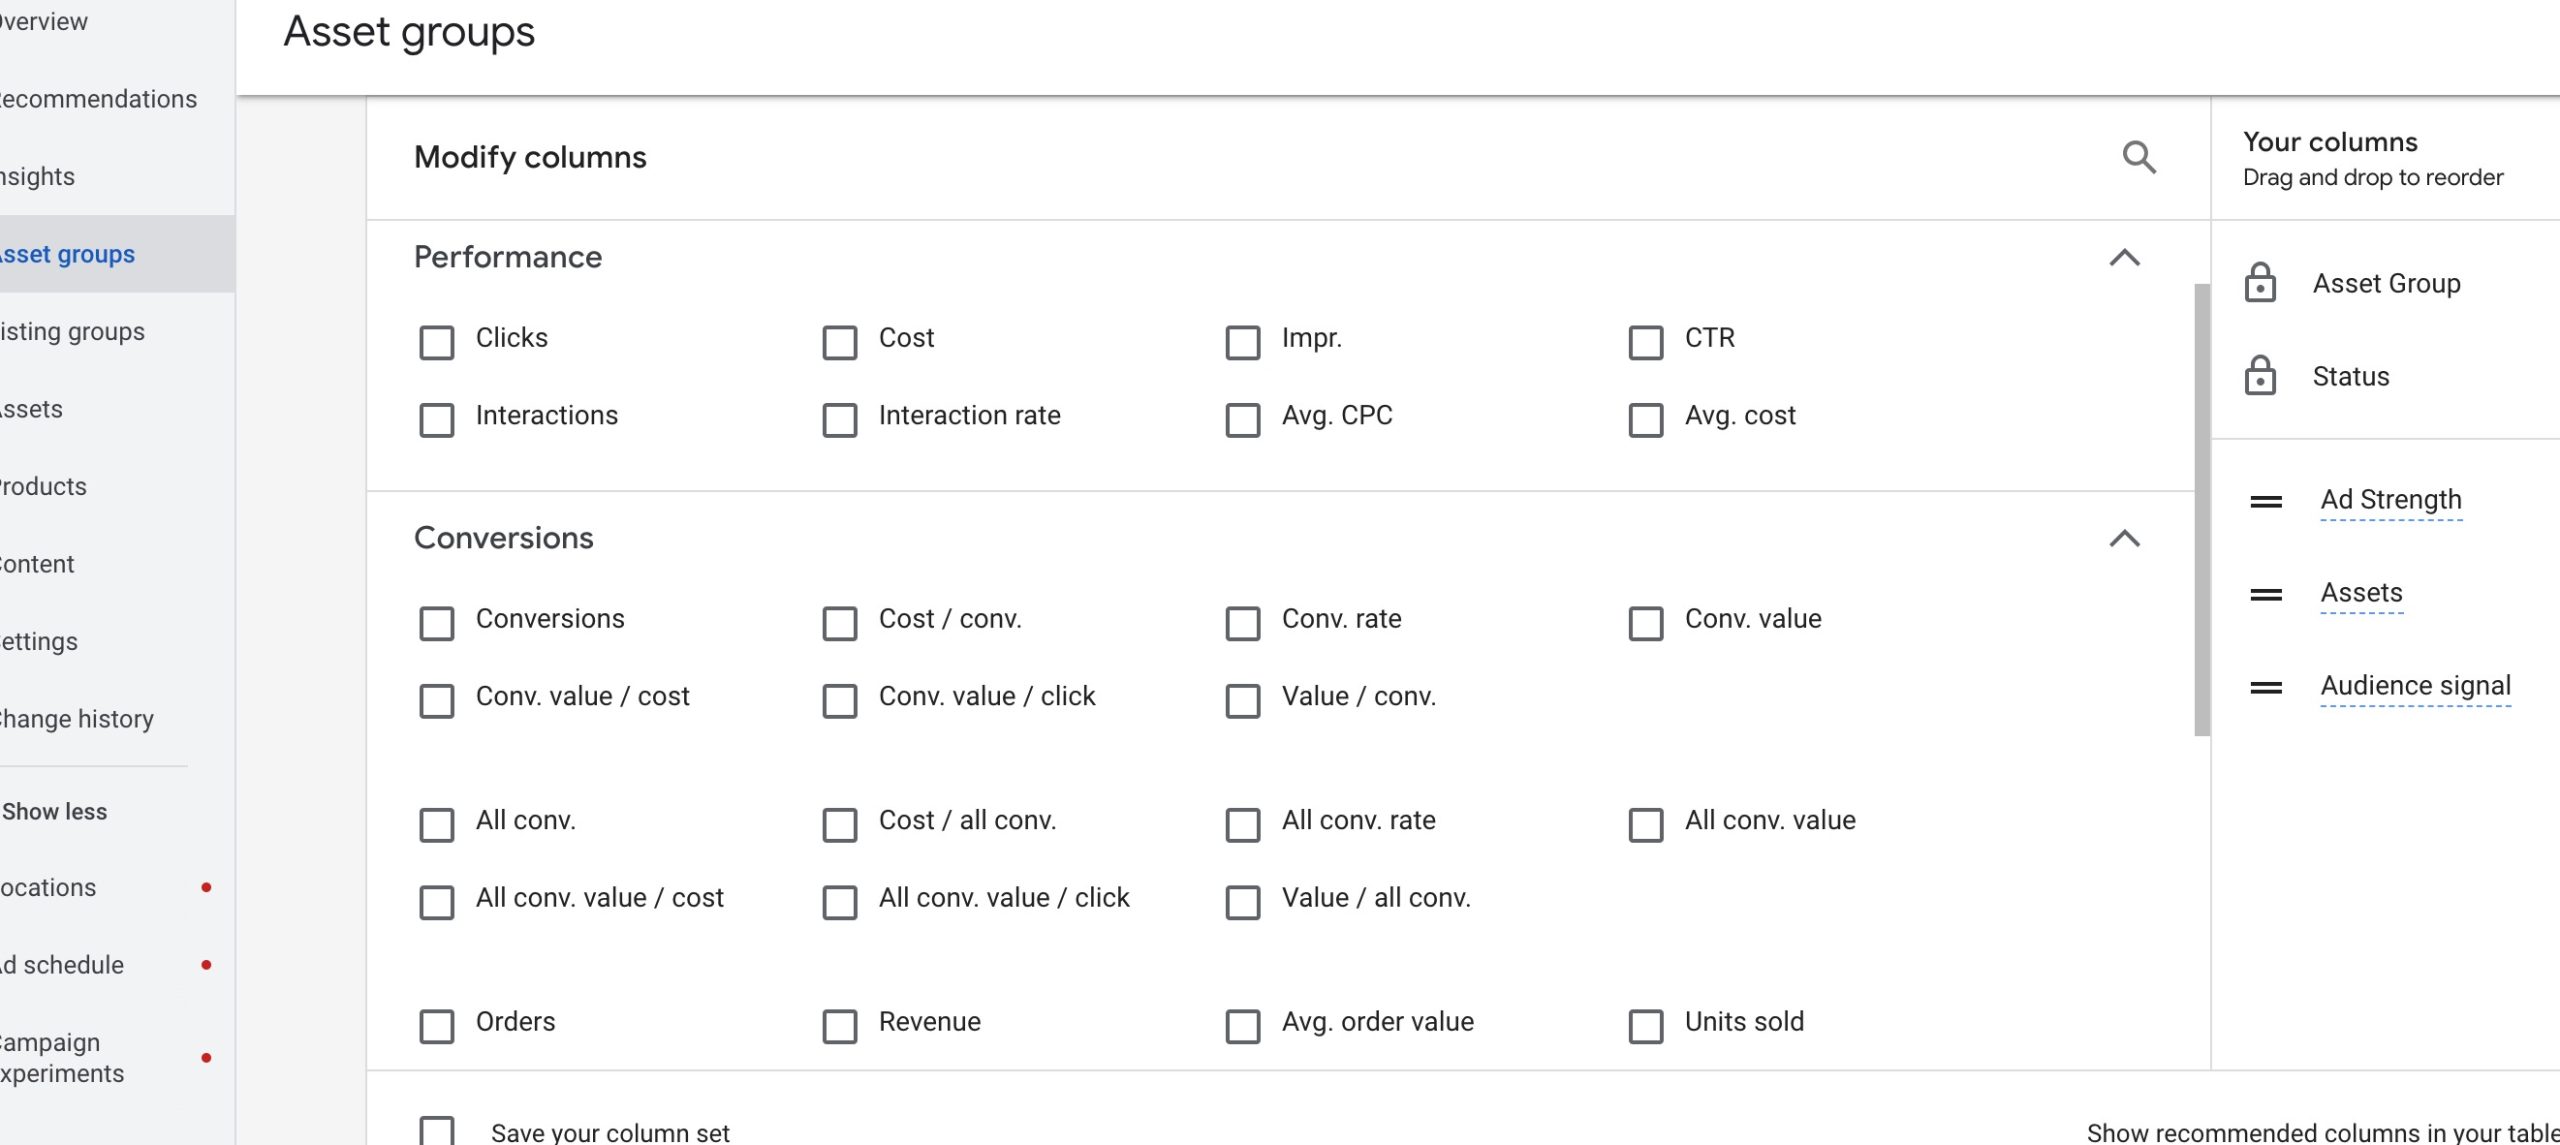
At this point, you are recommended to check the following metrics: “Clicks, Cost, Impressions, CTR, Avg Cost, Avg CPC, Interaction Rate, Conversions, Conv. Value, Conv. Value/Cost, Conv. Rate, Ad Strength”
You don’t have asset groups to see the performance and compare? Well, probably you should create first. 👇
Why Create Asset Groups on Performance Max Campaigns?
If you are familiar with Google Ads Search Campaigns structure, you can think of asset groups as “Ad Groups”.
Creating different asset groups can help you:
1. Use different ad copies or product images for different audiences or product groups.
Example: Say you are selling “Phone Cases” for “iPhone 13” and “iPhone 13 Pro”. Then, you can create these two as different asset groups and use relevant images and ad copies.
2. Target different Audiences Signals (search terms by creating custom segments, or audiences)
Example: You can add “iphone 13 pro” search term to the relevant asset group.
3. See the performance broken down into categories.
Example: You can see the performance of “13” and “13 Pro” products separately.
4. Create new & separate campaigns for the ones that perform better.
Example: “13 Pro Phone Cases” might be performing much better. You can see this with the Asset Group report and consider creating a separate campaign so it has its own budget.
Asset Group Options for Ecommerce
Convinced? Now, let’s check what could be the cases to create separate asset groups.
PS: You can always create different campaigns for the same cases, as well.
Product Groups or Brands
Let’s say you are selling products on different sub-categories or brands.
In this case, it would be wise for you to create asset groups such as:
PMax Campaign 1: Phone Cases - iPhone
Asset Groups:
- iPhone 13 Pro
- iPhone 13
- iPhone 14
- iPhone 14 Pro
PMax Campaign 2: Waterproof Phone Cases
Asset Groups:
- iPhone
- Android
High ROAS Products
Depending on your strategy and budget, you can always create different campaigns or Asset Groups for high ROAS products.
You can try creating an asset group for this as a starting point to test the hypothesis. Later, you can convert it to a new campaign.
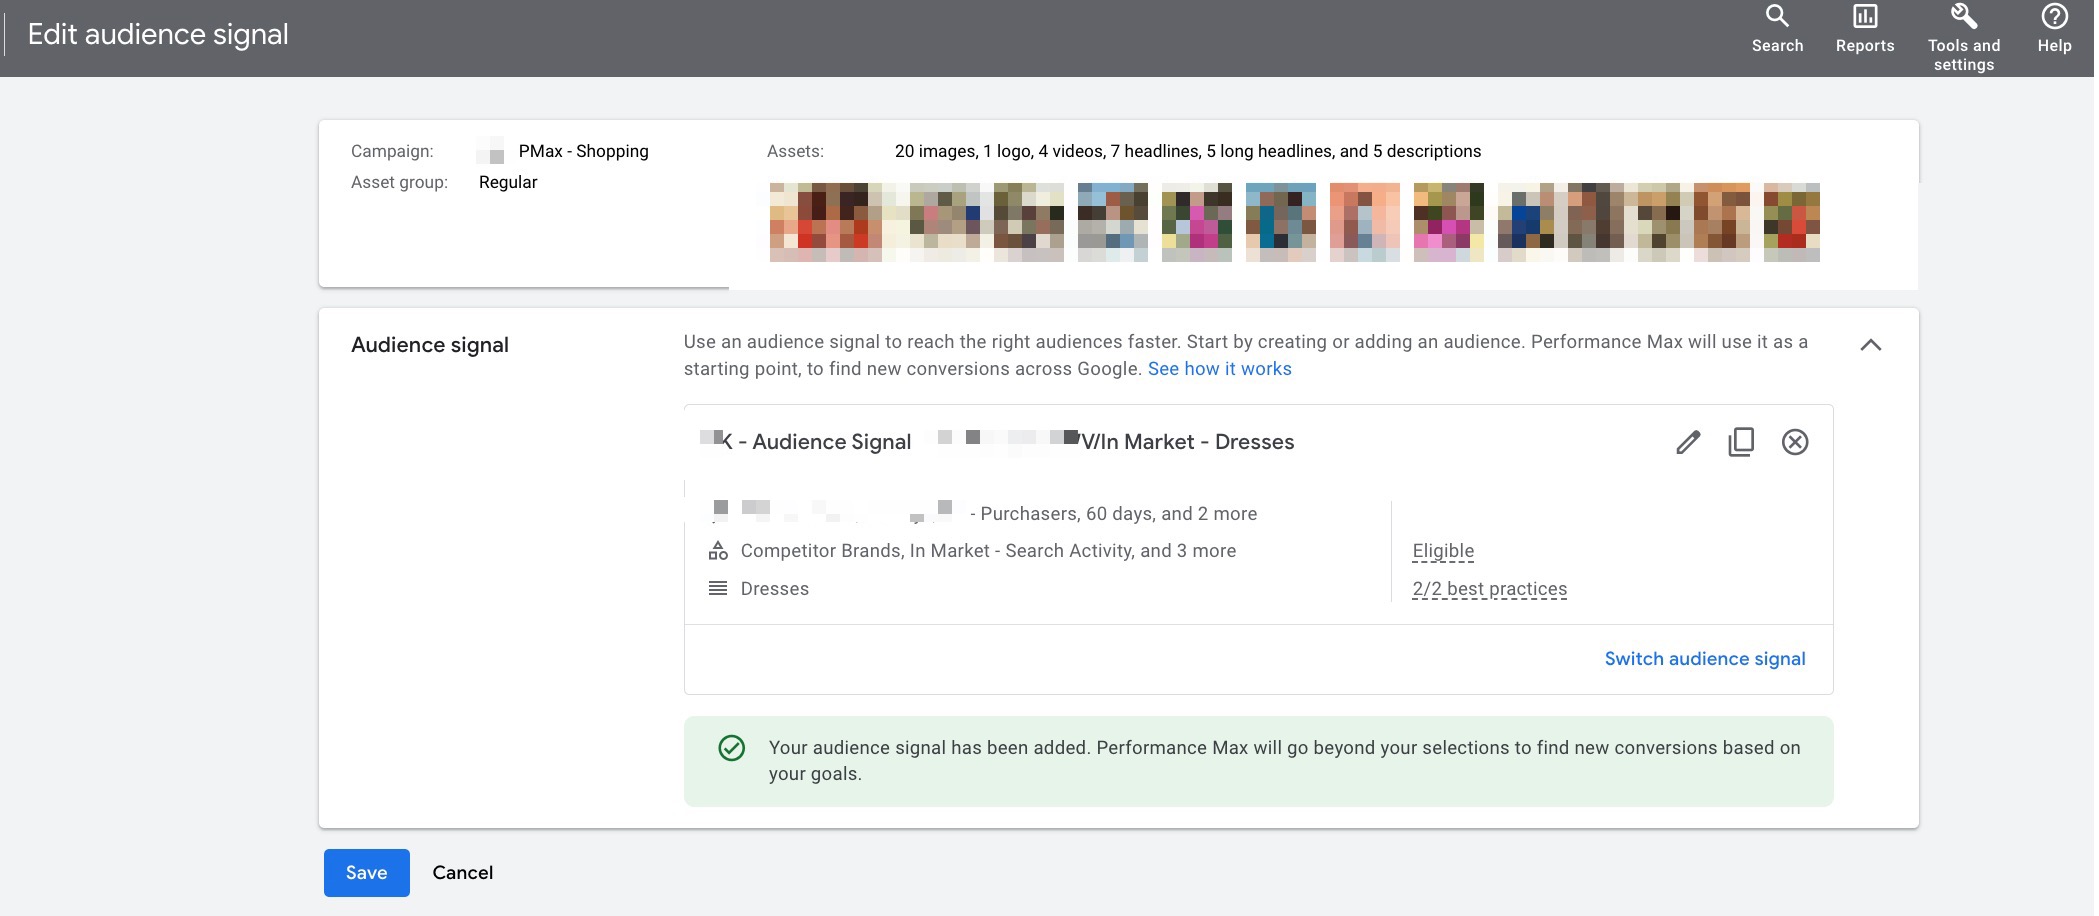
Product Attributes (Size, color, etc)
Setting some certain product attributes can be very useful.
For instance, if you sell clothing products, you can create different asset groups for different COLORS or SIZES.
Then, you can evaluate the better performers.
Here’s an example:
PMax Campaign: Wedding Dresses
Asset Groups:
- Pure White
- Pale Skin
- Cream
- Plus Size
This way, you can use relevant images and ad copies for different groups and this will more likely increase your CTR and conversion rate.
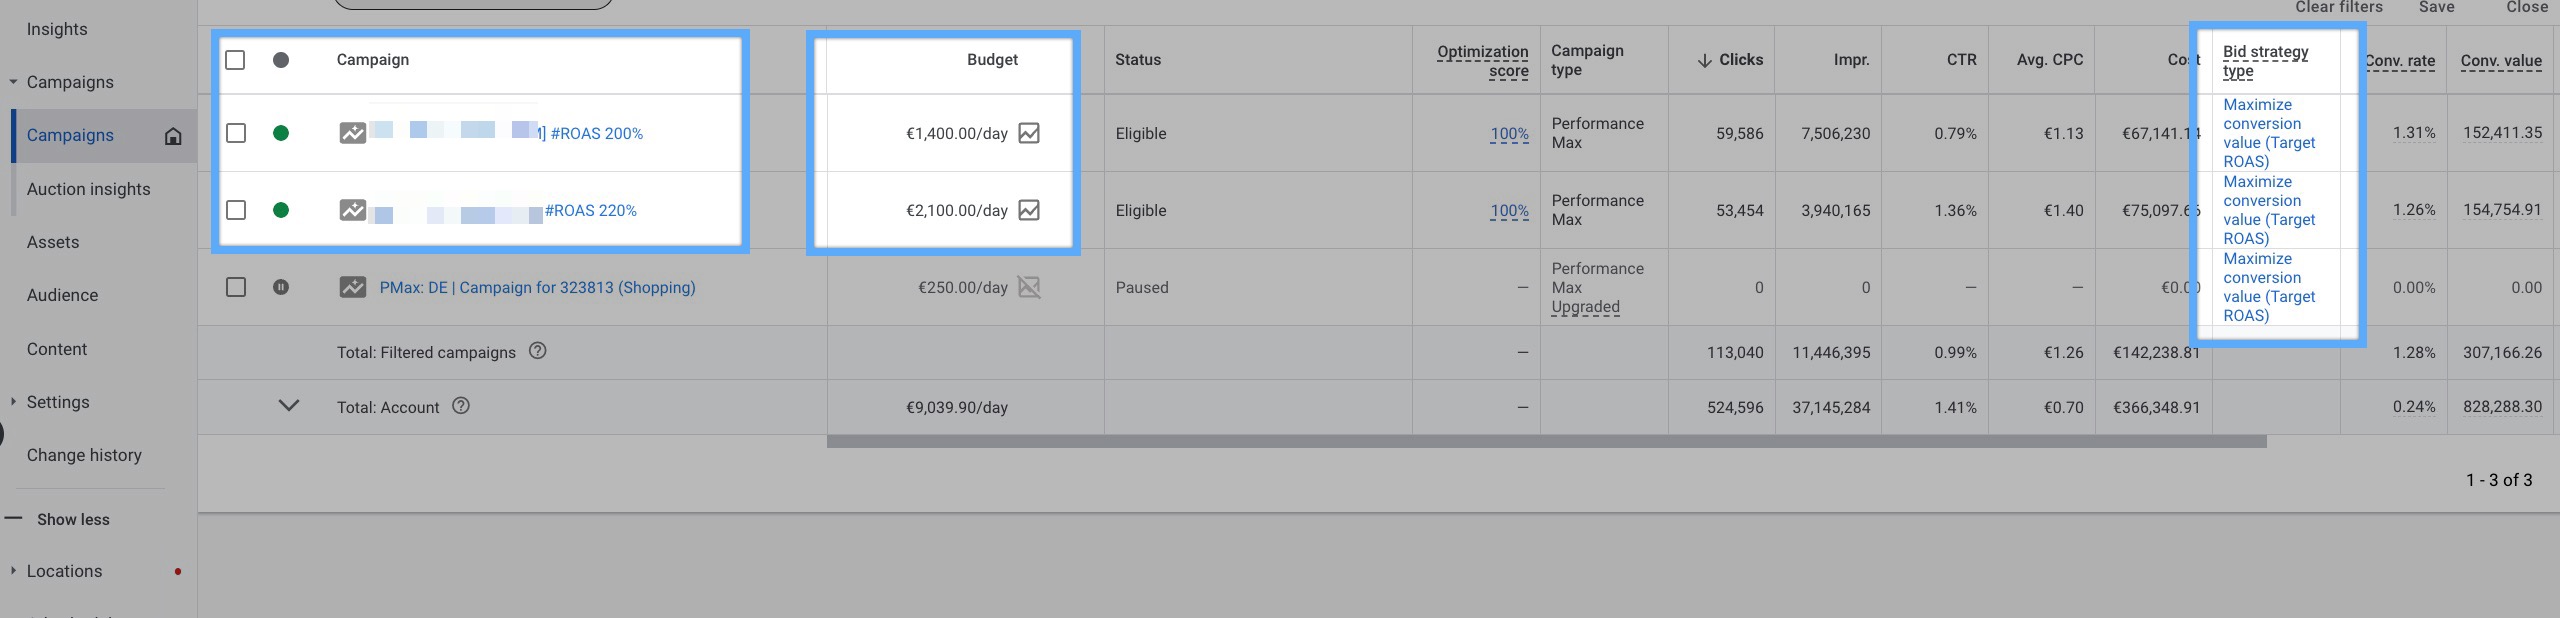
Asset Group vs. Campaign
There are some settings that divide the asset groups and campaigns.
To be more precise, campaigns feature the following settings while the asset groups do not:
- Budget
- Bidding Strategy
- Location
- Language
and many others.
Therefore, creating a campaign vs. asset groups gives you a huge advantage of controlling your budget and bidding strategy.
Let’s make it clear working on examples:
Here, there are two campaigns using different daily budget and bidding strategies (ROAS 200% vs ROAS 220%):
Here’s another one:
Let’s say Plus Size (Asset Group) in Wedding Dresses (Campaign) performs much better than all the others.
In this case, it would be a pity that they share the same budget.
You’d be better off creating a new campaign only for “Plus Size” and set separate budget and targets for that.
Grab that magnifying glass for another one below:
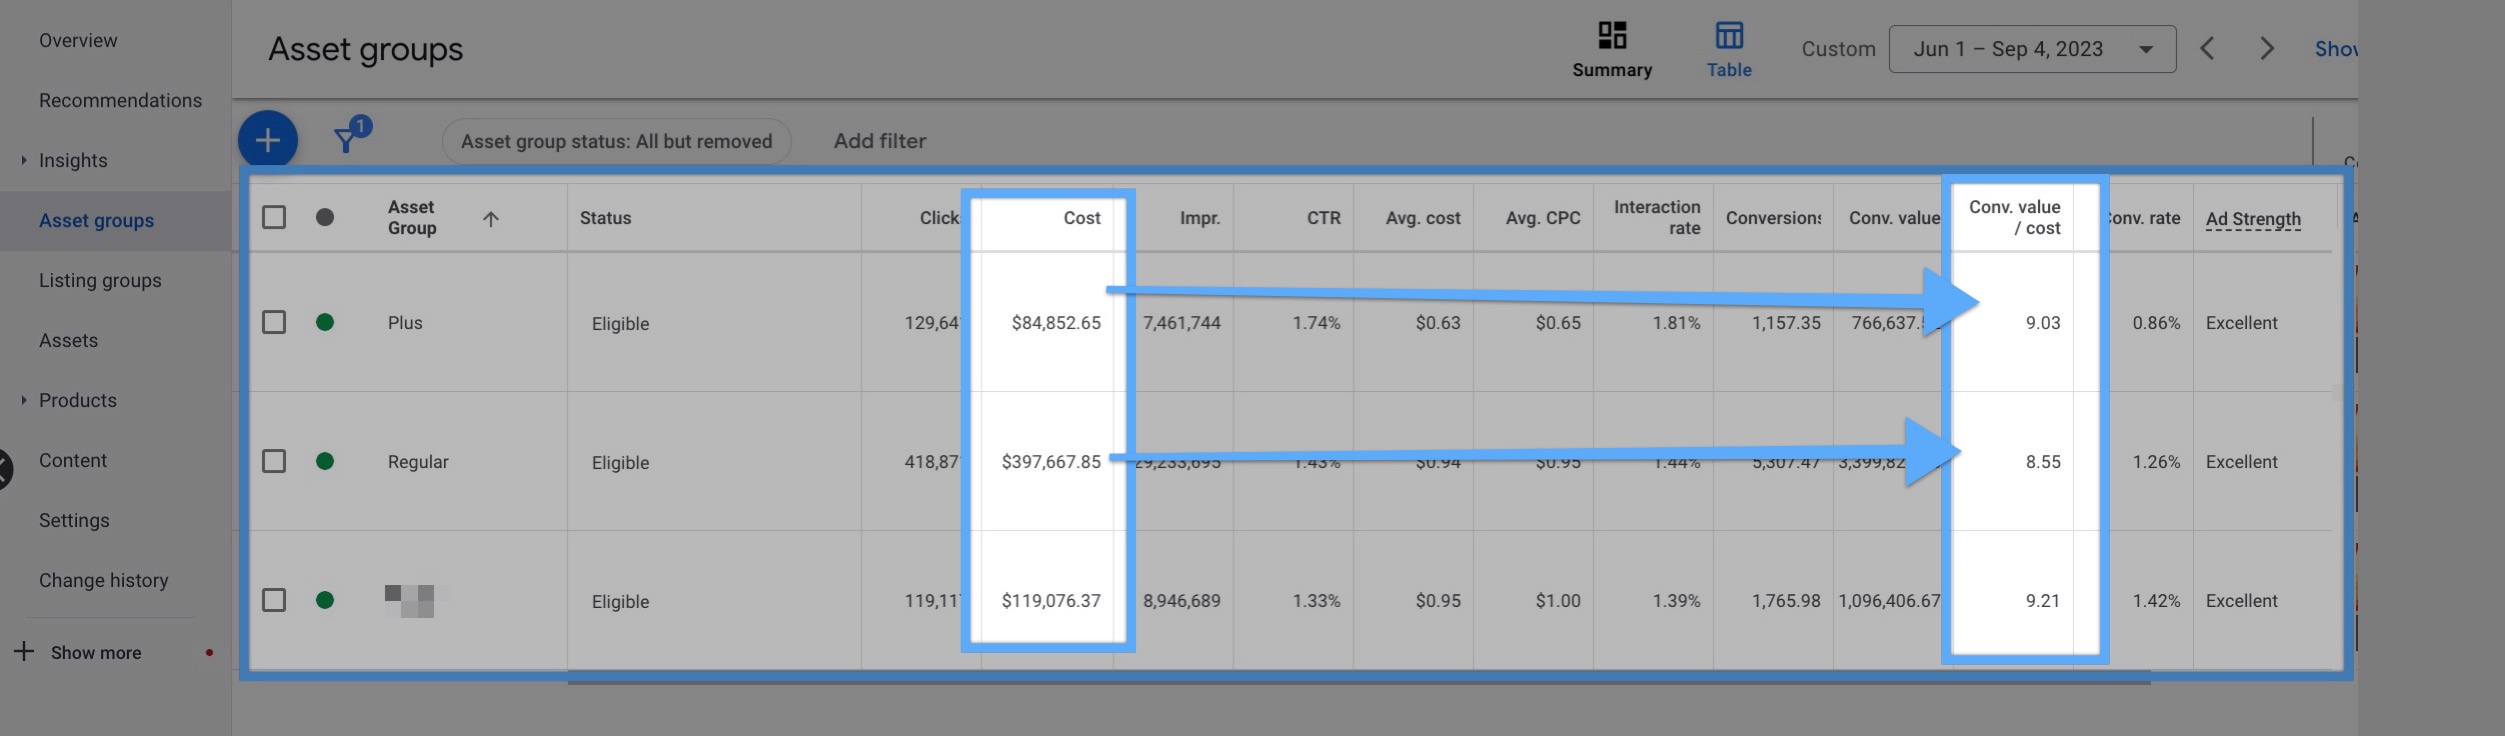
The first asset group has a better ROI although only the 25% of the 2nd asset group was spent for that.
This seems like a good opportunity to try out a new campaign.
It’s a fact we’ll never know if that’ll work out better, but we should use more data and business knowledge to support our hypothesis.
Kind Reminder: Please note that these are just examples. Different strategies can work in different accounts.
Key: Trust in Google Ads Data
In all the aforementioned scenarios, we rely on the data provided by Google Ads.
And Google Ads relies on the data that’s received from your store.
For ROAS & Conversion data:
Your conversion should be working perfectly to count all the conversions properly so all the available data is shared with Google Ads.
For Audience Signals & Remarketing:
You should have a seamless a Google Tag & Dynamic Remarketing setup to make sure the user behaviour signals are correctly passed onto Google Ads.
You should note that an eye-popping 85% of the Google Ads account we’ve audited has at least one major problem.
Here’s an insightful tutorial for you to carry out an in-depth Google Ads data audit:

Data-First Google Ads Optimization Course by Analyzify
If you’d like to get a much more detailed audit & a solid data tracking setup, you can consider trying Analyzify and:
- Let our experts run a manual audit on your data tracking setup including Google Ads
- Integrate a bullet-proof Google Tag setup for both Google Ads Enhanced Conversions and dynamic remarketing setup
- Our system detects once a problem appears on your tracking in the future.
Shopify & Google Ads integration
You can contact us to resolve data-related issues and improve your ROI with a solid Shopify & Google Ads integration.
- Google Ads Conversion Tracking
- Google Ads Dynamic Remarketing Setup
- Google Ads Enhanced Conversions
- Expert Level Audit & Data Validation