In ecommerce, understanding the checkout journey of your customers is crucial for optimizing conversions and enhancing user experience.
Google Analytics 4 (GA4) offers powerful tools to track and analyze this journey, providing insights that are essential for any Shopify merchant.
Here, we are exploring the Checkout Journey Report in GA4 to cover:
- How to view the GA4 Checkout Journey Report
- Interpreting the Checkout Journey Report in GA4
- Customizing the report according to your needs
along with many other insights into why you should use the Checkout Journey Report in GA4 regularly.

Where to Find the Checkout Journey Report in GA4?
To find the Checkout Journey Report in GA4, follow these steps:
Important: If the Checkout Journey Report is not visible, you might need to customize your navigation settings to include this report.
Understanding the Checkout Journey Report
Understanding the Checkout Journey Report in GA4 involves interpreting both the visual funnel chart and the accompanying data table.
Here’s a detailed breakdown:
Funnel Chart
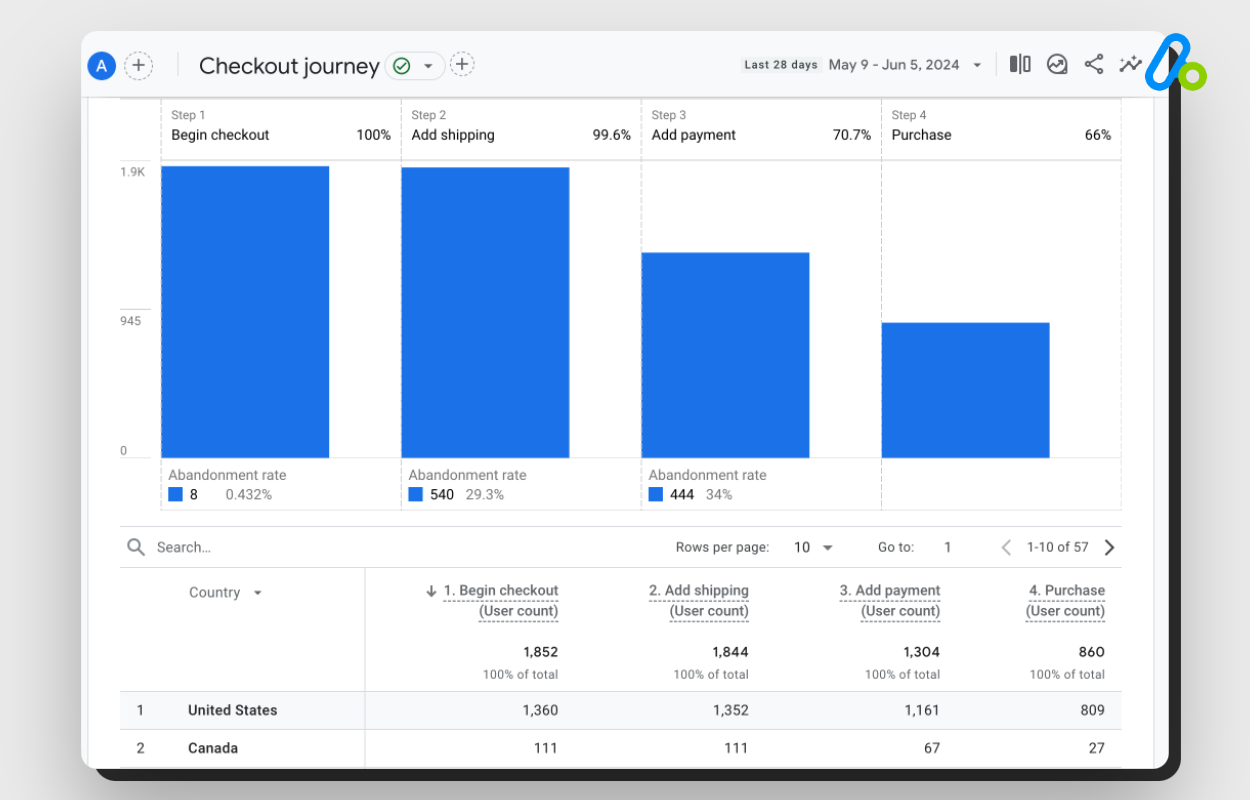
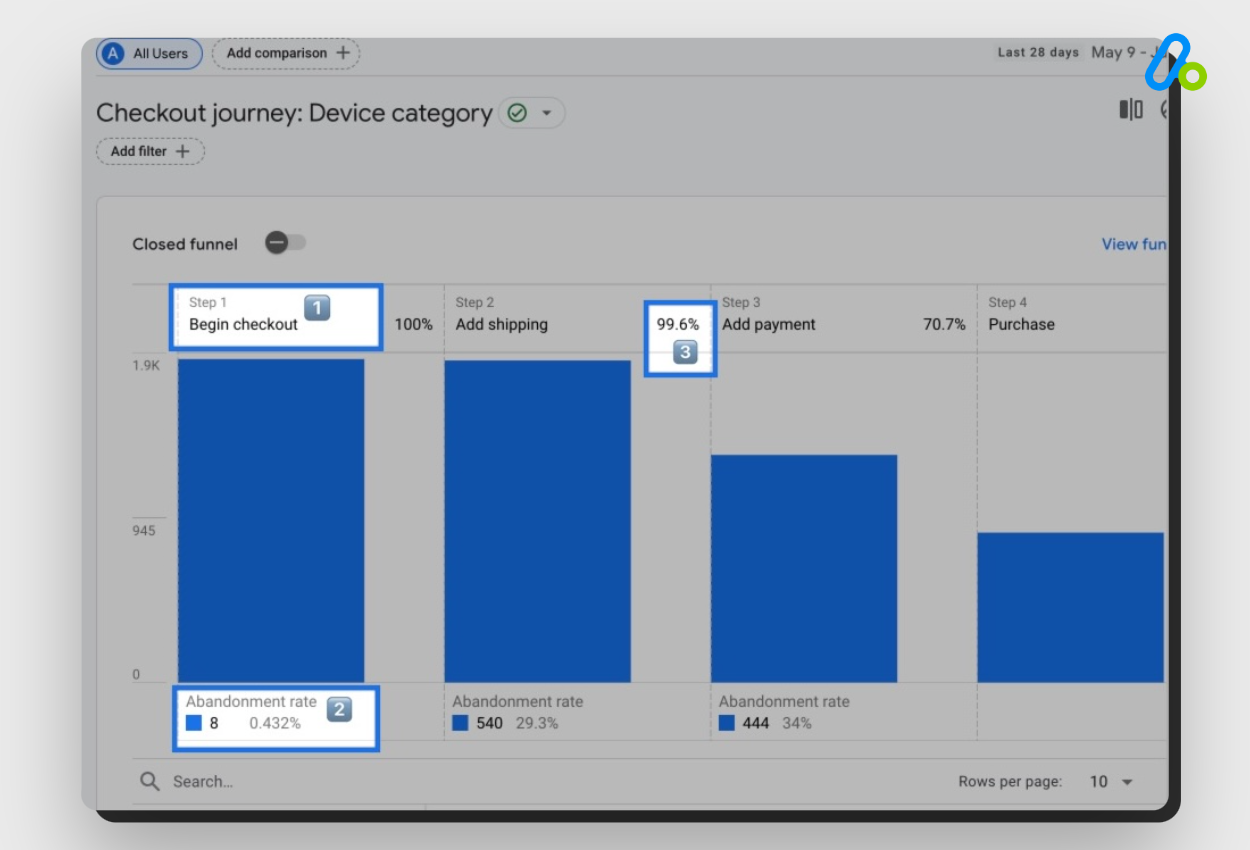
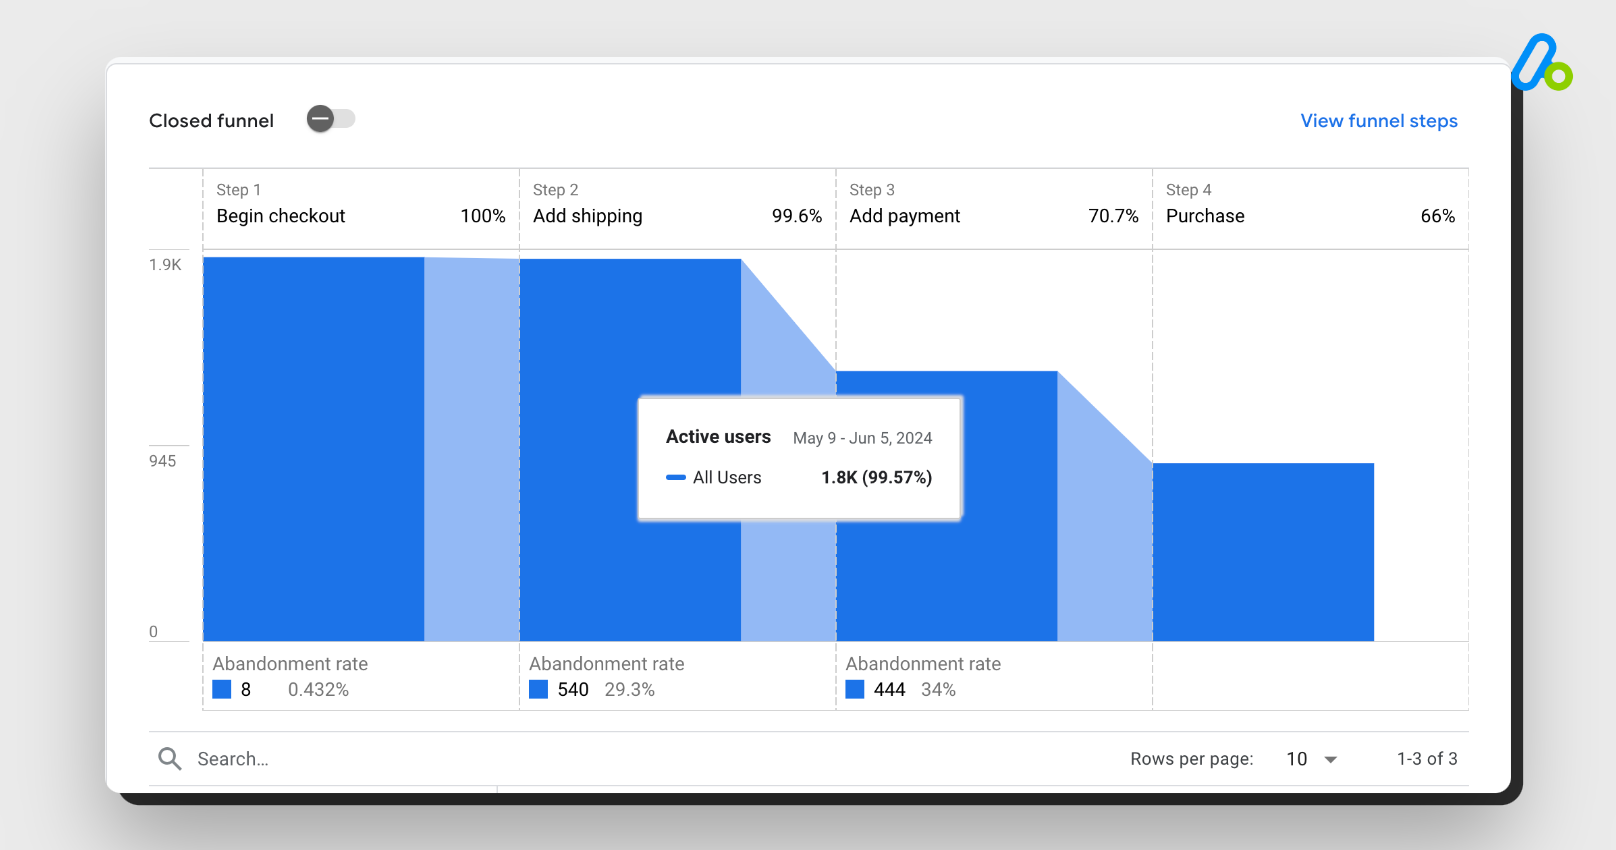
The funnel chart in the GA4 Checkout Journey Report is an essential tool for visualizing how users move through each stage of the checkout process.
This chart helps you see the flow and spot where users might be dropping out.
Stages in the Funnel: The funnel typically includes steps like starting with begin_checkout, then add_shipping_info, add_payment_info, and ending with purchase.
Abandonment Rate: This metric, shown below each stage except the last one, tells you what percentage of users didn’t make it to the next step. For example, if 400 users start the checkout, but only 150 enter their payment details, the abandonment rate for the payment stage would be 62.5%.
Retention Rate: Opposite of the abandonment rate, this shows the percentage of users who successfully moved to the next step. For instance, if 180 users add their shipping information after beginning the checkout, the retention rate at this stage is displayed.

- Interactive Insights: Hovering over any part of the funnel chart provides specific numbers of users who completed each step.

By examining the funnel chart, you can identify critical points where users are leaving the process and take steps to improve those areas, ultimately enhancing the overall user experience and increasing conversion rates.
Data Table
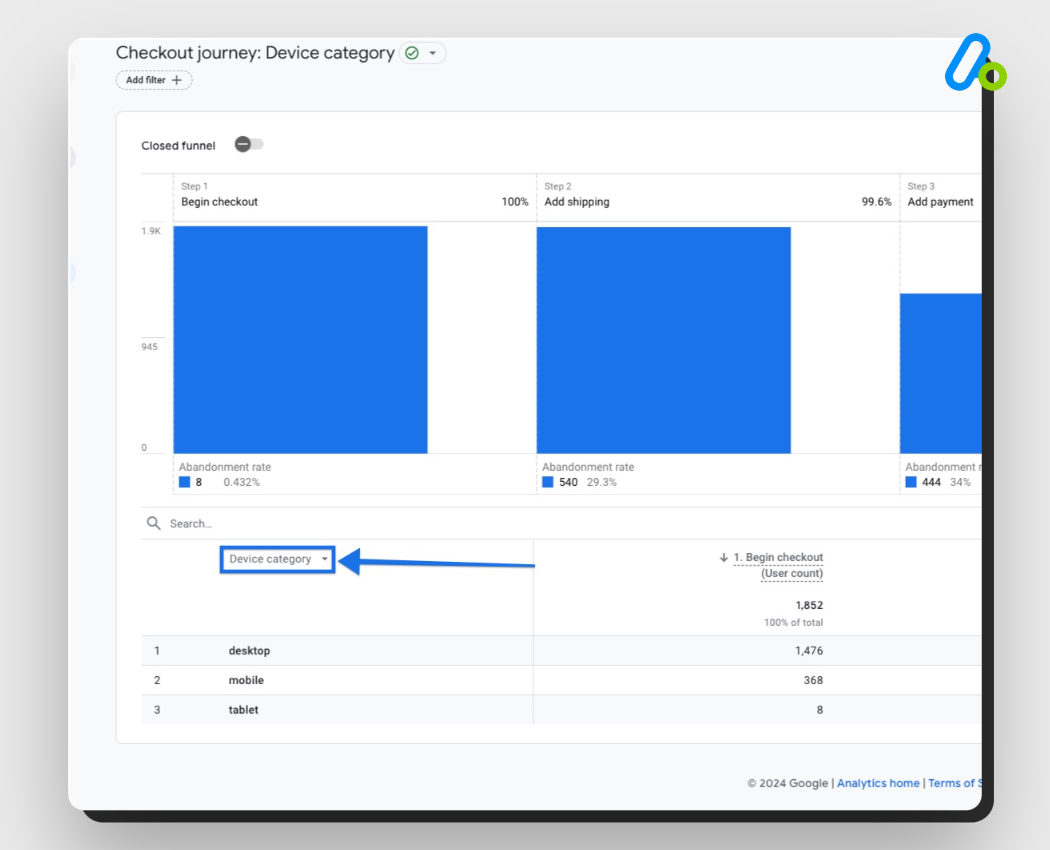
The data table complements the funnel chart by allowing you to segment the data using different dimensions. This segmentation provides deeper insights into user behavior and helps identify specific patterns or issues.
Default Dimensions: By default, the report segments data by “Device Category.” However, you can change the dimension by selecting from options such as Browser, City, Country, Device Category, Language, and Region.

Segmenting Data: By clicking “Add filter” and adding dimensions, you can observe how different user groups interact with the checkout process. This can highlight trends or issues specific to certain user segments.
Interpreting the Data
To effectively use the Checkout Journey Report:
Identify Drop-off Points: Look for steps with high abandonment rates to identify where users are dropping off. These are critical areas that might require attention and improvement.
Compare Periods: Monitor changes in abandonment and retention rates over different periods to assess the impact of any changes you make to the checkout process.
Analyze User Segments: Compare the performance across different dimensions (e.g., device type, browser, region) to understand how various factors influence user behavior.
Track Improvements: Use the report to track the results of any optimizations you implement in the checkout process. This helps in validating the effectiveness of your changes.
By following these interpretations, you can use the Checkout Journey Report in GA4 to enhance your ecommerce site’s checkout process, thereby improving user retention and conversion rates.
How to Customize GA4 Checkout Journey Report?
Let’s say you are running a pet store built on Shopify and want to understand how many organic visitors abandon your checkout funnel at certain points.
Then, you will also compare mobile users vs. total users from a specific country.
You can customize your GA4 Checkout Journey Report to see these details.
To customize the GA4 Checkout Journey Report within the standard reporting interface, follow these steps:
You can click on “View funnel steps” to see the detailed steps that make up the funnel.
If you want to add more steps to your funnel, you can create a funnel report in the Exploration section: Learn how to create ecommerce funnels in GA4.
By customizing the dimensions, adding comparisons, and applying filters, you can tailor the GA4 Checkout Journey Report to gain deeper insights into your checkout process and identify specific areas for improvement.
Why Should You Use GA4 Checkout Journey Report?
Using the GA4 Checkout Journey Report provides several practical benefits for improving your ecommerce checkout process. Here’s why you should consider using it:
Spotting Checkout Issues
The report helps you find where users drop off during the checkout process. If many users leave before completing the payment step, you can focus on improving that part to make it smoother and more user-friendly.
Enhancing User Experience
By understanding the trouble spots, you can make targeted improvements that make the checkout process easier and faster for users. A better user experience often leads to higher conversion rates.
Tracking Performance Over Time
You can monitor how changes affect your checkout process by comparing data over different periods. This helps you see if your tweaks are making things better or if further adjustments are needed.
Detailed User Insights
The report lets you break down data by device type, browser, country, and more. This way, you can understand how different groups of users behave and tailor your strategies accordingly.
Making Informed Decisions
Instead of guessing, you can use actual data to decide where to focus your efforts. This leads to more effective improvements based on real user behavior.
Reducing Cart Abandonment
By identifying why users abandon their carts, you can address those issues directly. This can significantly reduce abandonment rates and increase completed purchases.
FAQ: Checkout Journey Report in GA4
Here are the most common questions about GA4 Checkout Journey Report:
How can I identify abandoned carts or users in the Checkout Journey Report?
To see abandoned carts or users, open the Checkout Journey Report in GA4. The report shows the abandonment rate below each step in the funnel, except the last one. This rate indicates the percentage of users who did not move on to the next step. By analyzing these rates, you can pinpoint where users are dropping off in the checkout process.
What information is available in the Checkout Journey Report?
Answer: The Checkout Journey Report displays a funnel chart and a data table. The funnel chart shows the number of users completing each checkout step, such as adding shipping information, payment details, and making a purchase. The data table allows segmentation by various dimensions like device type, browser, country, and more, providing detailed insights into user behavior at each step.
What are the key differences between Universal Analytics and Google Analytics 4 Checkout Reports?
In Universal Analytics, the checkout funnel was typically tracked using goals and events, and the reports were more static. GA4 offers a more dynamic Checkout Journey Report with detailed funnel visualization, customizable steps, and advanced segmentation options. GA4 also provides enhanced insights with metrics like abandonment and retention rates at each step of the funnel.
How can I customize the GA4 Checkout Journey Report?
You can customize your report by adding dimensions and comparisons. Please refer to the related section above.
How can I use the Checkout Journey Report to track performance changes over time?
You can track performance over time by comparing the abandonment and retention rates across different periods. By monitoring these metrics, you can assess the impact of any changes made to the checkout process and identify trends or patterns in user behavior.
What dimensions are available for segmenting data in the Checkout Journey Report?
The Checkout Journey Report allows segmentation by various dimensions, including Device Category, Browser, City, Country, Language, and Region. This segmentation helps you analyze how different user groups interact with the checkout process and identify specific issues or trends.
How do I interpret the retention and abandonment rates in the Checkout Journey Report?
The abandonment rate shows the percentage of users who did not proceed to the next step in the funnel, while the retention rate indicates the percentage of users who moved from the current step to the next. By analyzing these rates, you can identify steps with high drop-off rates and take action to improve those stages of the checkout process.
How can the Checkout Journey Report be used for A/B testing?
The Checkout Journey Report can be used to track the impact of A/B tests on the checkout process. By comparing abandonment and retention rates before and after implementing changes, you can determine which variations lead to better performance and optimize the checkout process accordingly.
What are the steps to view the Checkout Journey Report in GA4?
To view the Checkout Journey Report in GA4, sign in to your Analytics account, select your GA4 property, and go to “Reports” in the left-hand menu. Under the “Monetization” section, click on “Checkout Journey” to access the report. If the report is not visible, you may need to customize your navigation settings to include it.
Final Words: Checkout Journey Report in GA4
Using the Checkout Journey report in GA4 is pivotal for any ecommerce business aiming to streamline their checkout process and boost conversion rates.
Regularly reviewing your checkout process based on the data here will help you get actionable insights & strategies to drive your growth.
By utilizing the insights here, you can identify bottlenecks, understand user behavior, and implement changes that significantly enhance the customer experience.


