![Ultimate Guide to GA4 Ecommerce Funnels + Reports [2025]](https://media.analyzify.com/4/8295/ga4-ecommerce-funnels-reports-featured-WMphJeOW.png)
Unlike the previous versions of Google Analytics, GA4 lets you view funnels with any combination of events, dimensions, and metrics that you collect on your website.
In addition to custom dimensions, you have two new standard funnels & reports at your fingertips to get valuable insights into customer behaviour thanks to the latest updates.
Funnels allow you to visualize the steps your users take to complete a specific goal, such as buying a product, signing up for a newsletter, or registering for an account. By analyzing the funnels, you can identify where your users are dropping off, what factors are influencing their behaviour, and how you can optimize your website or app to increase conversions and retention.
Here, you will find out:
- How ecommerce funnels work in GA4 (+ an example)
- The new standard funnels that come with the recent GA4 update
- Creating custom funnels through Explore
- Solutions to potential problems related
along with thought-provoking details to help you master your ecommerce funnels so you can better understand your customer journey and improve ecommerce tracking experience with Google Analytics 4.
🎉 Bonus Content: Before we dive in, discover the top Shopify GA4 apps to improve your data tracking & reporting.
GA4 Ecommerce Funnels Explained
An ecommerce funnel is like a road trip where users pass through different cities (stages) towards a destination ( conversion).
Once you manage to thoroughly analyze how your users behave at these certain stages, which you will see in a bit, you can uncover valuable points that can spotlight potential pitfalls, affording you the opportunity to implement timely & effective solutions.
First, let’s try and understand exactly how GA4 ecommerce funnels work. Say we work on a funnel for a Shopify store that sells clothing.
Therefore, the ecommerce funnel for this example consists of four steps such as:
- View product: The user views a product page on the website.
- Add to cart: The user adds the product to their shopping cart.
- Begin checkout: The user initiates the checkout process by clicking on the checkout button.
- Purchase: The user completes the purchase by entering their payment and shipping details.
Accordingly, here’s a sample funnel based on it:
IMPORTANT: The steps in the funnel might change depending on your tracking needs.
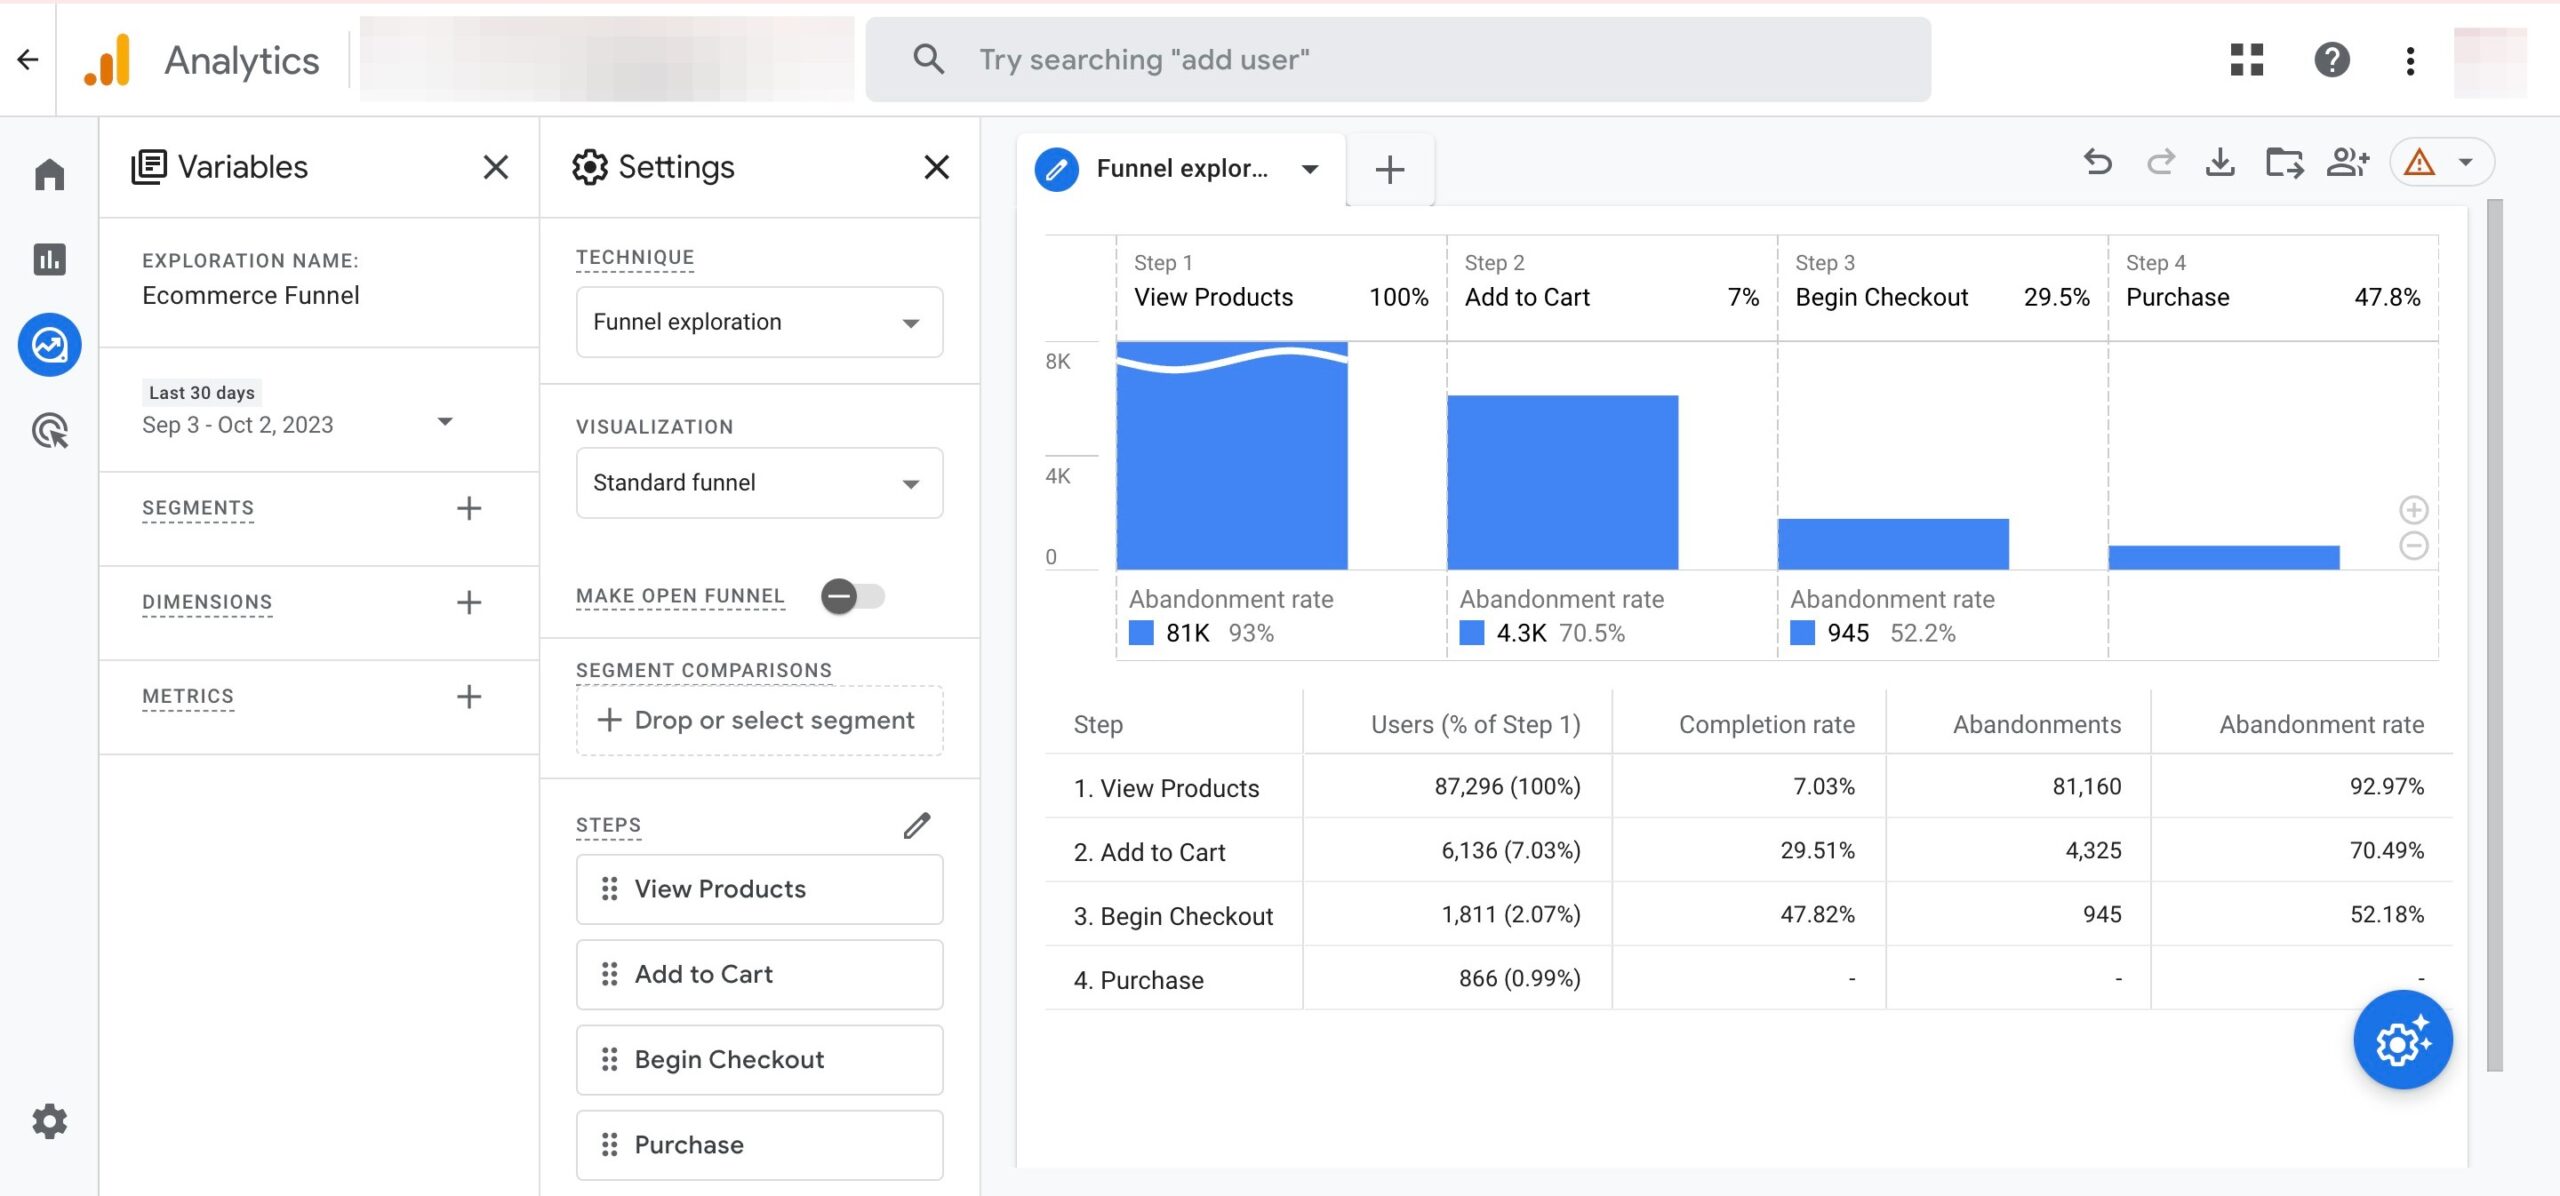
The results provide a perfect visualization of a simple ecommerce funnel, along with some metrics such as:
- Users: The number of users who completed each step of the funnel.
- Completion rate: The percentage of users who completed each step of the funnel out of the total number of users who entered the funnel.
- Abandonments: The number of users who left without moving to the next at each step of the funnel.
- Abandonment rate: The percentage of users who dropped off at each step of the funnel out of the total number of users who entered that step.
How to Analyze an Ecommerce Funnel in GA4?
Now, let’s try to analyze the ecommerce funnel according to the report above:
Out of 87,296 users who viewed products, only 6,136 (7,03%) added them to their cart. This means that a huge number of potential customers left without adding anything to their cart, which could indicate that there is something wrong with the product pages, such as poor images, unclear descriptions, or high prices.
Out of 6,136 users who added products to their cart, only 29,51% of users moved to the checkout process. It might show some problems related to the cart page, such as hidden fees, a lack of payment options, or a complicated checkout process.
Out of 1,811 users who began the checkout process, %47,82 of them completed the checkout to move on with the purchase. 945 users left, and 866 users moved on to arrive at the purchase step. This could indicate that there is something wrong with our checkout page, such as slow loading time, security issues, or technical errors. We can try to improve our checkout page by optimizing the loading speed, displaying trust badges, or fixing any bugs.
By identifying and fixing these issues, you can increase the conversion rate of your sales funnels and generate more revenue for your store.
This is just one example of how funnels can help you understand and enhance your customer journey.
GA4 offers many more features and options to create and analyze funnels for any goal we want to measure. You can also compare different segments, explore trends over time, and save your funnels as reports for easy access.
Now, let’s discover the two new funnel reports added thanks to recent GA4 updates.
GA4 Purchase Journey Report
The purchase journey report helps you quickly observe user activity at each stage of your sales funnel without having to create one through the Explore section.
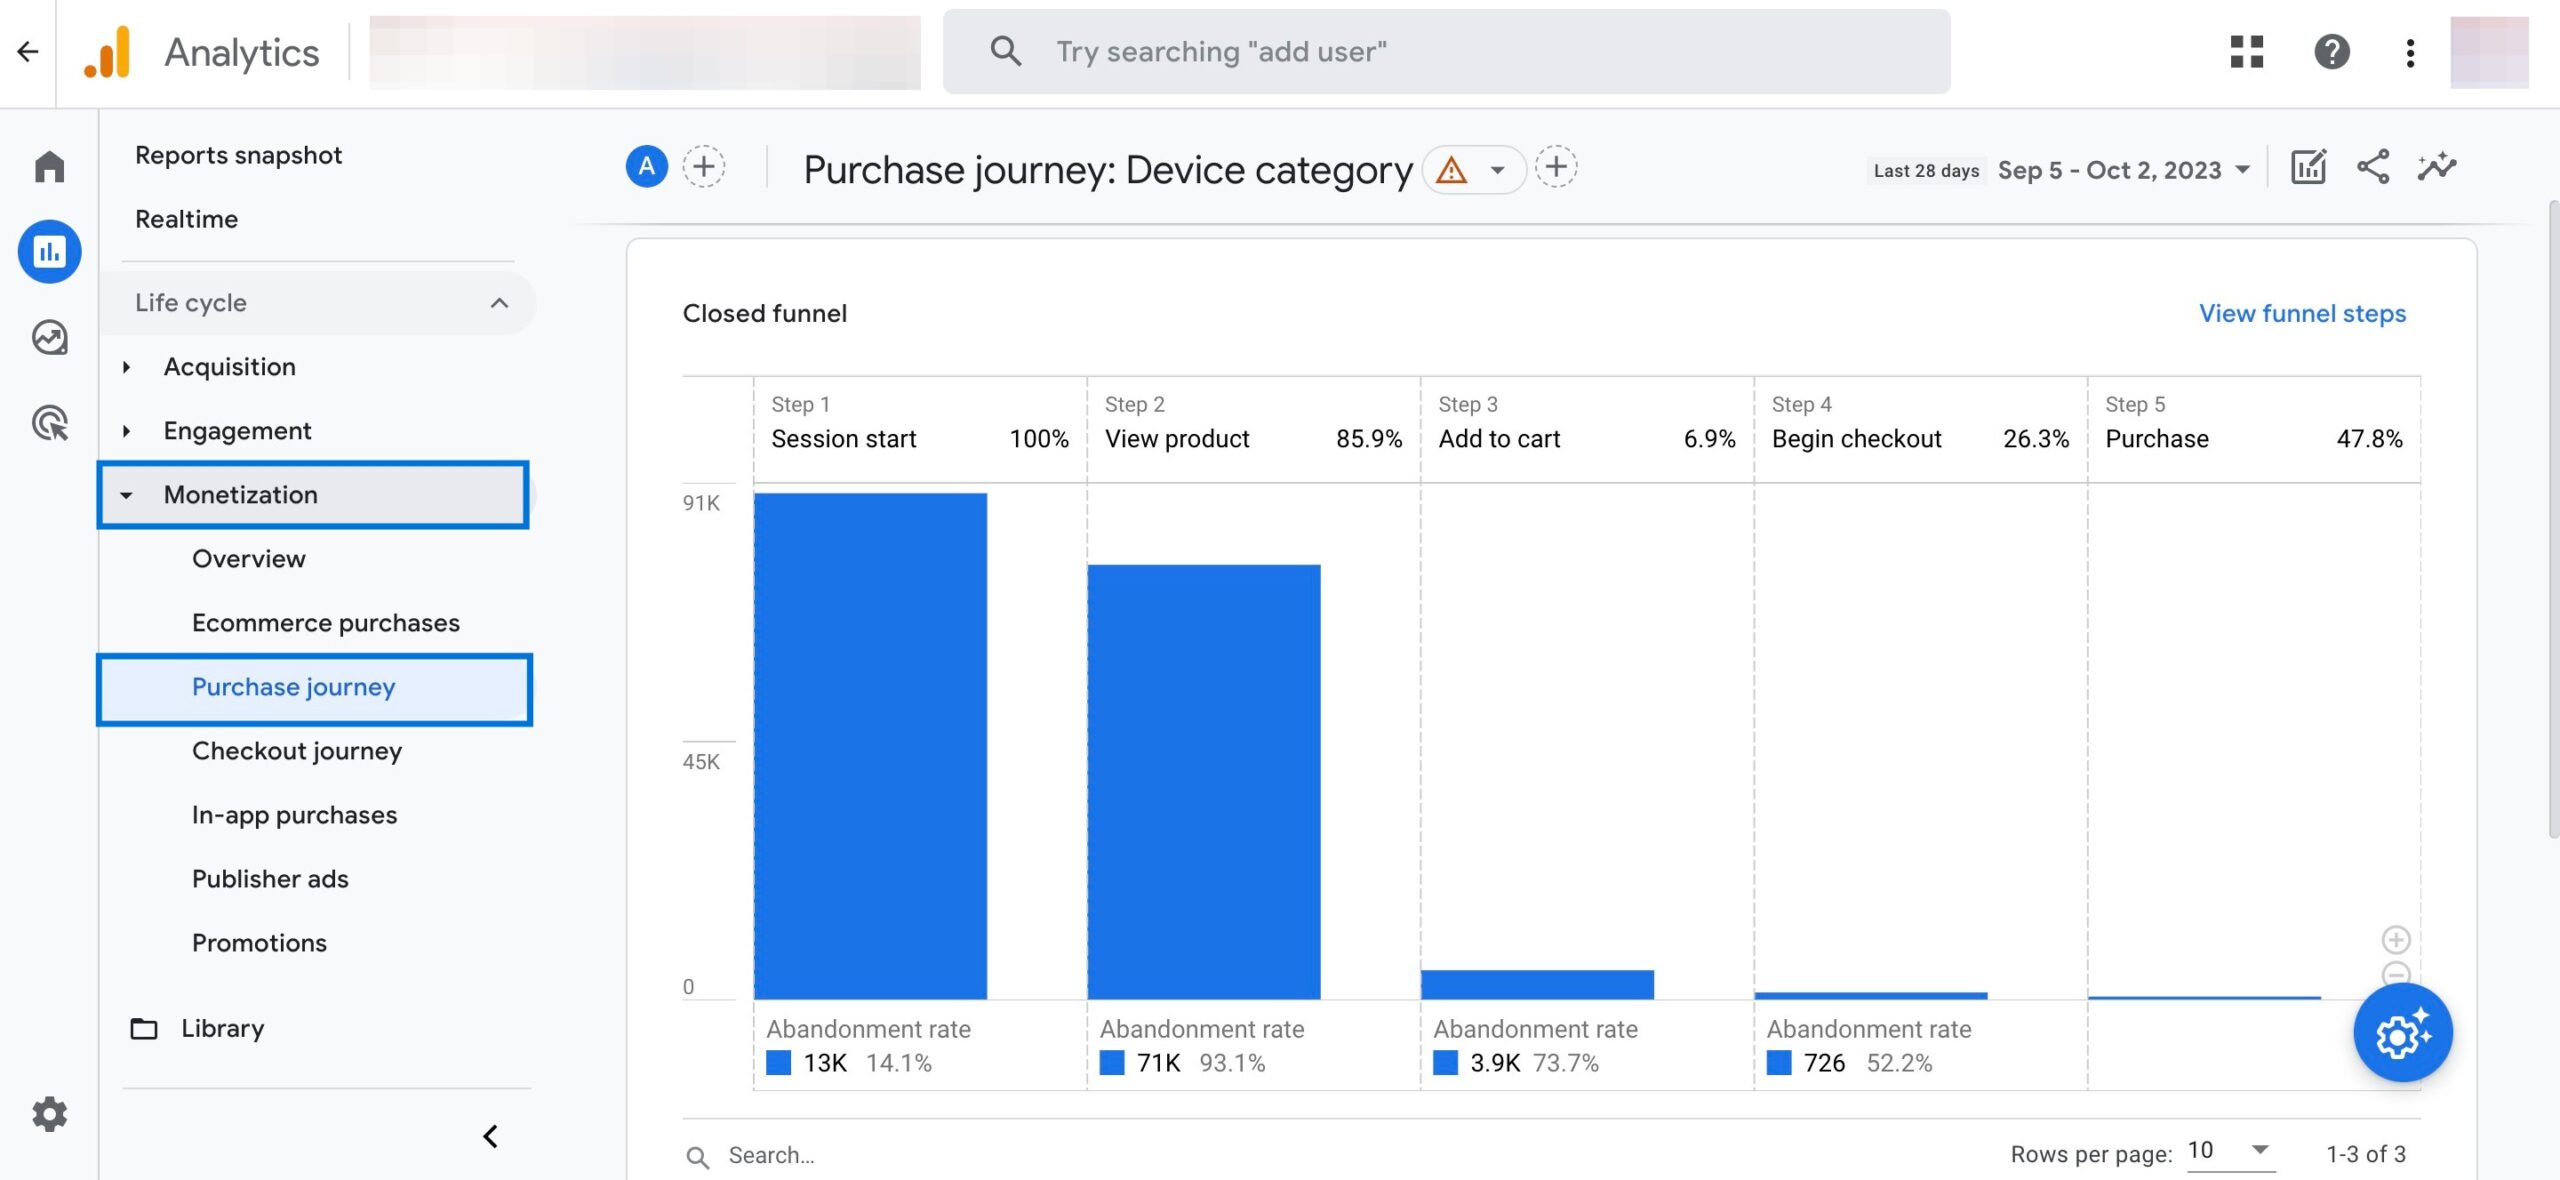
For instance, in your case, you may notice a significant number of users discontinue their purchase after adding items to their cart but before initiating the checkout process. This might help you see that your checkout procedure is overly complex or lacks suitable payment options.
Also, you might find that many users leave your online store after entering their shipping information. This could be a sign that your shipping costs are too high or that you’re not offering free shipping.
To access this report, navigate to Reports > Monetization > Purchase journey\n\n
Checkout Journey Report in Google Analytics 4
The checkout journey report sheds light on how your customers move through the different steps of your checkout process effortlessly.
As a closed funnel report just like the purchase journey, this report only demonstrates the users that started at the first step of your funnel.
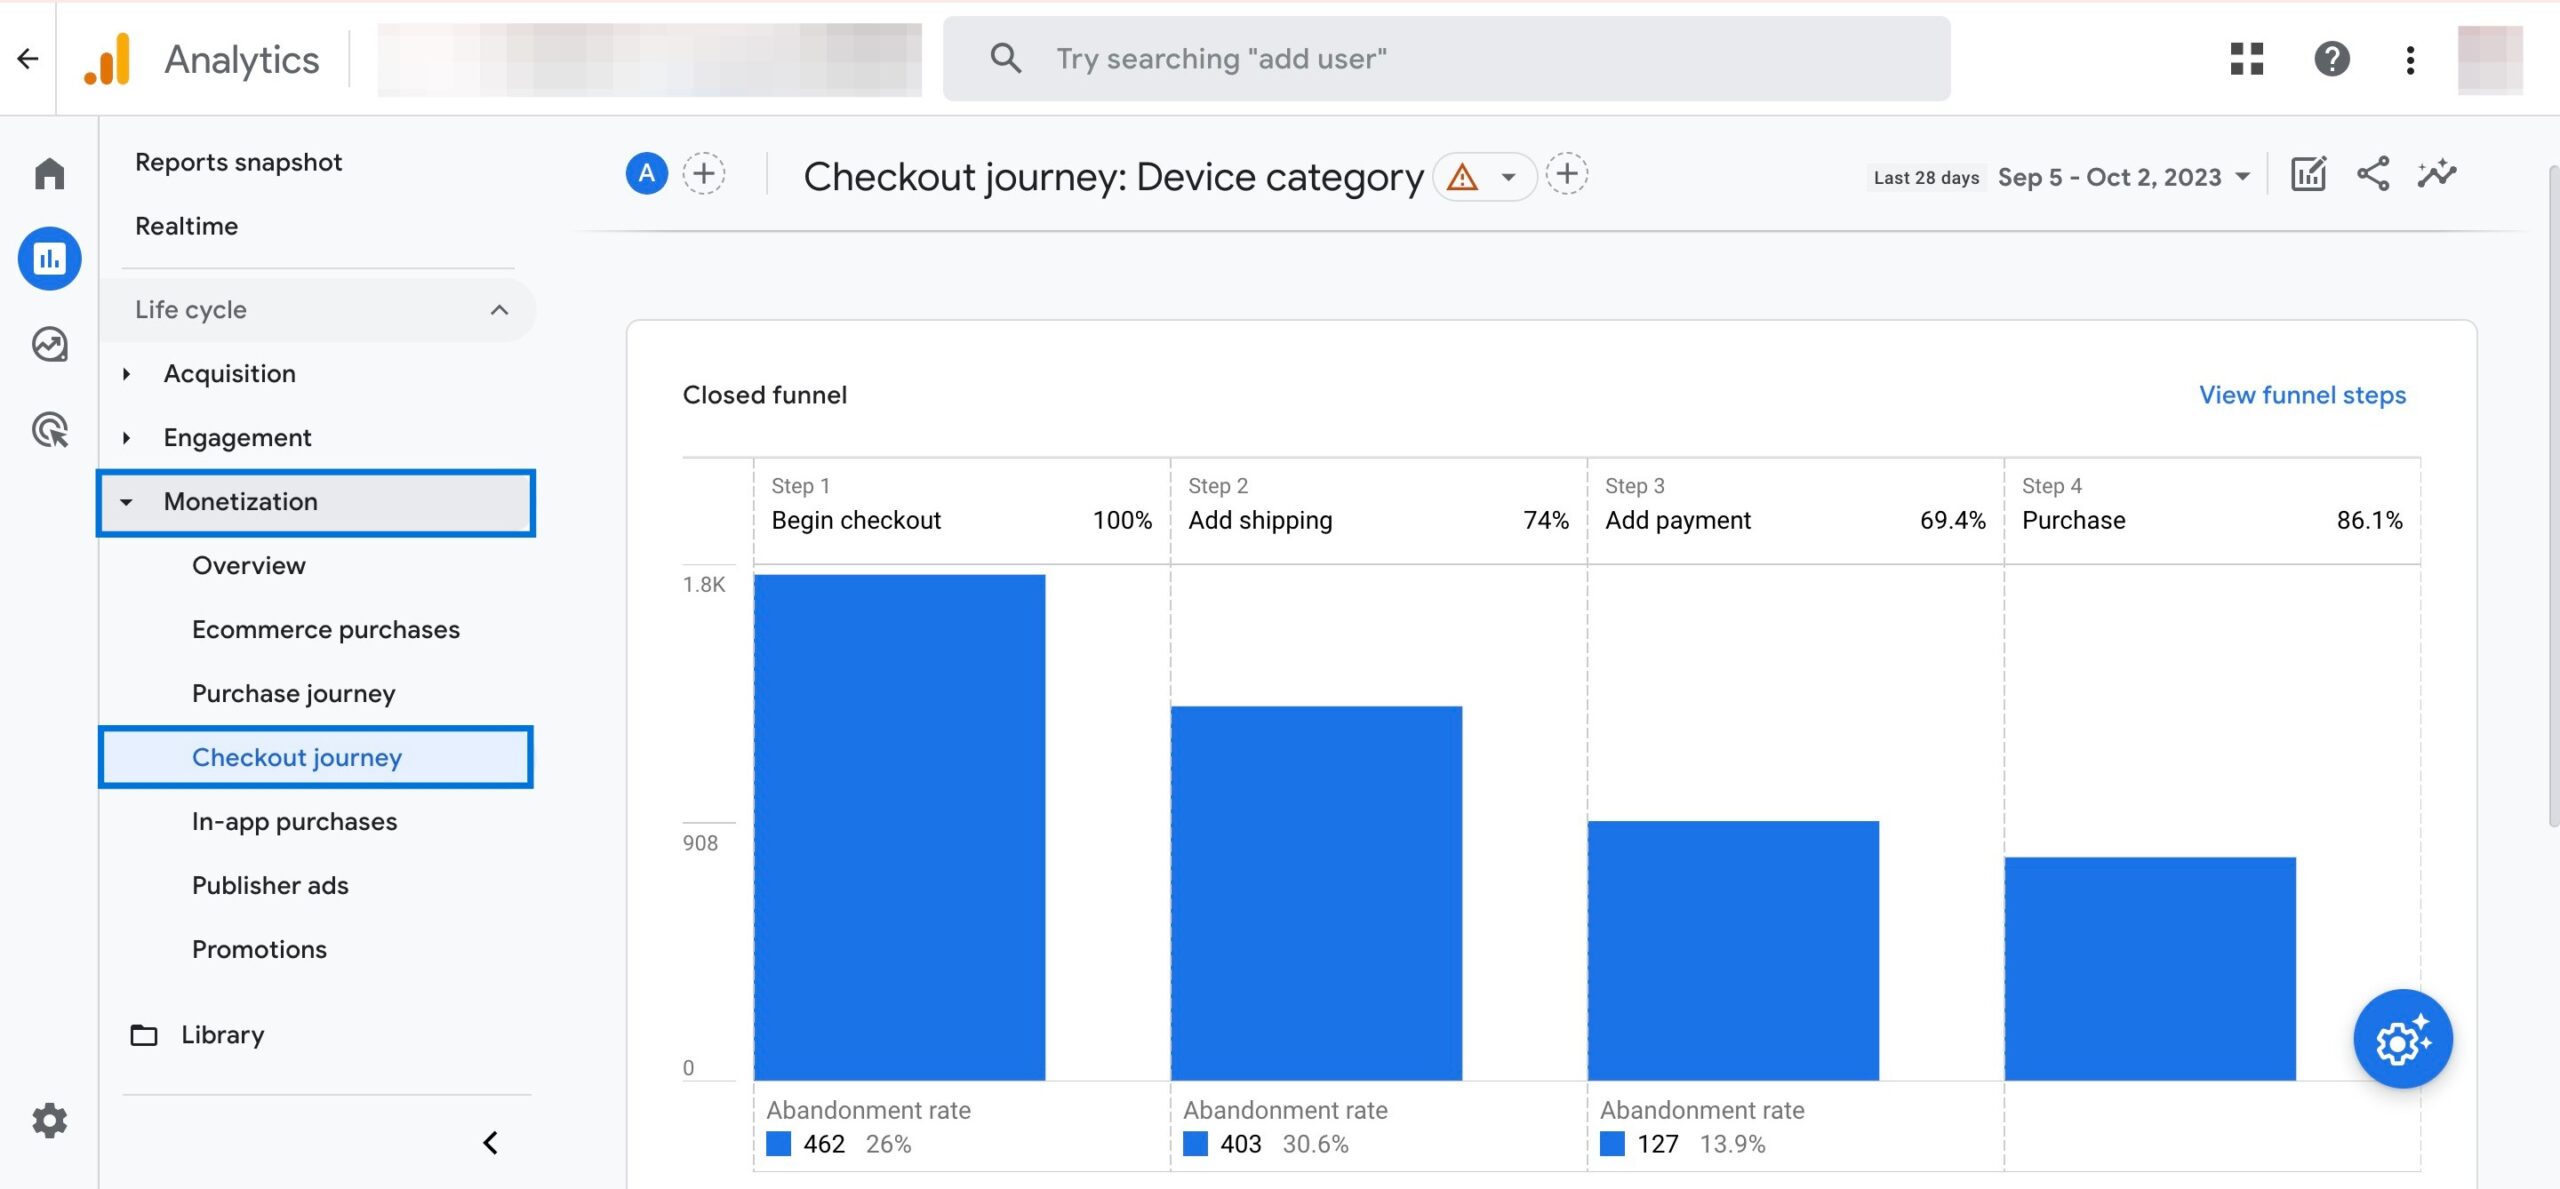
You can use this report to identify where your customers are dropping off and why, and then optimize your checkout experience to increase conversions and sales.
To view this report, navigate to Reports > Monetization > Checkout journey\n\n
What is the Difference between Purchase Journey Report and Checkout Journey Report?
The difference between the purchase journey report and the checkout journey report is that the purchase journey report shows the entire user behaviour from viewing products to purchasing them, while the checkout journey report shows only the steps of the checkout process.
Therefore, it’s possible to say that the checkout journey report is more focused on optimizing the checkout experience, while the purchase journey report is more comprehensive and covers the whole ecommerce funnel.
The bottom line is that both GA4 reports that became available only after the latest updates are useful for a better understanding of your ecommerce funnels to improve your ecommerce performance.
Custom Funnels in Google Analytics 4 (GA4)
In addition to the aforementioned standard funnel reports, you can create custom funnels and add a variety of metrics and dimensions for further analysis in Google Analytics 4.
To create a custom funnel in GA4, you need to use the Explore feature, which is a tool that allows you to create and customize your own reports using various templates, charts, and filters.
Follow the steps for a custom ecommerce funnel:
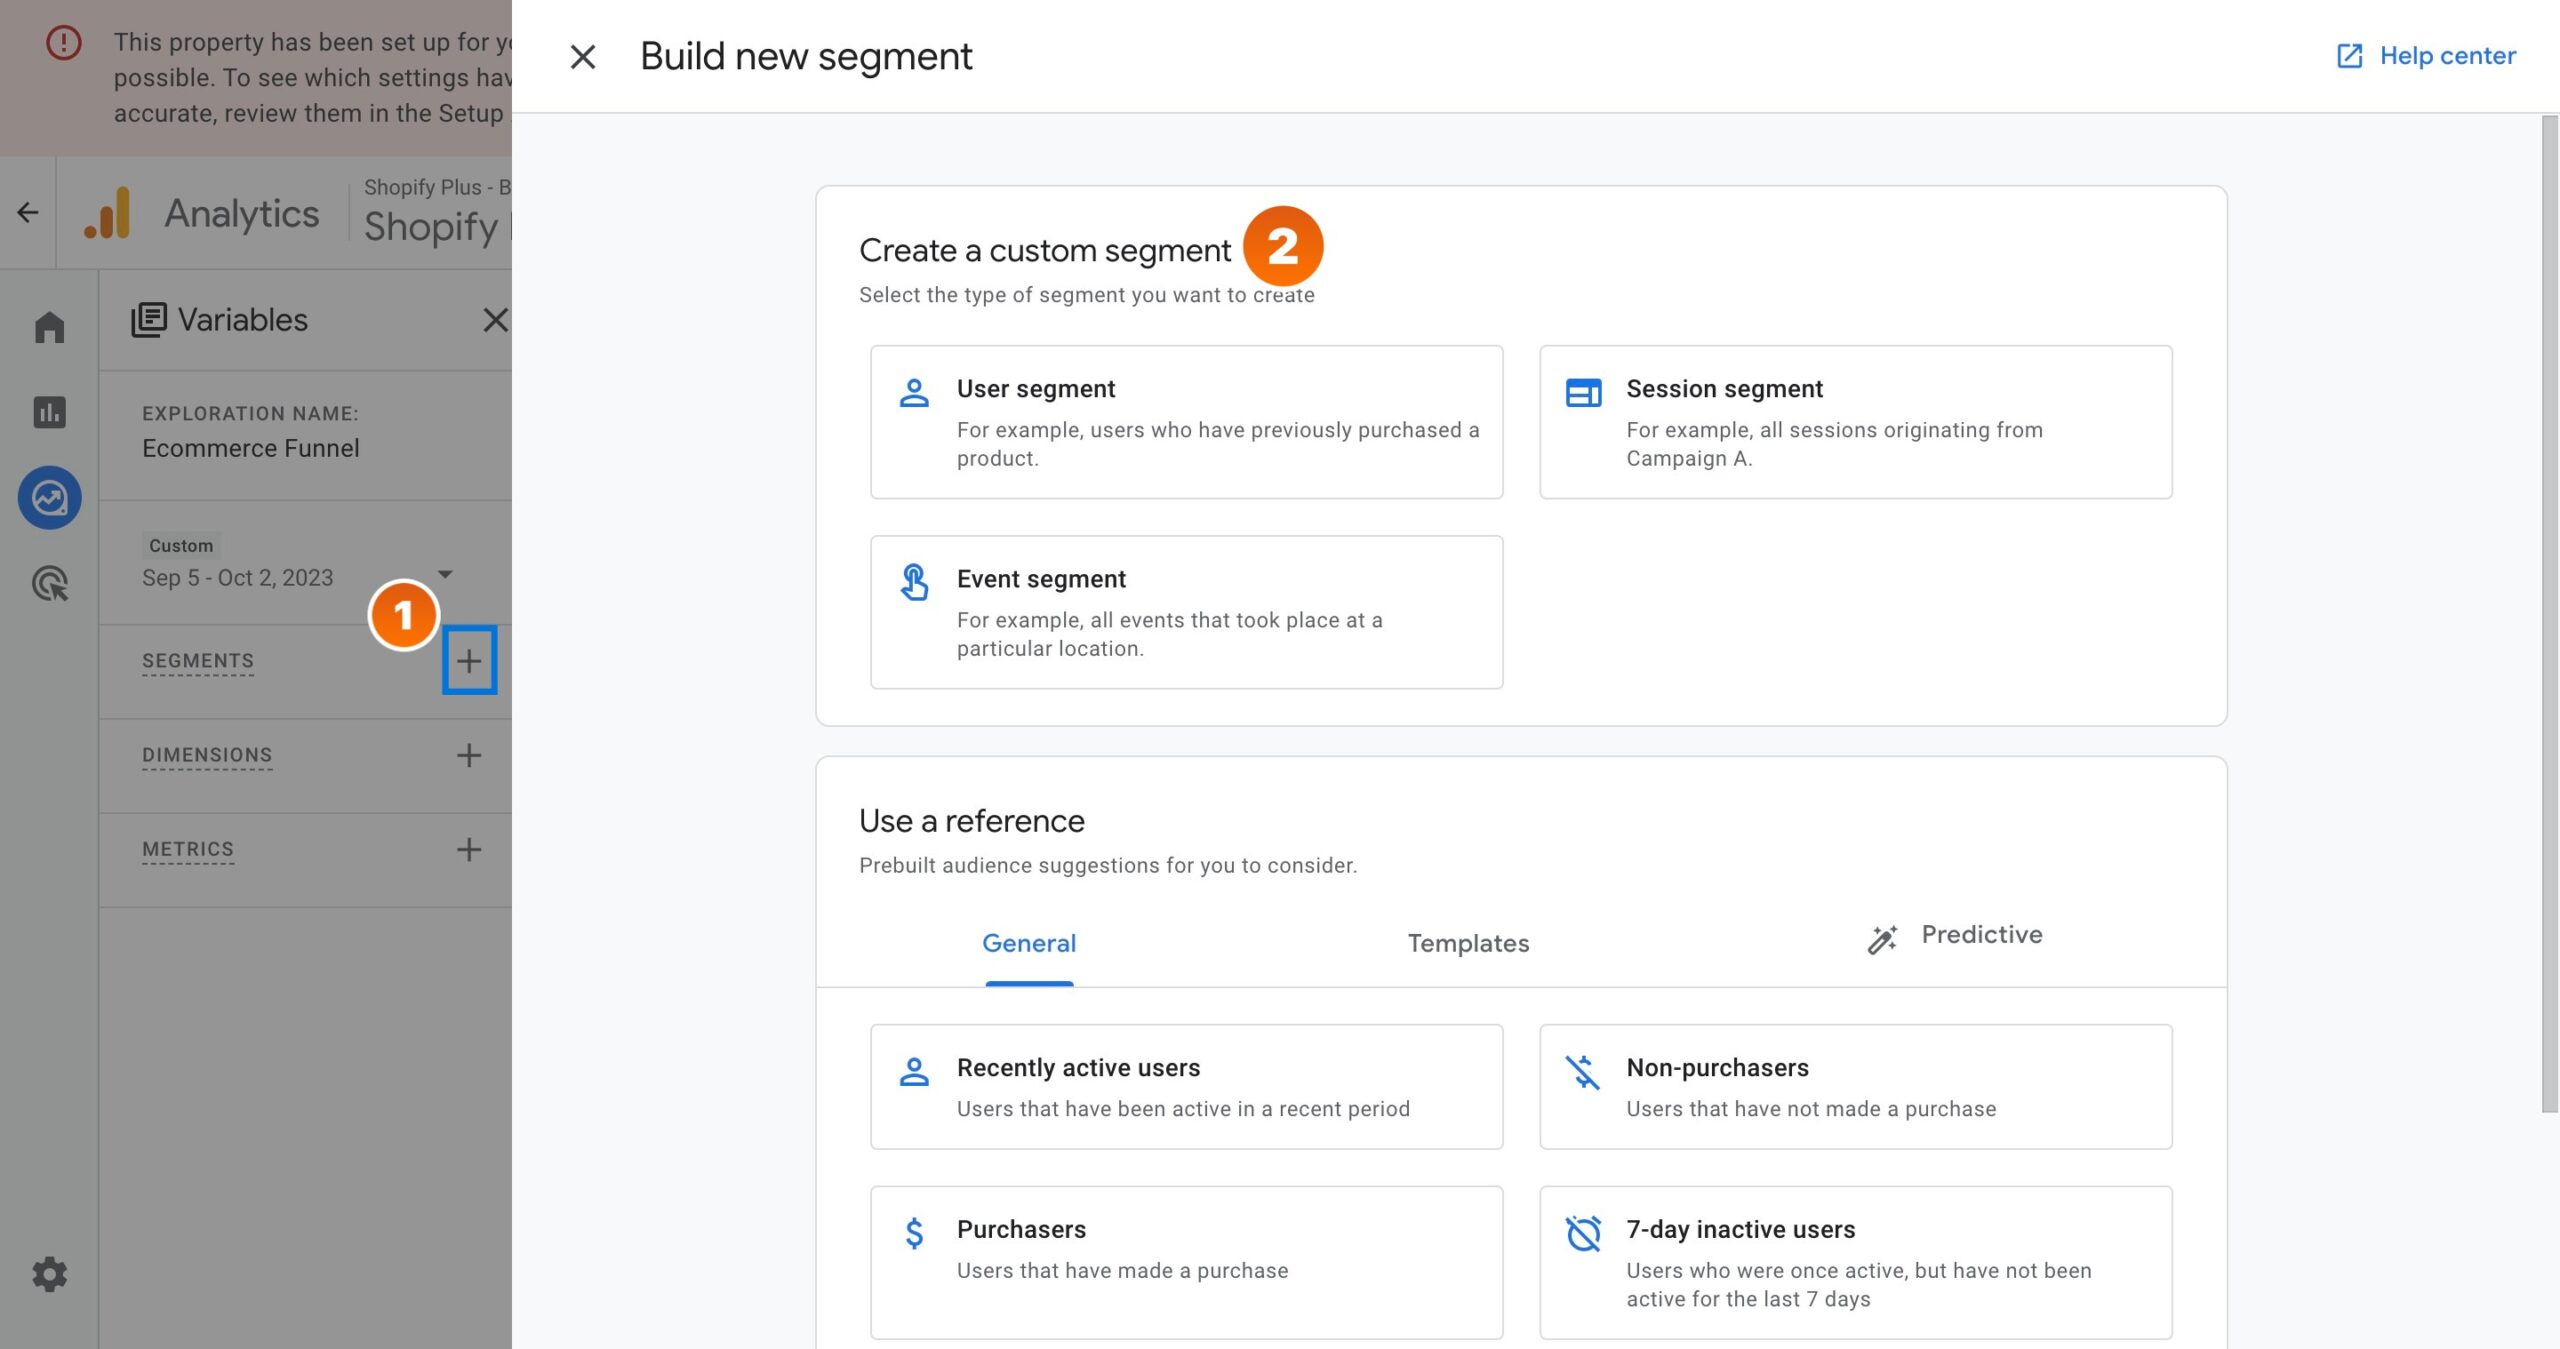
After creating your ecommerce funnel, you can benefit from a large number of customization options for optimum analysis.
For example, you can create & add segments by clicking the plus icon next to ‘SEGMENTS’ in order to narrow down your funnel for your specific group of users.
You can also add breakdown dimensions for more details. For instance, you can go ahead and click the plus icon next to ‘DIMENSIONS’. After that, find & add ‘Device category’ and then double-click that dimension to add it to your report.
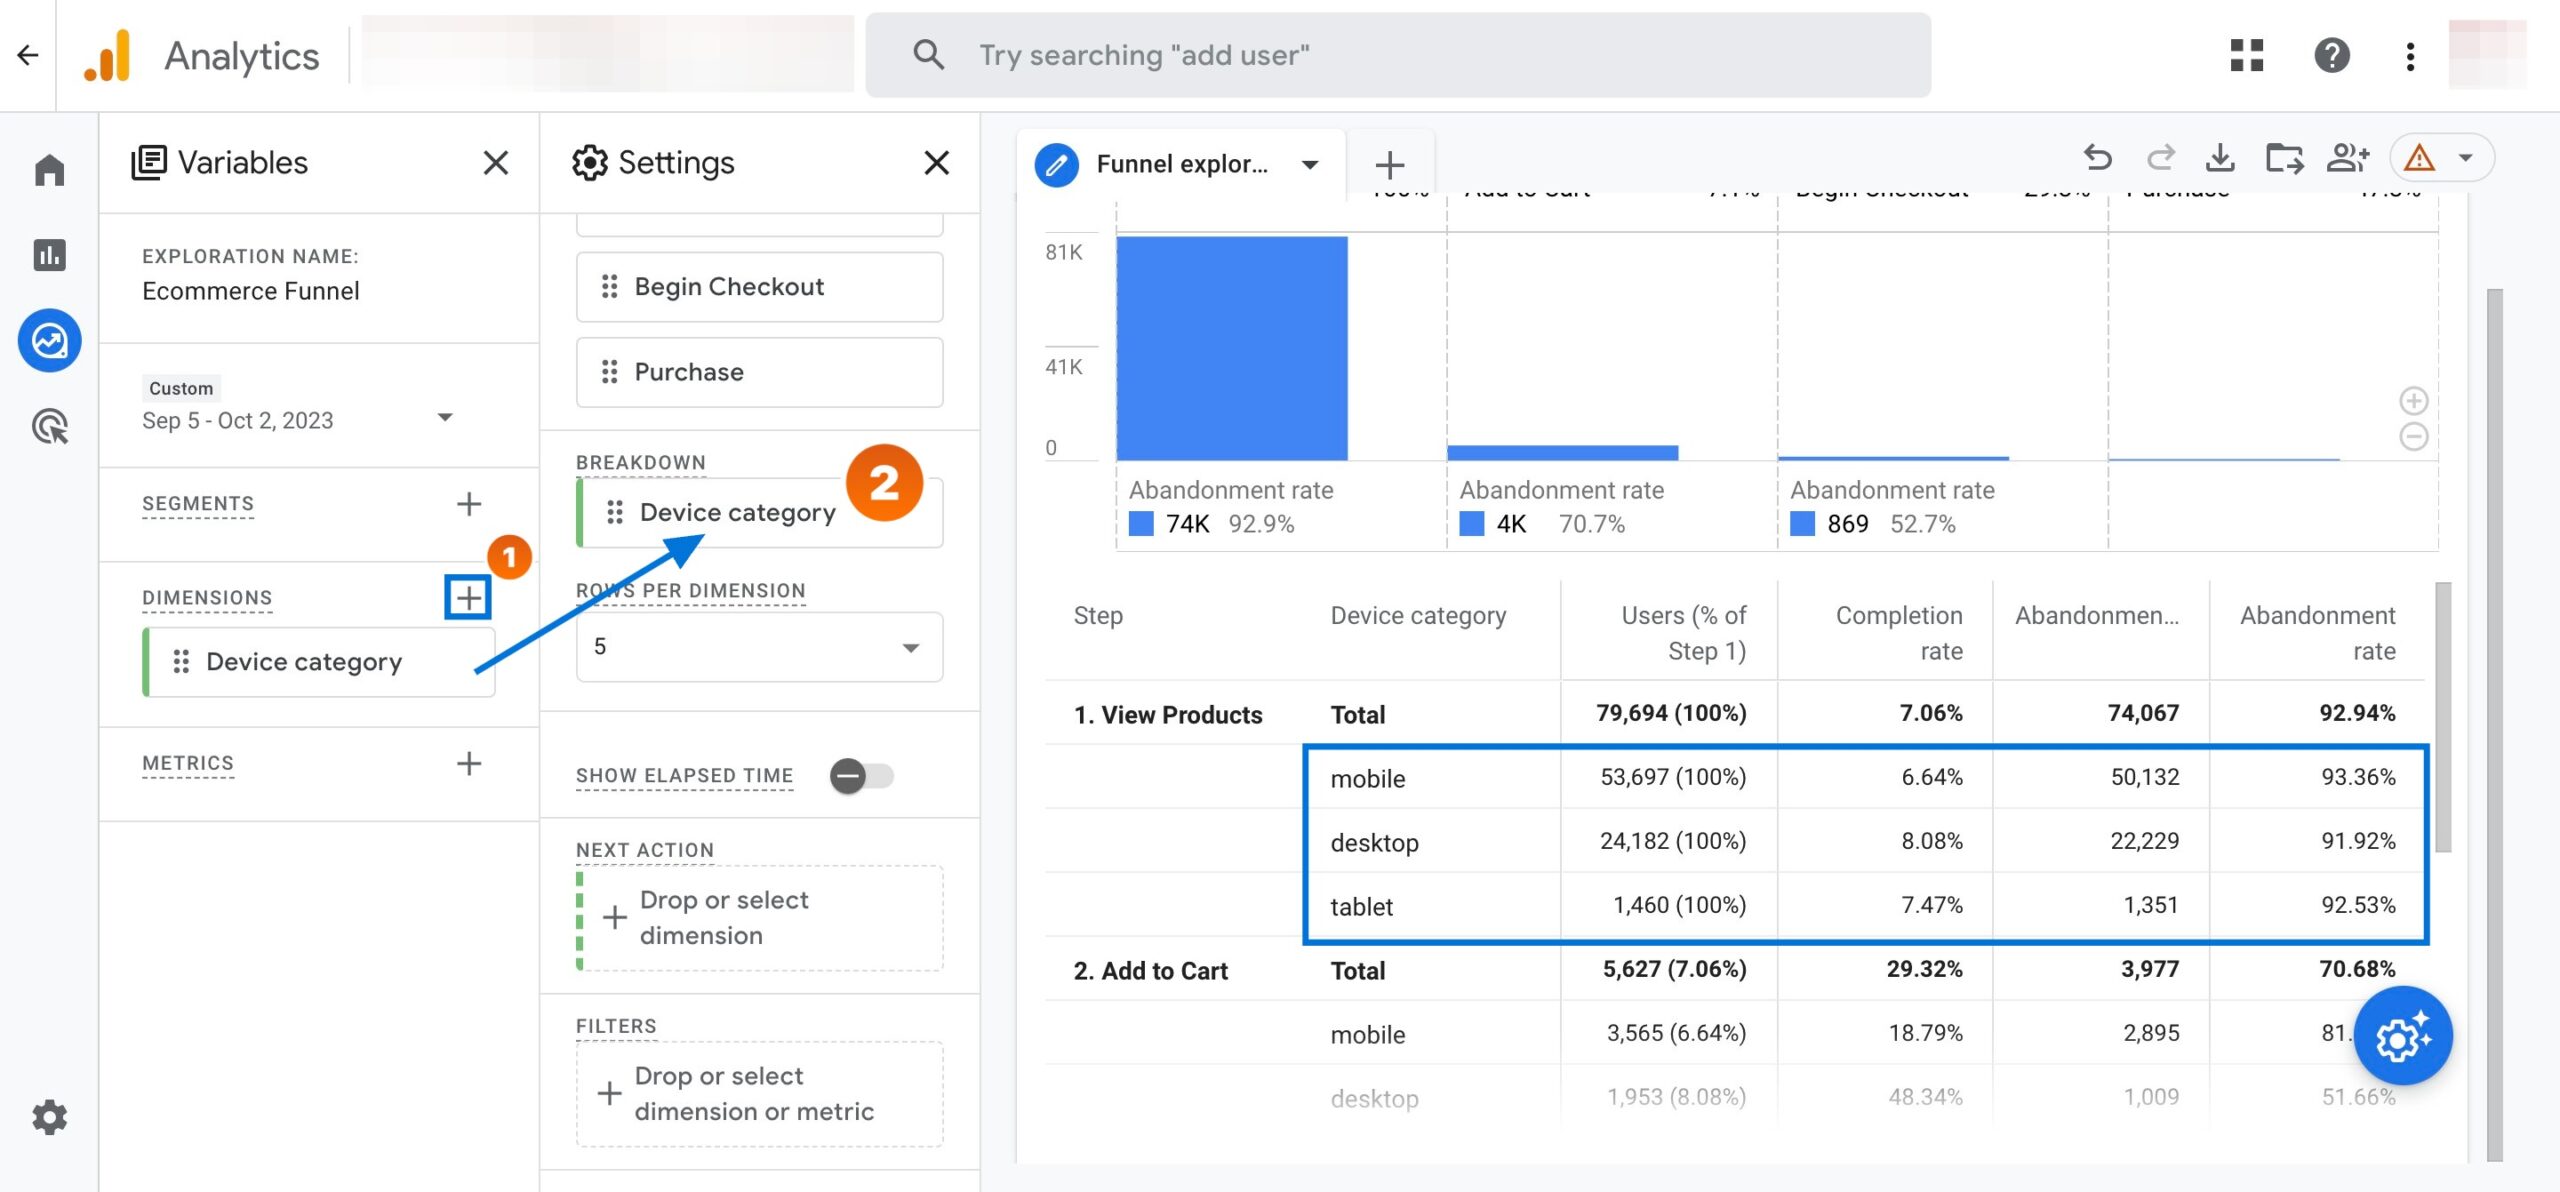
This way, you can break your funnel steps into device categories to see more data related.
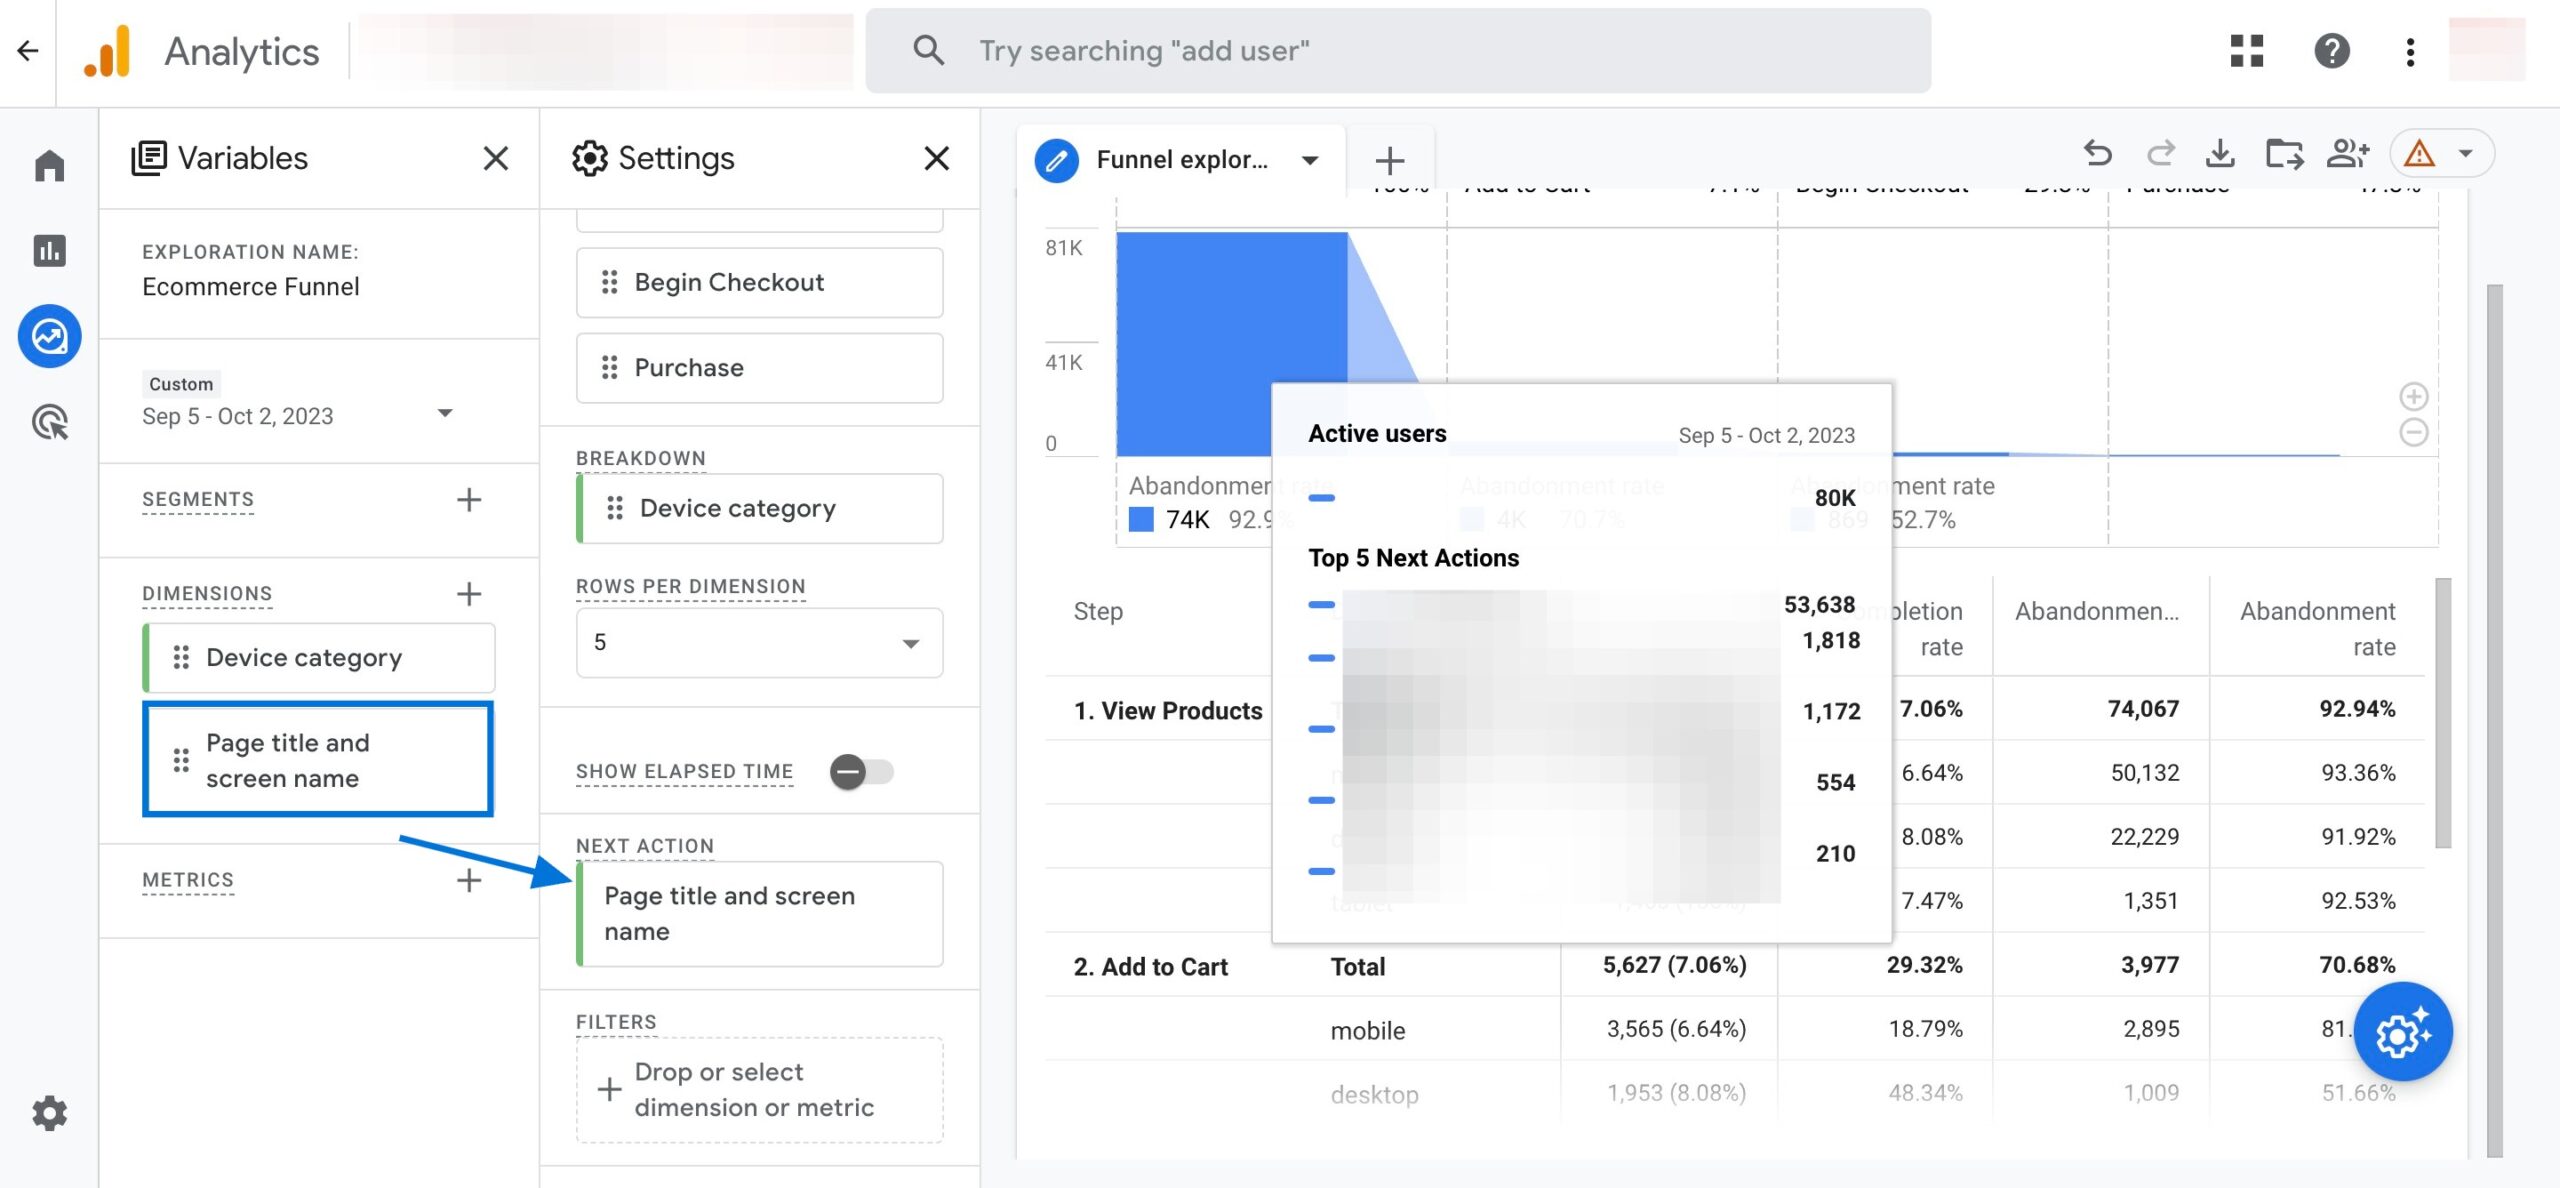
In addition, if you want to know the actions your users take after leaving any of the steps in the funnel, you can add the dimension ‘Page title and screen name’ to the “NEXT ACTION” section.
Then, you can hover over the steps and see the top 5 pages users visit once they do not continue with the next step in the funnel.
Common Funnel Problems in GA4 & Ways to Fix Them
As useful as ecommerce funnels are, issues related to them can sometimes feel overwhelming.
Here are some of the most common funnel problems and a guideline to perfect solutions.
Problem #1: “My ecommerce funnels do not show accurate data.”
Solution: In such a case, your funnel steps might be incorrectly configured and/or implemented. Funnels rely on accurate and consistent data collection and processing to provide meaningful results.
However, sometimes, there might be errors or inconsistencies in how you define or implement your funnel steps. For example, you might use the wrong event name or parameter value for a funnel step, or you might have duplicate events or missing events in your data.
These errors can cause serious problems for your funnel results and lead to incorrect conclusions. To solve this problem, GA4 allows you to use the debug view and the data quality tab to monitor and validate your data collection and processing. If you still can’t get accurate results, you should check your GA4 setup & integration.
Problem #2: “Why do some steps show a 100% exit or continuation rate?”
Solution: If a step shows a 100% exit or continuation rate, it could be because multiple steps have the same pages. For example, if your first step is the homepage, which is ‘/’, it might match all pages with ‘/’. That’s why you’d see a 100% exit rate for the first step. Please take a look at Google’s official documentation on regular expressions to solve this problem.
Problem #3: “My checkout funnels are not working.”
Solution: There might be more than one potential malfunction leading to such a problem. To name one, occasionally, the funnel steps might involve cross-domain tracking issues.
Some ecommerce websites have third-party payment processors which are hosted under different domains – and when redirecting them back to the website after the user completes a checkout, GA4 detects it as a new session because the referral is different. This could lead to missing or incomplete funnel data and inaccurate attribution.
Analyzify helps you set up the most useful ecommerce funnels, including the checkout funnels, and provides you with ecommerce funnels & custom reports on your admin panel. To make sure your data is accurate and complete, the experts audit your existing setup, craft a custom solution for your needs, and double-check all important settings.
Problem #4: “GA4 funnels aren’t capturing data for all user journeys.”
Solution: This issue often arises when not all relevant events have been tracked or set up in GA4. Every interaction a user makes on your website, from clicking a button to adding a product to the cart, requires event tracking.
If some interactions aren’t being tracked, your funnel might show incomplete data. To resolve this, review your user journeys and ensure all relevant events are properly set up and tagged in GA4. Using tools like Tag Manager can help in efficiently setting up and managing these events. Furthermore, keep in mind that GA4 takes a more event-centric approach compared to Universal Analytics, so you need to ensure you’re making full use of its capabilities.
Problem #5: “The funnel visualization is fragmented or appears broken.”
Solution: GA4 uses a more flexible approach to funnels, allowing you to analyze user journeys in a more detailed manner.
However, if not set up properly, this can lead to fragmented views where the journey appears broken or incomplete. One common mistake is setting up events out of sequence or failing to account for all possible user pathways.
Make sure that your funnel setup reflects the actual user flow on your website. Another reason could be due to users blocking tracking scripts or cookies, leading to incomplete data.
In such cases, reminding users of the importance of allowing cookies and ensuring you are GDPR-compliant can help. Additionally, regularly reviewing and updating your funnel steps to match your website’s structure and user behaviour will provide a more cohesive visualization.