While GA4 has brought several new features, it also includes some confusing aspects. A common issue is not being able to see all events in reports in GA4, indicated by a red triangle.
The Red Triangle in GA4 Reports: Indicating Thresholding
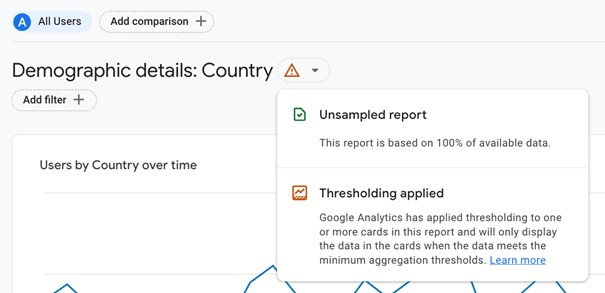
The red triangle in GA4 reports means Google has applied a data threshold to maintain user privacy. This threshold hides certain sensitive data, like demographics or interests, when the user count for an event is too low.
This process, which balances detailed analytics with privacy, cannot be adjusted by users.
The data thresholding feature is central to GA4’s approach, which focuses on tracking users across devices and platforms while ensuring privacy and data accuracy.
How Does Data Thresholding Work in GA4 Reports?
- Purpose: Google Analytics 4 uses data thresholding primarily to protect user privacy.
- Function: It sets limits on the data displayed in reports to balance user privacy with the delivery of insightful analytics.
Privacy as a Central Concern
- Goal: The main aim of data thresholding in GA4 is to safeguard user identities.
- Method: It prevents the possibility of deducing who users are based on their demographics or interests, particularly when such data might contain personal information.
Mechanism of Setting Thresholds
- Data Aggregation: When the data pertains to only a small number of users in a specific event or group, GA4 groups this data together.
- Result: This aggregation results in the presentation of more generalized information, avoiding the disclosure of specific details that could lead to individual identification.
Automatic Threshold Determination
- Dynamic Limits: GA4 autonomously sets threshold limits based on the volume of data and the specific context.
- Balance: This automatic adjustment strives to maintain a balance between privacy protection and the usefulness of the data.
Identification of Thresholding in Reports
- Visual Indicators: GA4 employs visual cues, like a red triangle, to indicate when data has been modified for privacy reasons.
- User Guidance: These indicators help users understand when and how the data is being adjusted, aiding in accurate interpretation and use.
Balancing Privacy and Analytics
Data thresholding in GA4 is all about finding the right balance between getting detailed analytics and keeping user privacy safe.
It groups or hides data when needed, making sure users get a personalized online experience without compromising their privacy.
How to Solve Data Threshold Issue in GA4
Expand Your Date Range: A broader date range can increase user counts and potentially avoid thresholding.
Broaden Your Metrics: Instead of highly specific metrics, consider broader custom events to prevent low user counts and thresholding.
Remove Search Query Data: Omitting this data from reports can help increase user numbers in each row, reducing thresholding.
Disable Google Signals: This feature adds sensitive demographic data, which can trigger thresholding. Turning it off can help, though it won’t affect past data.
Focus on Device-Based Reporting: This approach reduces details on user IDs and Google Signals, which can help avoid thresholding.
Use BigQuery for Reporting: For those needing Google Signals while avoiding thresholding, BigQuery is an effective alternative as it doesn’t include this information.
Switch to Device-Based Reporting Identity: Changing your default reporting identity to device-based prevents the use of Google Signals in calculations, thus reducing thresholding.
Exclude Google Signals in Certain Reports: If using blended or observed identities, consider leaving out Google Signals data. This is useful if you need Google Signals for other purposes, like Google Ads, as it avoids impacting user counts in GA4.
What Is the Impact of Data Thresholding on GA4 Reports
Data thresholding in GA4 is about keeping user data private, especially in sensitive reports. But, this means less detail in your reports. When data is below the needed level, important details might be combined or left out.
This leads to reports that are less detailed, affecting how much you can learn from them.
While it’s great for privacy, data thresholding in GA4 can change how accurate or complete your data is. Some information may be left out or made too general, which can paint a less clear picture of user behavior.
This is a challenge for businesses that need detailed data for making plans or running campaigns, as now they have to make do with less detailed information.
We also suggest reading our blog post about Data Freshness in GA4, another topic of keen interest and importance.
What is Data Sampling in Google Analytics 4 (GA4)?
Data sampling and data thresholding in GA4 are two different concepts often used in analytics, particularly in Google Analytics 4 (GA4). Let’s first understand what each of these terms means and then differentiate between them.
Basic Idea: Data sampling in GA4 is like taking a small piece of a large puzzle to understand the whole picture. It means looking at only part of all the data available, especially when there’s a lot to go through. This method makes it easier and faster to get reports done.
Why Do It? The main goal is to get a quick snapshot of what’s happening on a website or with user behavior. By studying just a part of the data, GA4 tries to give a good guess of the overall situation.
How It Works GA4 picks a random chunk of data to study. What’s found in this smaller set is used to guess what the entire set of data would show.
When Is It Used? Data sampling comes into play in GA4 mostly when:
- There’s a ton of data to look at, and going through all of it would take too long.
- You ask for a complicated report that needs a lot of computer power to create.
The Differences between Data Sampling and Data Thresholding in GA4
Why They’re Used
- Data Sampling is like taking a shortcut to quickly understand a big set of data. It’s used to speed up how fast reports are made.
- Data Thresholding is like putting a filter to keep user information private. It’s used to make sure user data stays safe and follows privacy rules.
When They Happen
- Data Sampling comes into play when there’s a lot of data or when you need a really detailed report.
- Data Thresholding in GA4 kicks in when handling sensitive info or when there are not enough users to keep data anonymous.
What They Do to Data
- Data Sampling means you’re only looking at part of the data, which might make the report less precise.
- Data Thresholding involves either hiding or making user data more vague, which makes reports less detailed.
How Much Control You Have
- In Data Sampling, you might be able to choose how much of the data you sample.
- Data Thresholding in GA4 happens on its own, and you can’t change how it works.
How You Know They’re Happening
- Data Sampling might not always be obvious in GA4 reports.
- Data Thresholding is usually shown with a sign, like a red triangle, in GA4 reports.
Final Words
To effectively use Google Analytics 4 (GA4), it’s important to grasp its data thresholding and data sampling features. The red triangle symbol in GA4 indicates privacy protection in action, modifying data to ensure user confidentiality.
To enhance clarity in your insights, try expanding your date range or choosing broader metrics, which can mitigate the effects of data thresholding in GA4.
Additionally, data sampling in GA4 offers a swift, general perspective on user trends. For those requiring more comprehensive analysis, especially with sensitive data, integrating tools like BigQuery is advisable.
Finally, proficient use of GA4 entails balancing the demand for detailed analytics with the imperative of safeguarding user privacy.