Shopify Analytics offers a comprehensive look at your store’s data, from where your visitors come from to what they do on your site. This guide will show you how to use Shopify Analytics reports to improve your store’s performance.
Key points:
- Traffic and Behavior Insights: Find out how visitors find and interact with your store. Use this data to make your site more user-friendly and target your marketing better.
- Customer Analysis: Understand who your customers are and what they want. This information can help you keep them coming back for more.
- Financial Health: Keep a close eye on your store’s financial performance. We’ll explore how to track revenue, expenses, and profitability.
- Inventory Management: Learn how to manage your stock effectively, ensuring you have the right products at the right time.
- Marketing Effectiveness: See which marketing efforts are paying off. We’ll break down how to track the success of your campaigns and adjust for better results.
By the end of this guide, you’ll know how to use Shopify Analytics reports to refine your strategies, enhance customer experience, and boost your store’s overall performance.
Acquisition Reports
Shopify Analytics’ acquisition reports help you see how people find and use your online store. They focus on three key details: how many visits you get over time, where your visitors come from, and where in the world they are.
Here’s what the main reports cover:
- Sessions Over Time: This part counts how many people visit your store and how often, during a certain period. It helps you spot when you get the most visits and lets you group the data differently for a closer look. Remember, the numbers might be updated every two days to make sure they’re right by removing fake traffic like bots.
- Sessions by Referrer: You’ll find out whether people come to your store directly, through search engines, or from places like social media or other websites. This gives you a clearer picture than the basic analytics and shows which ways work best for bringing people to your store.
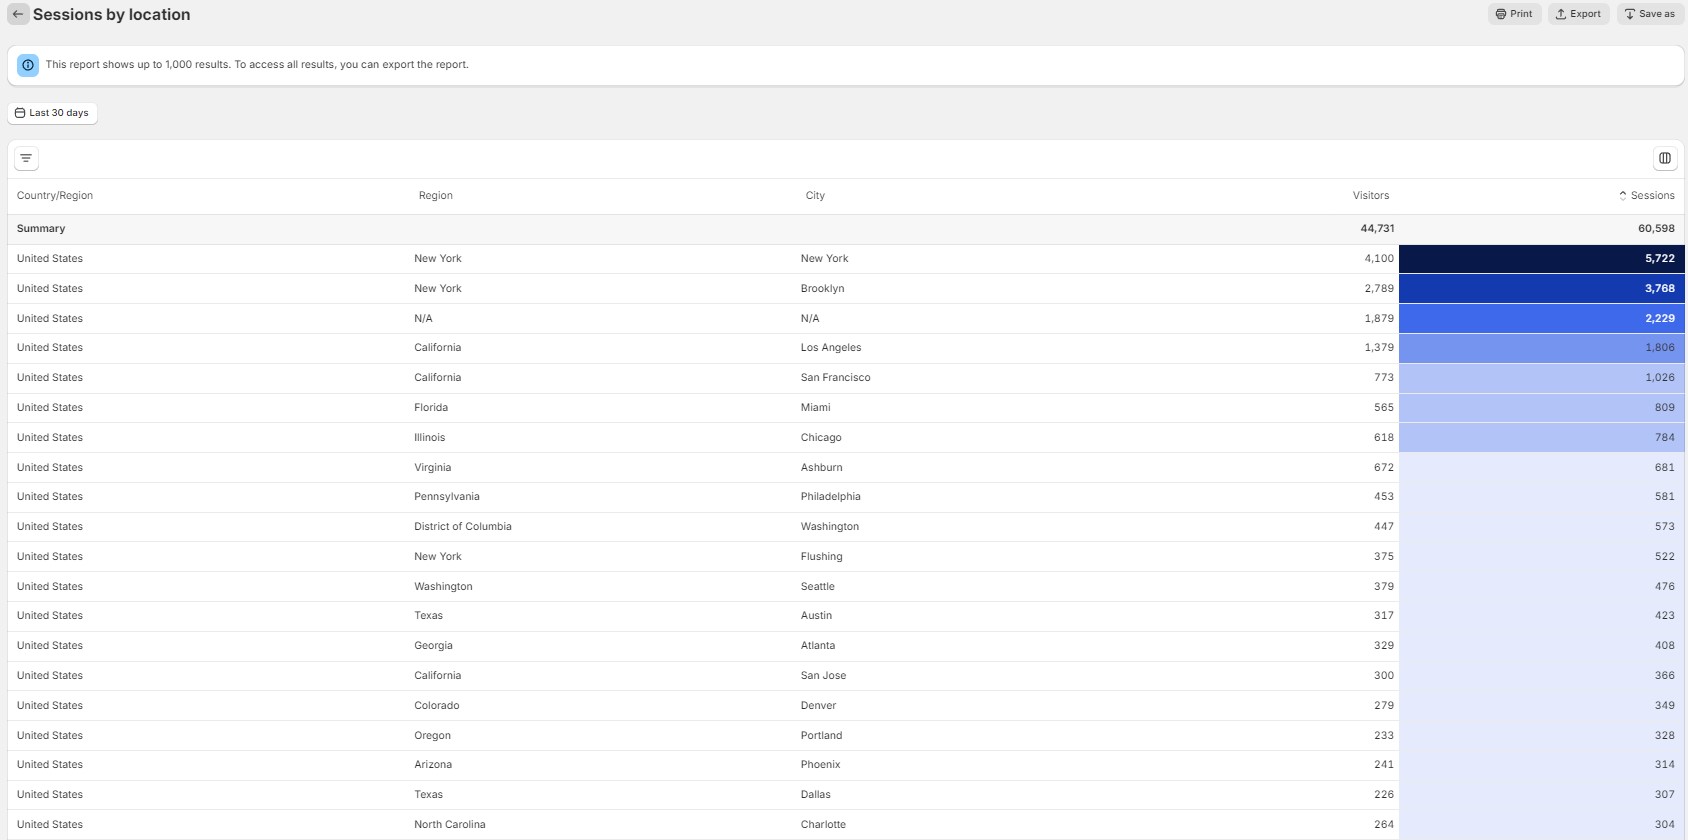
- Sessions by Location: This section tells you the countries your visitors are from, which is great for planning your ads and seeing how far your store reaches around the world.
How Acquisition Reports Help You?
Knowing where your visitors are from and what they do on your site can guide your ads and where you spend your money.
For example, if more people are coming from social media, you might want to spend more on ads there. Or, if you’re getting a lot of visitors from a certain country, you might think about making your store more appealing to them.
You can also refer to the official documentation provided by Shopify.
Behavior Reports
Behavior reports from Shopify Analytics look into what customers do in your online store. They’re key to figuring out shopping habits, making your store easier to use, and making sure people see your products.
Here’s what the main reports cover:
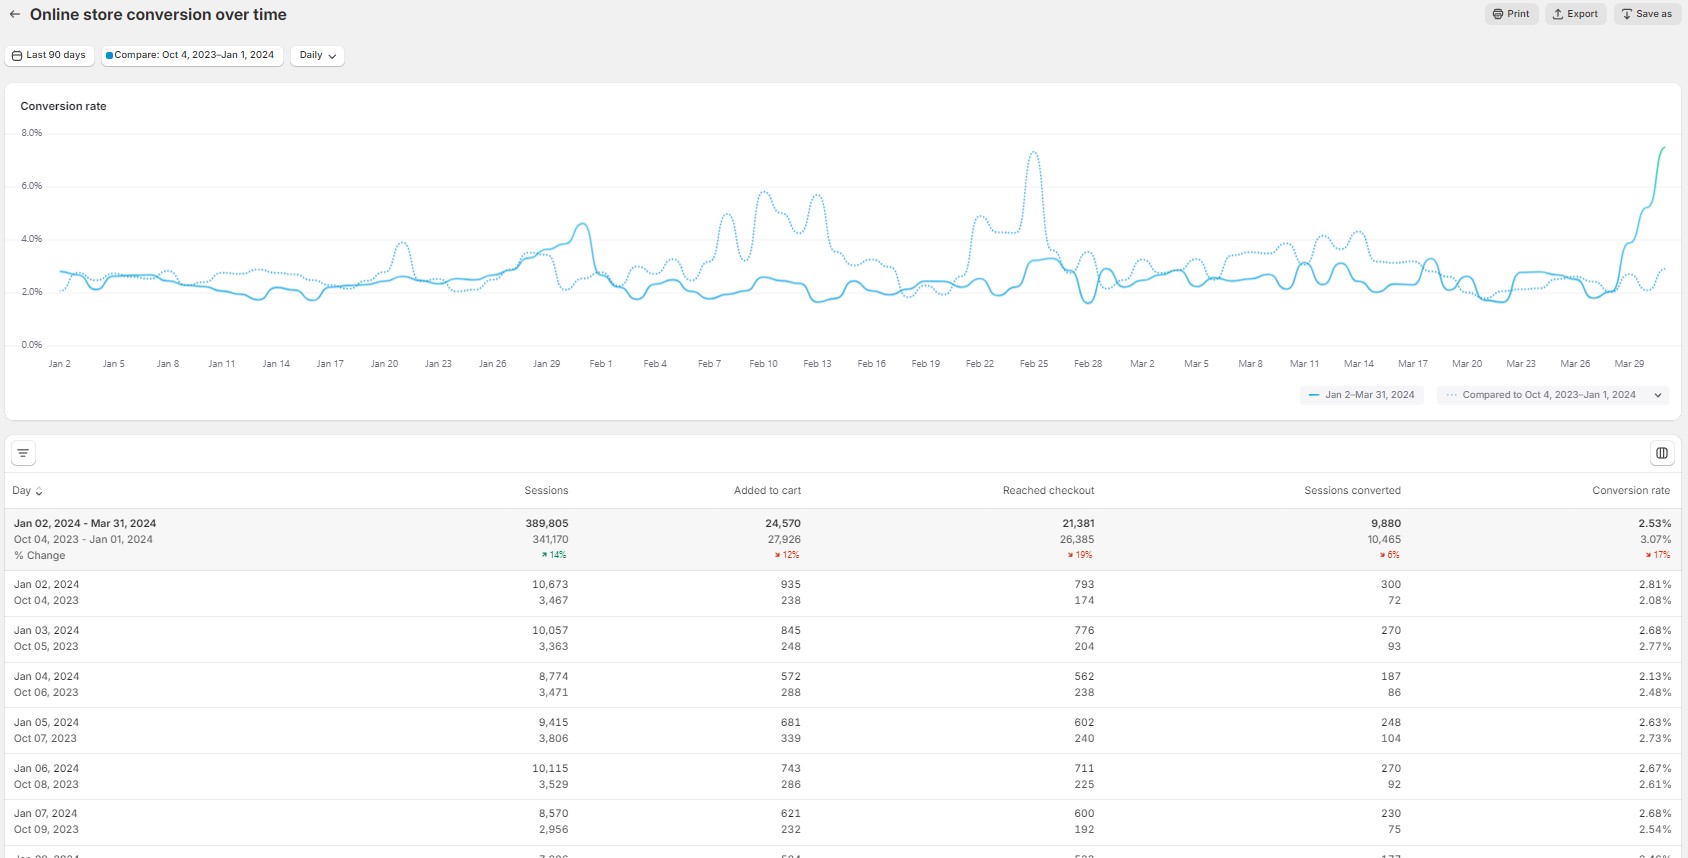
- Online Store Conversion Over Time: This tells you what percent of visitors buy your products. It helps you see if your store is doing a well at making sales over time.
- Online Store Speed: Helps you to understand how fast your store loads compared to others and suggests where you might need to fix things to make it faster.
- Product Recommendation Conversions Over Time: This shows if the products you suggest are leading to sales.
- Top Online Store Searches: Helps you to see what your customers are looking for on your site, including searches that don’t find anything, which could mean you need more products or better search terms.
- Sessions by Landing Page: This finds out which pages bring people into your store the most.
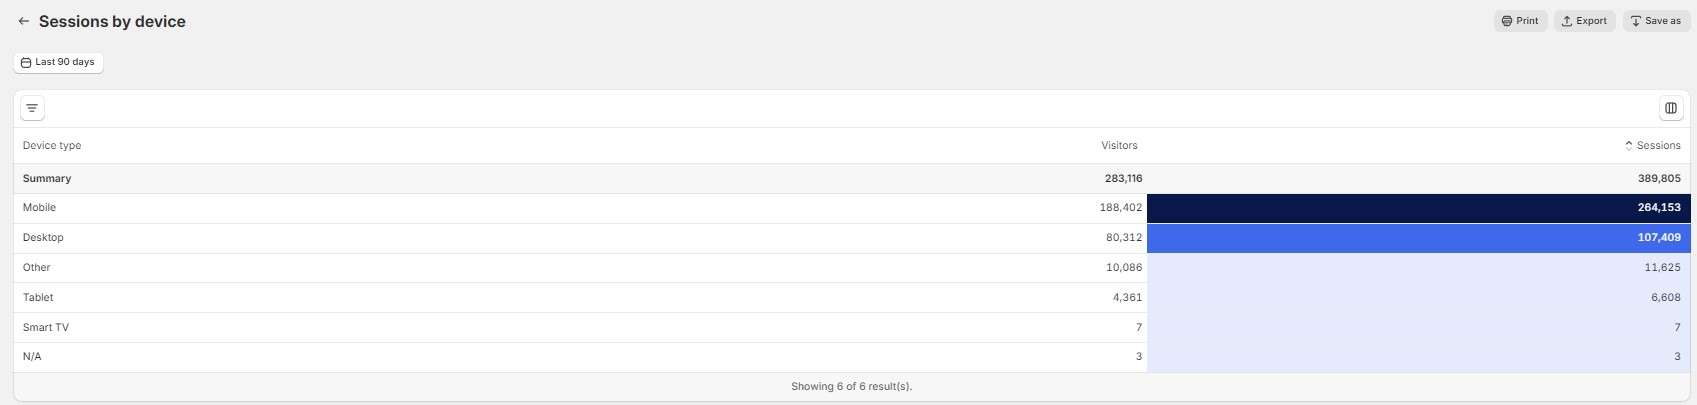
- Sessions by Device: This points out what kind of tech (like phones or computers) customers use to visit your store, which helps you make sure your site works well on all devices.
- Online Store Cart Analysis: Helps you to see what products people often put in their carts at the same time, which can give you ideas for product bundles or special deals.
How Behavior Reports Can Help You?
Behavior reports are a useful resource that can help improve how you market your products, applicable in both online and offline contexts.
With the insights gained from these reports, you can pinpoint your top customers to target them with more deals, thereby potentially increasing their loyalty and frequency of purchases. These reports also allow you to establish special prices and bundles that encourage customers to buy more.
Additionally, they provide the information needed to adjust your store layout, making it easier for customers to find and purchase products, which could lead to better sales outcomes.
If you’re looking to enhance your Shopify store by bundling products, we’ve carefully curated a list of the top Shopify apps for upselling and cross-selling.
Customer Reports
Customer Reports in Shopify Analytics give you the scoop on who’s buying from your store and what they like. This info is helpful for figuring out the best ways to talk to your customers, keep them coming back, and get more sales.
Here’s what the main reports cover:
- Customer Overview Over Time: See how many new customers you’re getting and if your ads or the time of year are making a difference.
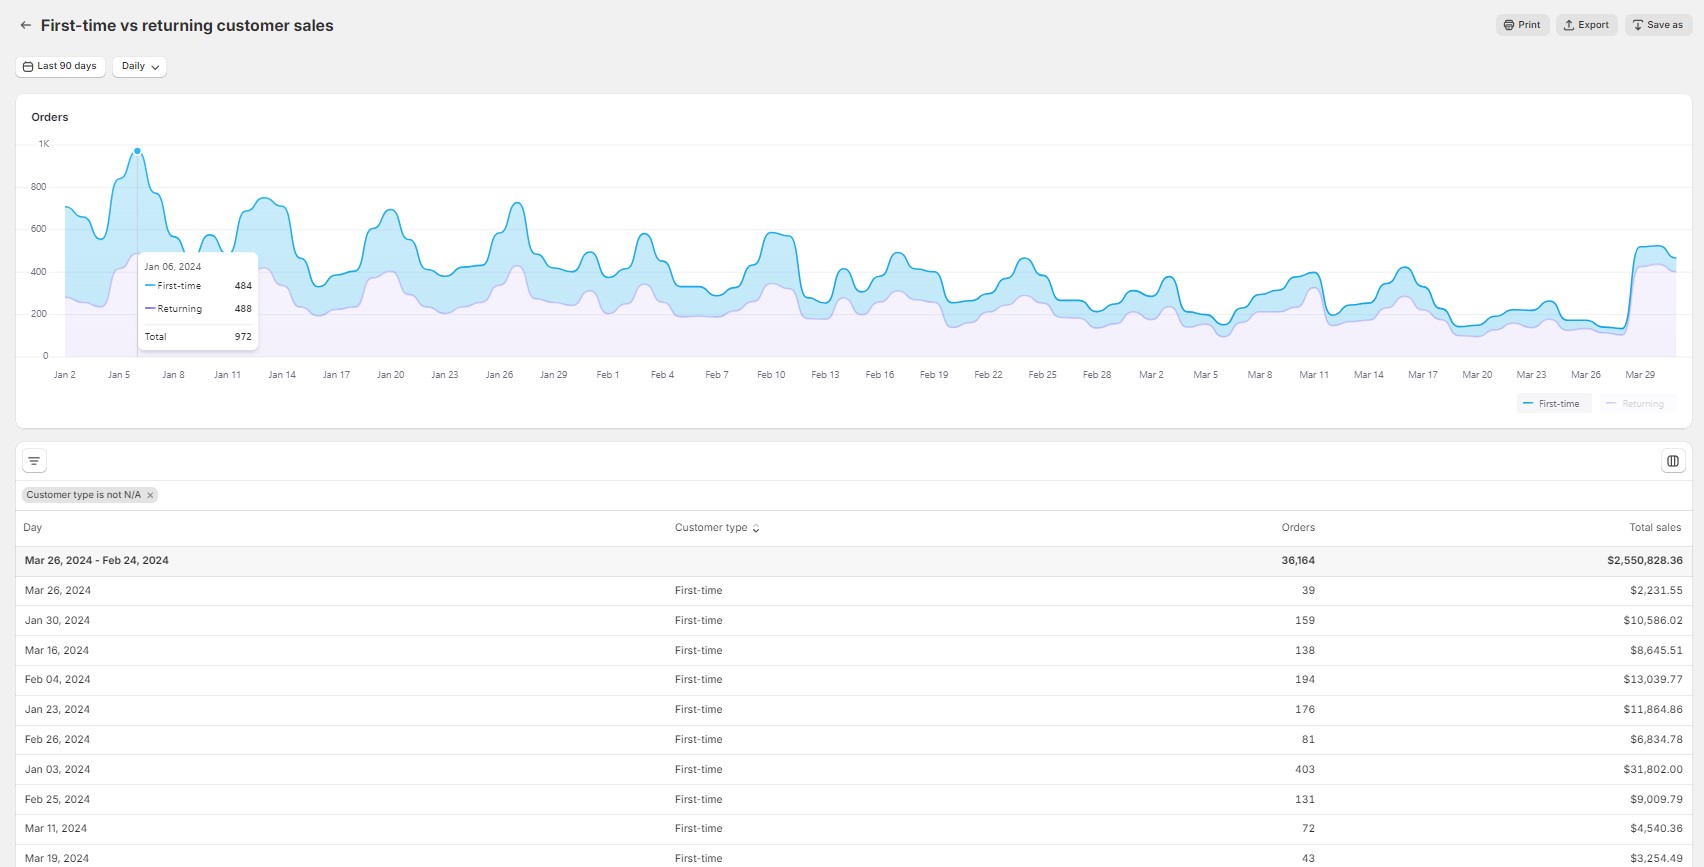
- First-Time vs Returning Customer Sales: Look at who’s buying for the first time and who keeps coming back, so you know if your efforts to keep customers happy are working.
- Geographical Insights: Find out where in the world your customers are, which can help you decide where to focus your ads and how to plan your shipping.
- Customer Loyalty and Frequency: Figure out who’s shopping just once and who loves your store enough to return, so you can make special offers just for them.
- Predicted Spend: Get an idea of how much your customers might spend later based on what they’ve bought before.
How Customer Reports Can Help You?
Customer reports provide valuable insights, allowing you to customize ads to different customer groups effectively. These insights help you identify and offer deals to customers at risk of leaving and reward returning customers with special treats.
They also guide you in planning sales by considering where most of your customers are located.
Furthermore, this information aids in deciding whether to prioritize attracting new customers or retaining existing ones, optimizing your business strategy.
Bonus Content: For creating exclusive offers for your loyal and returning customers, we’ve meticulously selected the finest Shopify loyalty and rewards apps.
Important Note:
Just remember, some of the reports might not show the latest info right away because it takes time up-to 48 hours to put it all together. But things like new vs. old customer sales are pretty much up-to-the-minute. And when you’re looking at new customers, you’ll see everything they’ve bought, not just recently, but all the way back.
Finances Reports
Shopify’s finances reports are like a check-up for your store’s cash health. They show you what you’re earning, spending, and how cash moves in and out. This info is important for keeping your store’s finances in check and making smart money moves.
Here’s what the main reports cover:
- Cost of Goods Sold (COGS): This tells you how much you spend to make your products, which helps you figure out your real profit.
- Discounts: Keeping an eye on discounts shows you if they’re helping or hurting your sales and profits.
- Gift card sales: Watching how much people spend on gift cards and what’s left on them can clue you in on future sales.
- Gross Payments by Month: This gives you a quick look at how much money you’re making over time.
- Gross Profit: This is what you earn from sales minus the costs of your products, showing if you’re making money before other expenses.
- Gross Sales vs. Net Sales: Total sales are everything you sell without changes, while actual sales take out returns and discounts to give you a real look at your cash.
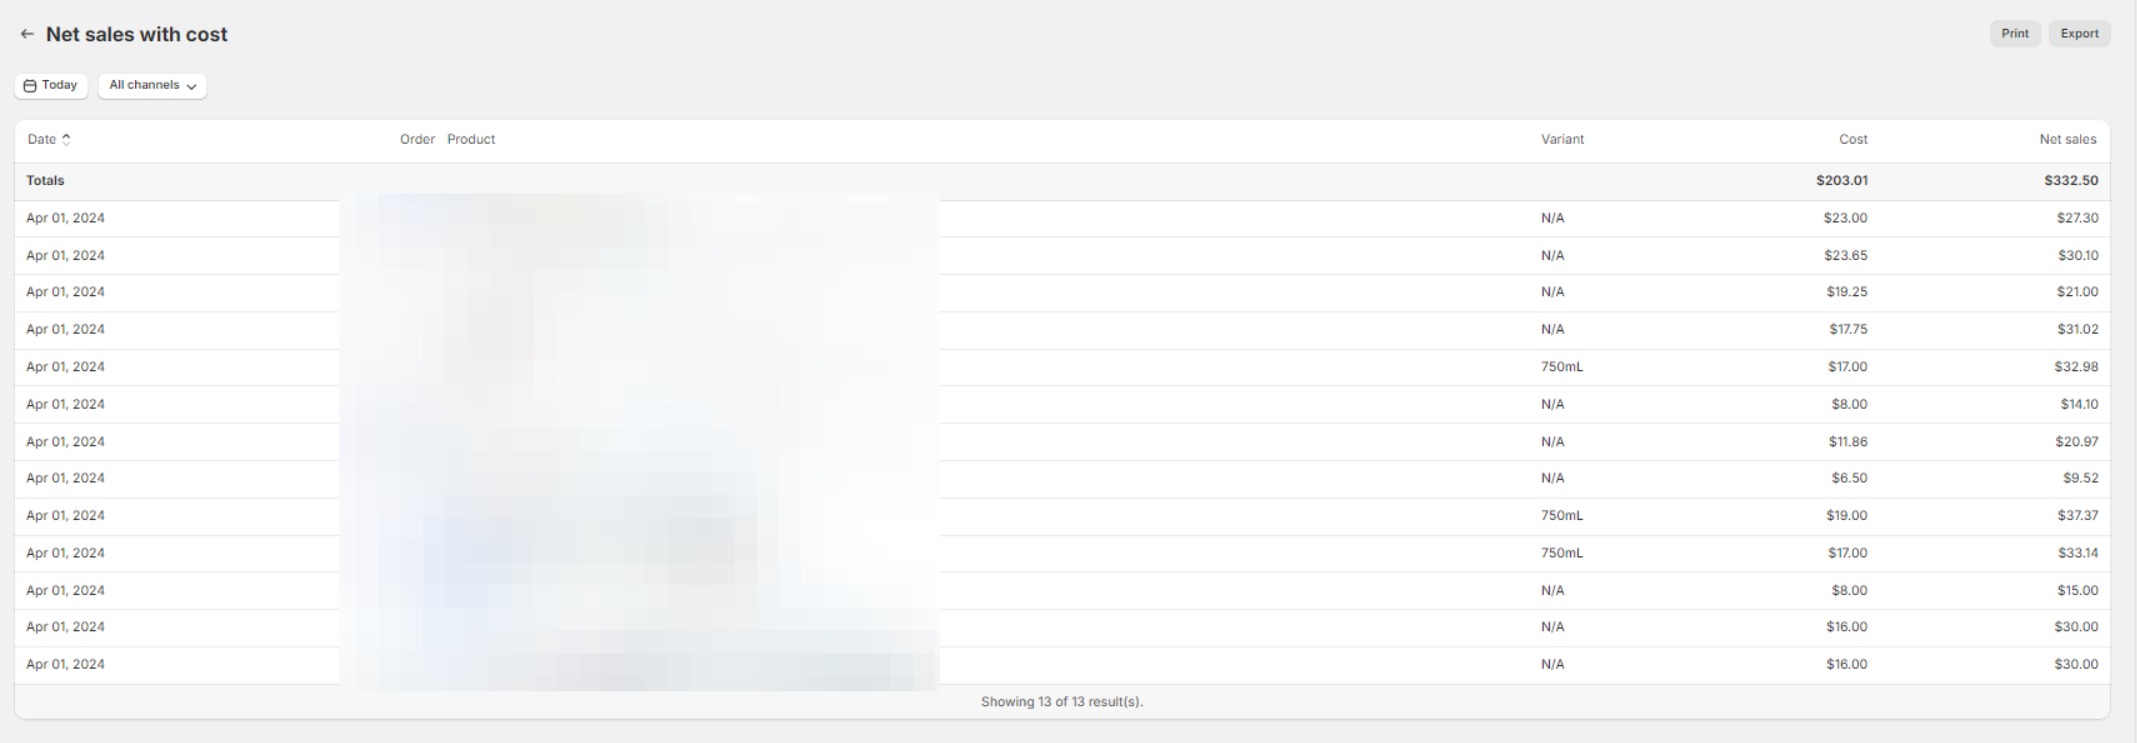
- Net Sales with/without Cost: These numbers show you how much you’re really making after paying for the products.
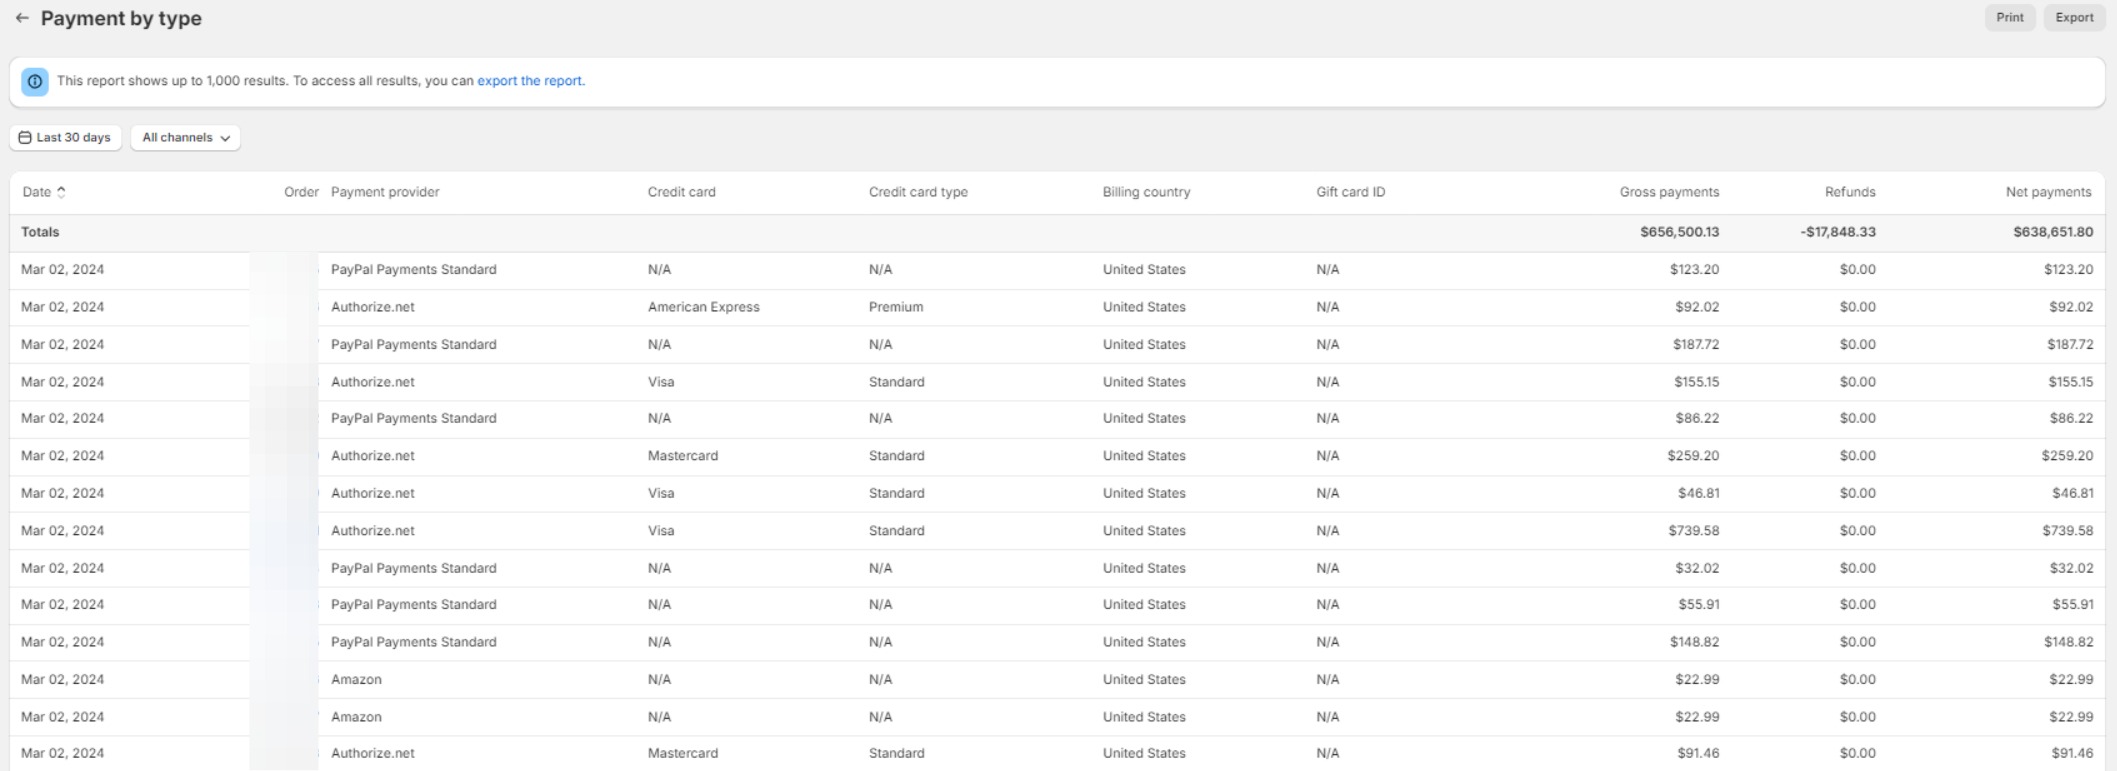
- Payment by Type: Knowing how customers pay can help you make paying easier at checkout.
- Returns: Keeping track of returns helps you manage your stock and fix any product or customer issues.
- Shipping: Balancing shipping costs and what you make from it is key to not losing money.
- Taxes: Keeping taxes straight is a must-do for following the rules and managing your store’s money.
- Tips: Tips aren’t for everyone, but if you get them, they’re worth watching.
- Total Sales: This is all the money you make, giving you a big-picture view of how your store’s doing.
How Finances Reports Can Help You?
Shopify’s Finances Reports enable you to track sales and returns by date, helping you identify trends and customer habits. They also allow you to monitor taxes, ensuring compliance and preparation for tax season.
By showing popular payment methods, these reports guide you on which ones to emphasize.
Understanding your cash flow, including the most profitable products, informs decisions on inventory and marketing strategies to increase earnings.
Inventory Reports
Shopify’s inventory reports provide merchants with a detailed look into their stock levels, sales trends, and product performance, enabling effective inventory management and decision-making. Let’s explore some key inventory reports available on Shopify and how you can use them to optimize your business operations.

Here’s what the main reports cover:
Month-End Inventory Snapshot & Value These reports show the quantities of each product variant remaining in stock at the end of the month. You’ll also see the total value of available inventory, excluding committed and incoming units. You can use this information for better financial planning and inventory control.
Average Inventory Sold Per Day This report reveals the daily average number of items sold for each product variant. It also helps you understand product popularity and sales velocity. You can adjust your procurement and marketing strategies based on these insights.
Percent of Inventory Sold Shows the percentage of stock sold for each product variant over a customizable period. You can identify top-performing products and consider promotions for slower-moving items.
ABC Analysis by Product The report categorizes product variants into A, B, and C grades based on revenue contribution.
- A-grade: Top performers (80% of revenue). Focus on restocking and promotion.
- B-grade: Moderate contributors (15% of revenue).
- C-grade: Minimal contributors (5% of revenue).
Product Sell-Through Rate It shows the percentage of inventory sold during a selected period.
- High rate: Strong sales or potential understocking.
- Low rate: Overstocking or declining demand.
Days of Inventory Remaining Gives an estimation on how long your current inventory will last based on past sales rates. You can identify products likely to run out soon for optimal stock levels.
Understanding Negative Numbers and Values Over 100%
Negative numbers: Result from overselling a variant or not enabling inventory tracking (inaccurate starting quantity). Values over 100% in the percent of inventory sold report: Occur due to overselling or negative starting quantities (more sales than available stock).

How Inventory Reports Can Help You?
By regularly reviewing these reports, you can focus on promoting A-grade products, which are likely to boost revenue. For B and C-grade items, efficient management can help in optimizing costs.
Additionally, paying attention to sell-through rates and the number of days inventory remains can aid in preventing both stockouts and overstocking.
Implementing the insights gained from these reports can lead to better stock control, improved financial health, and higher customer satisfaction.
Bonus Content: Explore our curated selection of best Shopify store management apps for streamlined inventory management.
Marketing Reports
Shopify’s marketing reports help you see how well your marketing efforts are working. They show you which channels bring in the most customers and the ones who spend the most. Let’s explore the different reports available and how they can improve your marketing plans.
Here’s what the main reports cover:
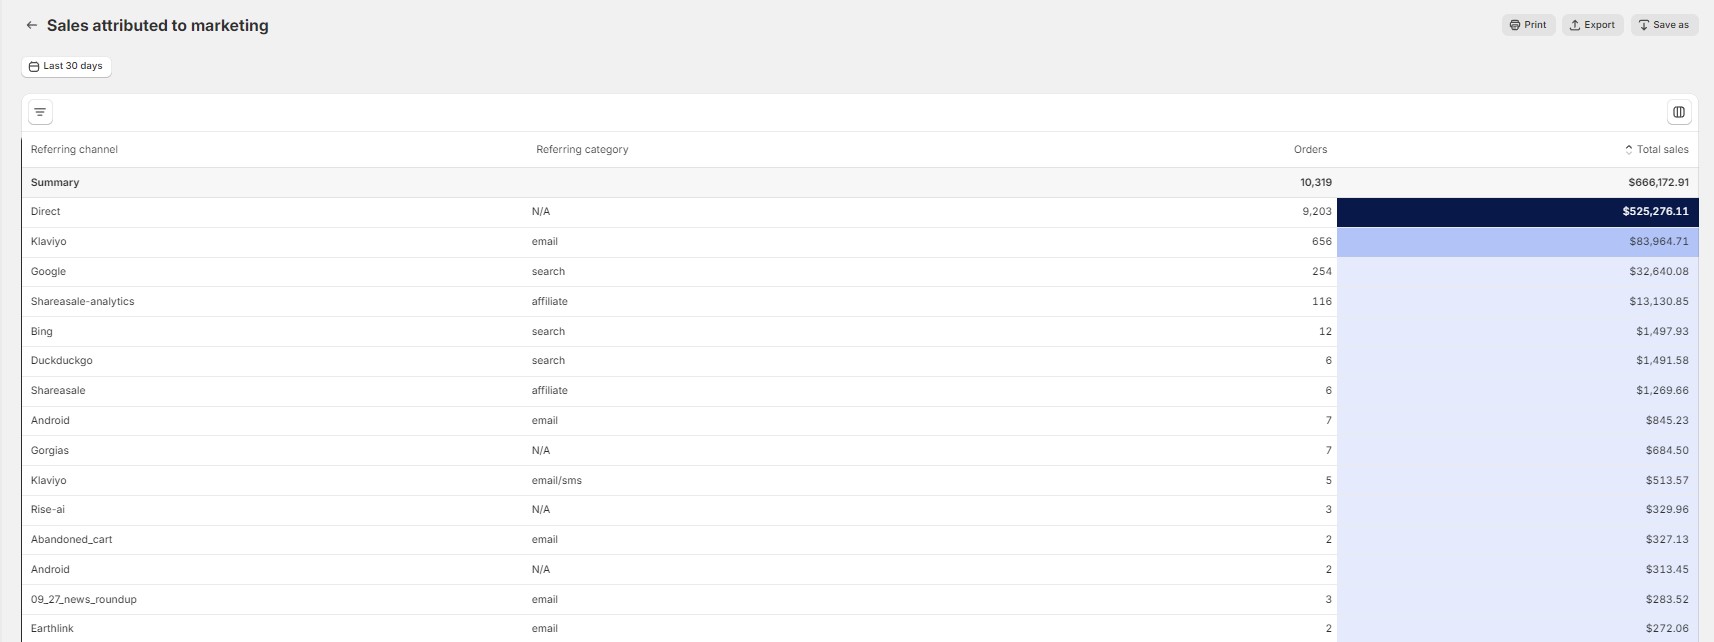
- Sales Attributed to Marketing: This report shows you sales directly linked to your marketing efforts, both from Shopify and outside campaigns you track with codes (UTM parameters). It helps you see which marketing activities bring in sales, so you can spend your marketing budget wisely.
- Sessions Attributed to Marketing: This report reveals how many people visit your store thanks to your marketing. It’s important to understand how much traffic your campaigns generate and how to improve it to get more people interested and buying.
- Conversion by first interaction: These reports show you a customer’s path from first seeing your store to buying something. By looking at these interactions, you can see which channels are best at introducing new customers and which ones turn them into paying buyers.
- Attribution Model Comparison: This report compares the number of orders and average order value based on how customers first interacted with your store and how they last interacted before buying. It helps you see how different marketing strategies directly affect sales.
- Visitors by Marketing Campaign: This report focuses on how many visitors a specific marketing campaign with UTM codes brings in. It gives you a sense of how well your campaigns are working at attracting traffic.
How Marketing Reports Can Help You?
Understanding where your customers come from—be it direct traffic, search engines, email, or social media—enables you to attribute sales accurately to the various marketing channels. This understanding is crucial for optimizing your marketing efforts, allowing you to allocate resources more efficiently to the channels that yield the highest returns.
Using UTM parameters in your marketing campaigns offers a granular view of their effectiveness, helping you pinpoint which initiatives attract the most valuable customers.
Additionally, insights into the devices your customers use and the performance of specific landing pages can guide your advertising strategies and website design, ensuring a positive experience for users regardless of their entry point to your site.
Order Reports
Shopify’s order reports give you a complete picture of your store’s orders, from how many you get to how you fulfill and deliver them. This lets you track how your business is doing and make smart changes to improve.
Here’s what the main reports cover:
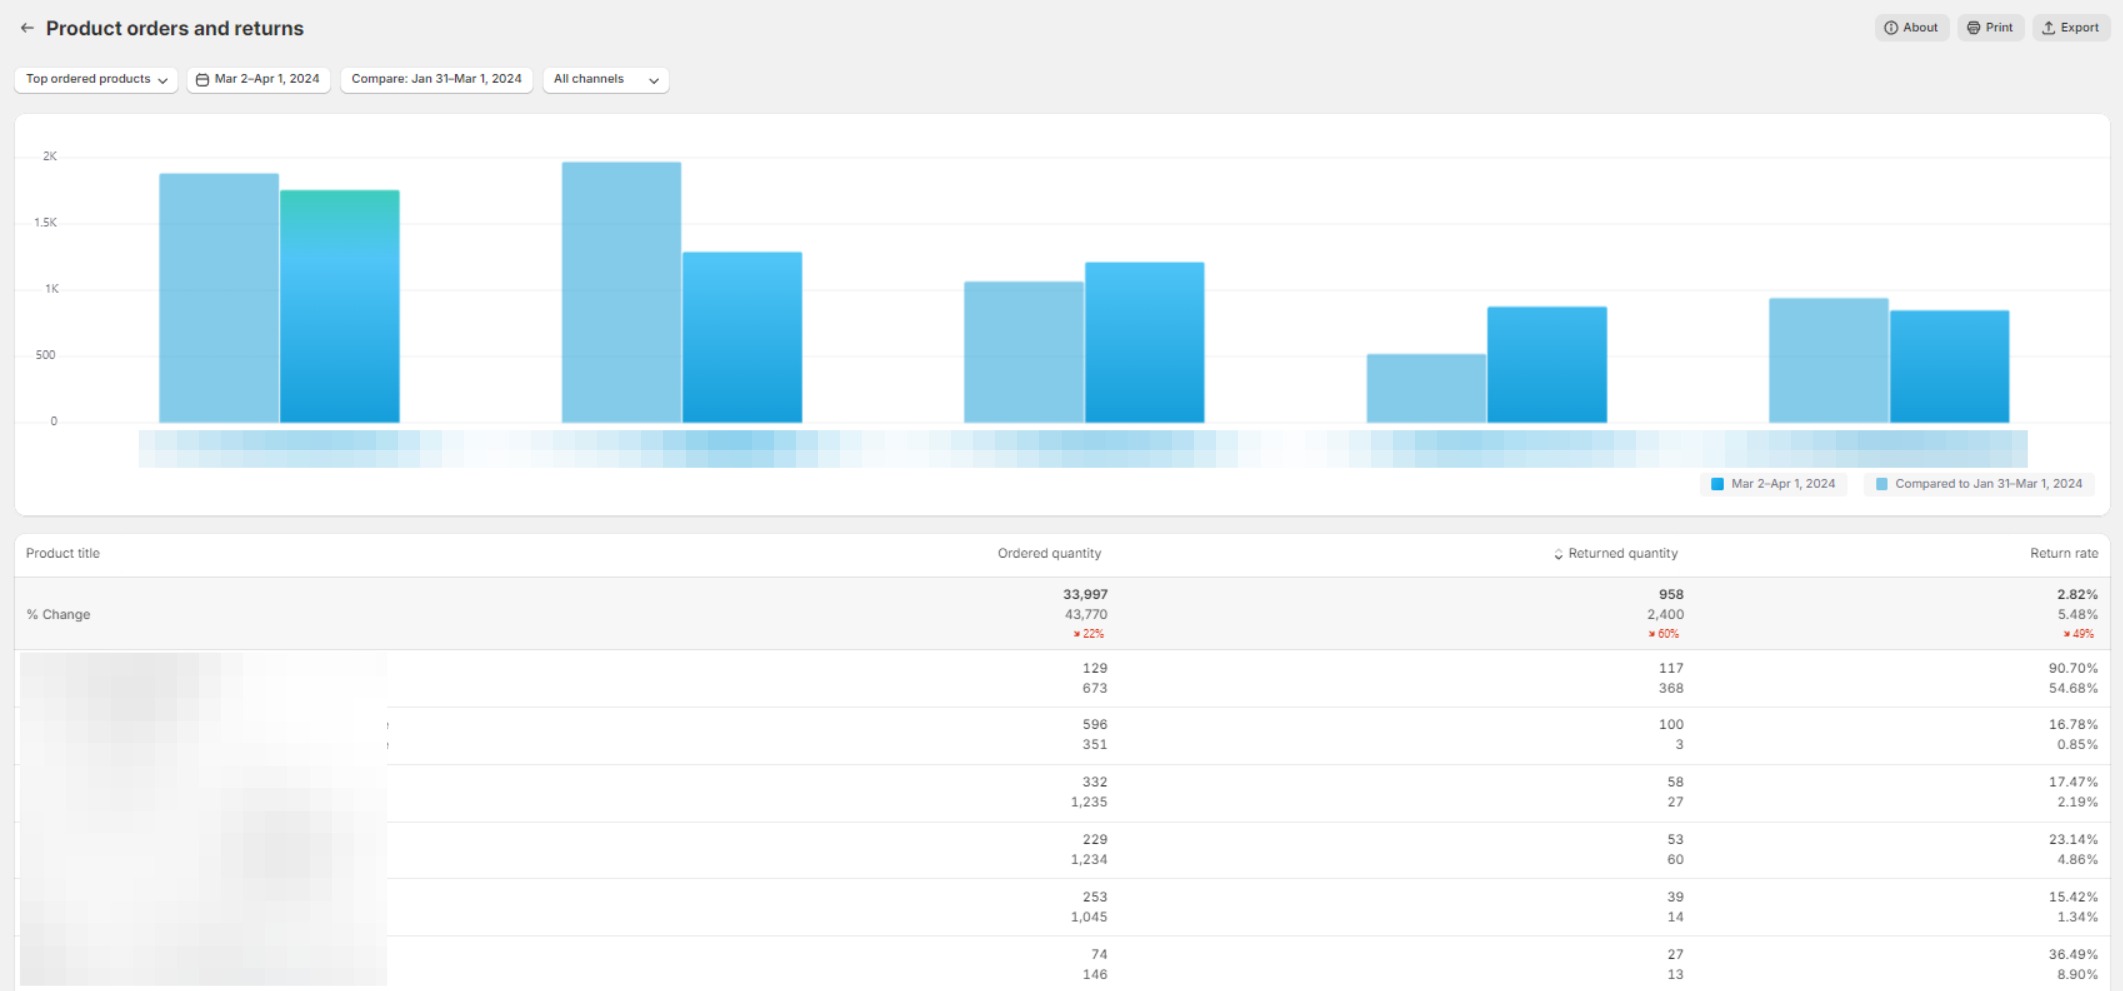
- Product Orders and Returns: This report shows you which items are popular and which ones come back more often. You can see the total number sold and returned for each product, helping you identify what’s popular and what might need a price adjustment, better description, or quality check.
- Orders Over Time: See how many orders you get over a chosen period. This helps you gauge your store’s performance and spot trends in your sales. The report also shows the average number of items and total amount people typically spend, giving you clues about what customers are buying.
- Fulfillment, Shipping, and Delivery Times: This report tracks how long it takes to get an order ready (fulfillment), shipped, and delivered. You’ll see average times for each step. This information is important for knowing how efficient your fulfillment process is and setting realistic delivery expectations for customers.
- Fulfillment Over Time: See how many orders you fulfill, ship, and deliver over a chosen period. This report helps you understand how your fulfillment processes handle growth over time.
- Shipping Labels Over Time (if using Shopify Shipping): This report tracks trends and costs for buying shipping labels (excluding returns, voided labels, and non-Shopify labels). It’s a valuable tool for managing your shipping expenses.
How Order Reports Can Help You?
Understanding which products sell best and dealing with items that are frequently returned allows you to adjust your inventory accordingly, promote your most popular items, and address any issues with products that have high return rates.
Analyzing the fulfillment process to identify how long it takes to fulfill orders and where holdups occur can lead to improved efficiency and customer satisfaction.
You can manage shipping expenses by tracking the cost of shipping labels over time, aiding in the development of more effective shipping strategies and negotiations with carriers.
Order reports can also help you to adjust to sales variability by monitoring order volume changes, enabling you to predict demand, plan for peak periods, and tailor your marketing efforts accordingly.
Profit Reports
Shopify’s profit reports take a deep dive into your store’s financial health, focusing on your costs, profit margins, and overall bottom line. By entering your cost per item, these reports give you an accurate picture of your gross profit on each product. This information helps you make smarter decisions about pricing and what to keep in stock.

Here’s what the main reports cover:
- Profit by Product: Shows which products are more profitable. This helps you identify your star performers and potentially adjust your inventory or marketing efforts.
- Profit by Variant: You can get a detailed breakdown of profit for each version of a product (size, color, etc.). This can help you see which variations are most profitable and which might need adjustments.
- Profit by Location (for Multi-Location Businesses): If you sell in multiple stores or regions, this report shows your profit breakdown by location. This is helpful for understanding where you’re most successful.
- Impact of Discounts and Refunds: You can see how discounts and refunds affect your profit margins. This helps you understand the true cost of promotions and make informed decisions about future offers.
How Profit Reports Can Help You?
Profit Reports are valuable for understanding your business’s financial health. It’s important to include your cost per item to ensure the accuracy of profit calculations for each product.
Analyzing discounts and refunds helps assess whether promotions are yielding expected profits and may highlight the need to tweak marketing strategies.
By using profit reports you can make adjustments in inventory and pricing strategies to improve your bottom line.
Sales Reports
Shopify’s sales reports provide a comprehensive overview of your store’s performance, offering detailed insights into product sales, customer buying patterns, and sales trends. The sales reports are essential for guiding your business strategies to increase revenue and enhance operational efficiency
Here’s what the main reports cover:
- Sales Over Time: By examining the changes in your sales over time, you can identify trends and patterns that inform your inventory and marketing decisions.
- Sales by Product: You can discover which products are your top sellers, enabling you to manage your inventory more effectively and target your marketing efforts accordingly.
- Performance by Variant: Analyzing how different versions of the same product (such as size and color) perform can help you understand customer preferences and adjust your product offerings.
- Supplier Performance: You can track sales by supplier to identify your most reliable sources, guiding your purchasing decisions and helping you maintain strong supplier relationships.
- Impact of Discounts: Understanding the effect of discounts on your sales allows you to gauge the success of promotions and refine your marketing strategies for better results.
- Customer Traffic Sources: By identifying where your most profitable customers originate, you can optimize your marketing efforts and allocate your advertising budget more effectively.
- Sales by Location: Analyzing sales data by geographic location helps you tailor your marketing and shipping strategies to better serve customers in specific regions.
- International Sales: You can gain insights into how your international sales are performing, assisting in the selection of appropriate currencies and payment options for a smoother global checkout experience.
- Sales Channels: Determining which sales channels are most effective for your business enables you to concentrate your resources on the channels that generate the most sales.
- Individual Customer Trends: Tracking purchasing habits of individual customers over time opens the door to personalized marketing campaigns and loyalty programs that enhance customer satisfaction.
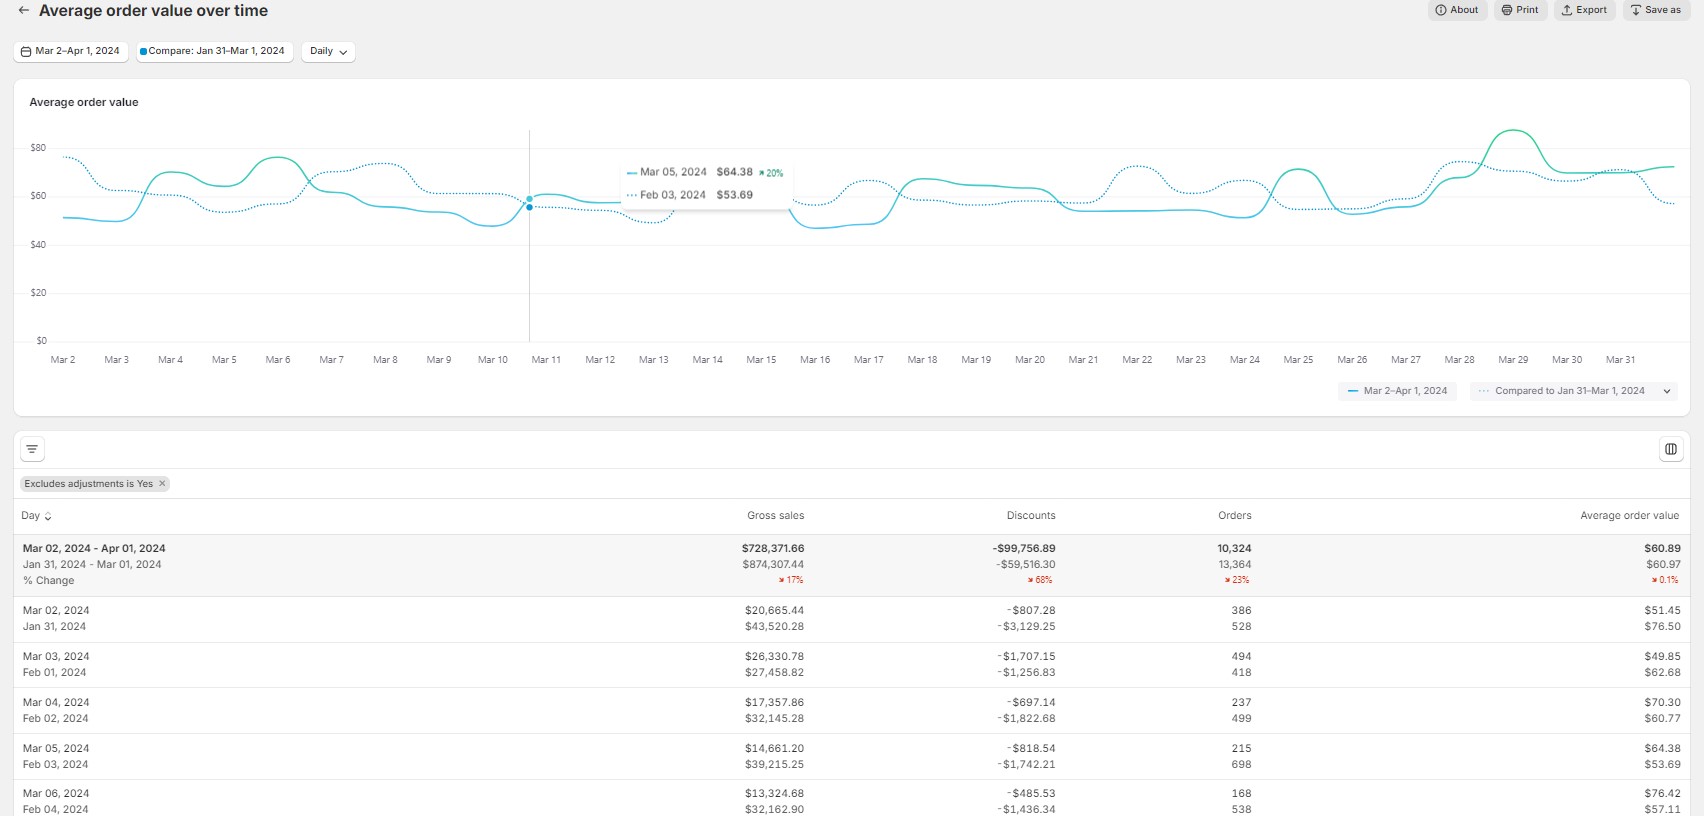
- Average Order Value: By understanding the typical spend per transaction, you can devise strategies to increase the average order value, boosting your overall profits.
How Sales Reports Can Help You?
Sales Reports are essential for optimizing business performance. They enable you to forecast customer demand, ensuring you stock the right products.
These reports also help focus marketing efforts on the channels and promotions that generate the most sales. By making inventory decisions based on actual sales data, you can more effectively manage your stock.
Additionally, adjusting pricing and promotions can encourage customers to spend more. Essentially, comprehending your sales reports provides the insight needed to make informed strategic choices, boosting revenue, satisfying customers, and enhancing store efficiency.
Bonus Content: You can read our blog post if you want to learn how to track sales with Shopify Analytics.
FAQ: Shopify Analytics Reports
Here are 10 FAQs about Shopify Analytics reports and their benefits:
1. What are Shopify Analytics Traffic and Behavior Insights? Answer: Traffic and Behavior Insights help you understand how visitors find and interact with your store. This data can be used to make your site more user-friendly and to target your marketing efforts more effectively.
2. How can Customer Analysis reports improve my business? Answer: Customer Analysis reports provide insights into who your customers are and what they want, helping you to keep them engaged and encourage repeat business by tailoring your offerings and marketing to meet their needs.
3. What information do Financial Health reports offer? Answer: Financial Health reports give you a detailed look at your store’s financial performance, including revenue, expenses, and profitability, helping you to make informed decisions to maintain or improve your financial status.
4. Why is Inventory Management important, and how can Shopify help? Answer: Effective Inventory Management ensures you have the right products available at the right time. Shopify’s inventory reports offer insights into stock levels, sales trends, and product performance, enabling better inventory decisions.
5. How do I determine the effectiveness of my marketing efforts with Shopify Analytics? Answer: Marketing Effectiveness can be assessed using Shopify’s marketing reports, which show which campaigns are driving sales and traffic, allowing you to adjust your strategies for better results.
6. What are Acquisition Reports, and how can they benefit my store? Answer: Acquisition Reports in Shopify Analytics help you understand how and from where people find your store, offering insights into visitor numbers, their origins, and geographical locations, which can guide your marketing and advertising strategies.
7. How can Behavior Reports help me improve my store? Answer: Behavior Reports provide valuable information on customer activities within your store, such as conversion rates, page load times, and product interests, helping you optimize the shopping experience and marketing strategies.
8. What insights can Customer Reports provide? Answer: Customer Reports give detailed information about your customers’ buying habits and preferences, enabling you to personalize marketing, improve customer retention, and better target new customers.
9. How do Finances Reports assist in managing my store’s finances? Answer: Finances Reports offer a comprehensive overview of your store’s financial health, tracking sales, returns, costs, and profitability, essential for informed financial planning and management.
10. Can Shopify Analytics help me manage my inventory more effectively? Answer: Yes, Shopify’s Inventory Reports provide detailed information on stock levels, sales trends, and product performance, helping you make informed decisions about stock purchasing, management, and optimization.