We have gathered all the information you need on Shopify Analytics here:
Starting from Analytics to Reports and Live, we are exploring the important sections of Shopify Analytics so you can get key insights into your ecommerce data.
Then, we are diving deep into Google Analytics, detecting & resolving data discrepancy problems, and what GA4 can provide for your Shopify business.
Get started and learn everything you need to become a data-empowered marketer or store owner.
Analytics
Shopify offers Shopify Analytics for all merchants.
It is a built-in reporting system so you don’t have to perform any custom coding or settings to have access to the rich, functional dashboards and reports.
It’s important to note that the report types and depth vary according to your Shopify plan. However, there are useful reports even in the most basic plan.
You can see a comparison of plans based on the reports on this page.
Shopify’s native Analytics feature is often confused with Google Analytics, which is a completely different tool. Please refer to the related section for more information.
Analytics Overview
Shopify Analytics is designed for Shopify merchants, not for professionals. That’s why the Analytics section provides you with the following features:
- Easy-to-view reports
- Many metrics & dimensions
- Core metrics in a card view
- Quick data comparisons
- Various graphic types
- Basic customizations
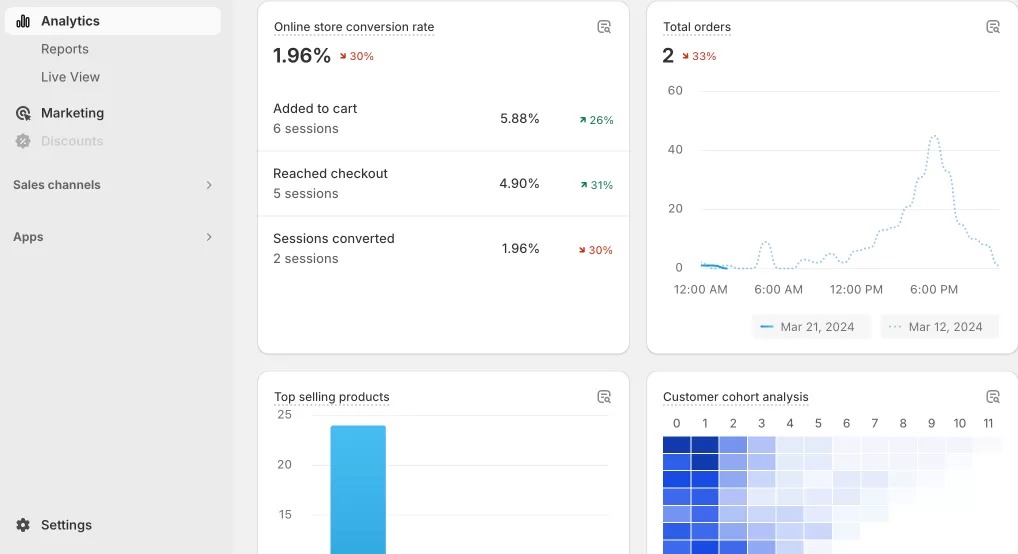
For example, the percentage in the ‘Total sales’ card (#1) presents a comparison of total sales within a time period so you can see the difference quickly.
The ‘Sales by channel’ graphic in the second card gives a comparison of the Shopify store sales (#2). You can see the changes within a period effortlessly.
The ‘Online store conversion rate’ provides you with a quick look at your conversions. For instance, you can view the change in your ‘Added to cart’ rates (#3).
‘Returning customer rate’, ‘Average order value’, and ‘Total orders ‘are some other core metrics you’d want to check often so you can better understand your data.
Apart from the main Analytics section, there is also a Reports section in case you want to dig deeper.

Actionable, Key Reports
Shopify offers a comprehensive analytics and reporting toolset to help you get insights into different aspects of your business. Each report category focuses on specific areas:
Acquisition Reports: You can use this report to understand how users land at your store and analyze the performance of different traffic sources.
Behavior Reports: You can analyze user interactions with your store through this report and develop strategies for areas that need improvement.
Customer Reports: These reports help you to analyze customer behaviors in aspects such as repeat purchases and overall engagement, aiding in understanding shopping habits.
Finances Reports: These offer details on your Shopify store’s financial performance, including sales, payments, and taxes.
Fraud Reports: They help you identify potentially fraudulent transactions, protecting your business from suspicious activities.
Inventory Reports: With these reports, you can continuously maintain control over product availability and achieve more successful inventory management.
Marketing Reports: These reports are used to analyze the impact of marketing campaigns and create new strategies.
Orders Reports: They give you details about the orders your store has received, offering insights into sales trends and customer preferences.
Profit Margin Reports: This report helps you to analyze profit margins to understand the financial health and profitability of your Shopify store.
Sales Reports: These are important reports showing the overall sales performance of your store and contain insights necessary for growth.
For reliable data analysis, Shopify Analytics reports are invaluable for gaining insights into your business’s performance.
However, remember that while Shopify Analytics offers useful metrics, it’s not as comprehensive as Google Analytics 4. Ensure you have Google Analytics 4 set up correctly for deeper insights.
Make sure you check the following sections of this post in order to make sure you have the correct setup for Google Analytics 4 and to get a better understanding of it.
Live View Insights
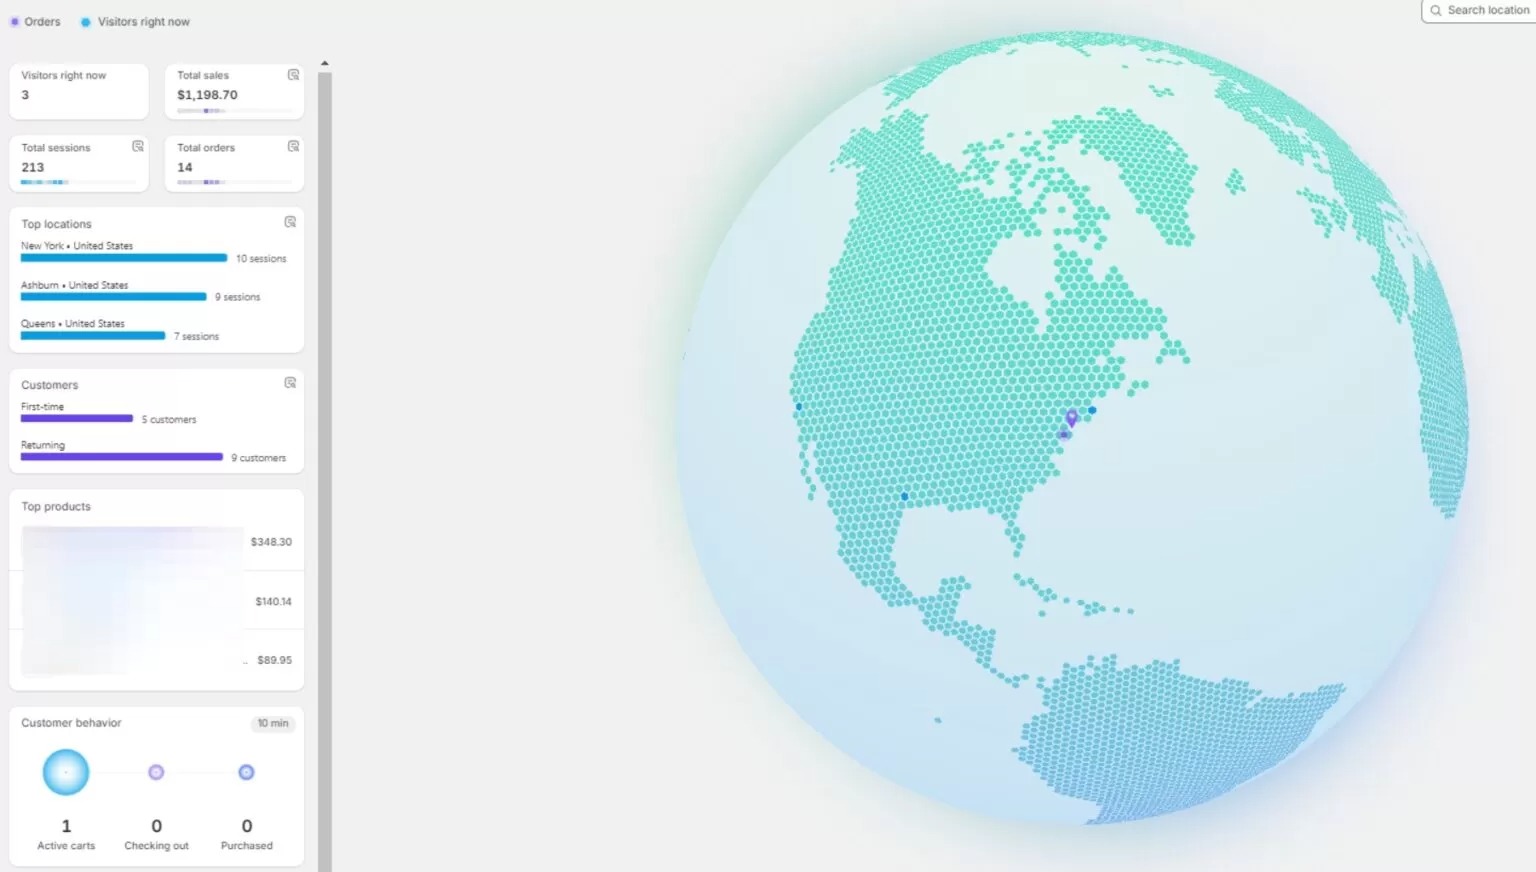
The Shopify Analytics Live View feature provides a real-time snapshot of activity on your online store. Here’s a breakdown of the components shown in the screenshot:
- Visitors Right Now: Indicates the number of active visitors on your site at the moment.
- Total Sales: Displays the total revenue generated in a given time frame.
- Total Sessions: Shows the number of individual browsing sessions on your site within the same time frame.
- Total Orders: Counts the total orders placed.
The report also details:
- Top Locations: Lists the geographic locations where the most sessions are originating from.
- Customers: Breaks down the number of new versus returning customers.
- Top Products: Highlights the best-selling products during the current period.
- Customer Behavior: Offers insights into actions taken by customers, like how many are actively checking out or have completed a purchase.
This feature is designed to give you a live overview of store performance and customer activities, enabling quick and informed decision-making.
Conversion Rate in Shopify Analytics
Most marketers and Shopify merchants are obsessed with Conversion Rate (aka CVR) metrics. Unfortunately, they evaluate it completely the wrong way most of the time.
It sounds like a simple metric: Sessions that resulted in orders / Total number of sessions.
However, it can be misleading because there are too many factors affecting this. Let’s say your CVR went 30% lower compared to last week. It sounds negative, right?
This information itself won’t help you take action because there can be too many reasons to it – and they are not necessarily negative. Some sample scenarios are:
- One of your informative blog posts started to get a lot of traffic – and your number of total sessions increased by 20%. However, it wasn’t a type of blog post that would affect the sales. It was just an informative post and it didn’t attract buyers – at least in the short term. This made your CVR to be lower than last week. Is that really something bad? Definitely not! So, you should also be checking CVR by landing page to avoid these external factors.
- You started to run 3 new Facebook Ads campaigns with 10 ad groups in total. Most likely, all the ad groups won’t perform great but you will still receive more traffic. The CVR will start going lower because of the increased traffic. This shouldn’t panic you because -maybe- 2 of the ad groups have been performing great. You better check the CVR by traffic source report instead of only CVR. You should have the correct UTM link structure on your Facebook Ads to get this report properly.
- Devices, browsers, and operating systems would also give you a meaningful breakdown of your Conversion Rate. You might have responsiveness or technical issues per device/browser/operating system. Don’t underestimate the value of CVR by Device Type or Operation System report.
- You can create customized Conversion Rate reports on Shopify Analytics quite easily.
We will create an article/video education series on Shopify Analytics Reports, soon. It will be free and published in Analyzify Hub – make sure you subscribe so you don’t miss it!
Shopify Analytics vs. Google Analytics
Both Shopify Analytics and Google Analytics have unique features and benefits.
The short answer to which one you should use is that you need to use both of these platforms to get the best out of your ecommerce tracking & reporting.
While Shopify Analytics is easy to understand and shows you the general view using the core metrics and reports, Google Analytics 4 provides more advanced reporting.
Here is a breakdown of the advantages & disadvantages of Shopify Analytics and Google Analytics:
Pros and Cons of Shopify Analytics
Pros:
- Available to all plans
- Automatic tracking
- Easy to use & view reports
- Core metrics included
- Various report types
Cons:
- Limited customization for some plans
- No cross-domain tracking
- Missing in-depth data analysis
- No custom funnels
Pros and Cons of Google Analytics
Pros:
- Custom ecommerce funnels
- Enhanced conversion tracking
- Cross-domain tracking
- In-depth ecommerce data reporting
- Advanced report customization
- All ecommerce metrics & events included
- Various report types
- Predictive insights
- Audience creation
- Enhanced measurement (site search, file downloads, etc.)
- Customizable dashboard
- User journey tracking (Google Ads integration)
- Apps for easy integration
Cons:
- A completely new interface
- Relatively difficult to navigate at times
You can find more detailed information to understand the benefits of Google Analytics 4 and integration methods for Shopify merchants in the following sections.
API
You can see the Reports API if you are a Shopify Advanced or Plus store. The Shopify Reports API doesn’t cover all the metrics available on the Analytics API.
You can use the Report resource to publish reports to the Reports page in the Shopify admin. For example, a shirt fulfillment app could publish a report that compares shirt sales by marketing campaign. The reports are based on queries written in ShopifyQL.
If you are looking for an Analytics API, you can consider Google Analytics. Google Analytics 4,in particular, comes with a great built-in BigQuery integration.
Google Analytics 4 & Shopify
Google Analytics 4 (aka GA4) is the new and default version of Google Analytics. It’s been around for almost a year now.
GA4 is the most powerful free analytics tool in the market. It covers so many enterprise-level features at no cost.
Apart from the standard reports, segmentation capabilities, custom report building features, event-based tracking, BigQuery integration are available features.
Should you use Google Analytics 4 on Shopify?
Definitely yes! It is the new and default version of Google Analytics. Google pays close attention to this product and it will keep receiving amazing updates. It already has many exciting features as explained above.
How to Set up Google Analytics 4 on Shopify?
There are several methods to set up GA4 on your Shopify store. We obviously recommend Method 2. Analyzify empowers over 2000+ stores and they have the best possible GA4 Integration and Data Analytics setup. Make sure you check out our reviews on the Shopify App store.
Method 1: Manual & Native Setup
You can set up GA4 on your Shopify by yourself. Here, you have two options. The first one is setting up GA4 through Sales Channel App (native), and the second one is completing all the settings by yourself. Still, we should warn you that you might be missing out on a lot of reports and features as you can not add code to every section of your website for every kind of event. We have created a complete guide on how to set up Google Analytics 4 on your own. Follow the links below:
Shopify Google Analytics 4 (GA4) Guidebook
Method 2: Analyzify
Analyzify offers a turnkey solution for streamlining data collection and analysis for your Shopify store, with:
Advanced GA4 Reports: You get over 20 ecommerce reports and important information about customer behavior, such as View Item List, Select Item, View Cart, Remove from Cart, and Add Shipping Info.
10+ integrations: Start integrating your Shopify stores with the most important tools such as Google Tag Manager, Google Analytics 4, Google Ads, and more. Collect accurate data for better analyses.
No Need for Tech Skills: Managing marketing tools is super easy with Analyzify. You don’t have to know how to code or change your website’s design, so you can spend more time on your business.
Real-time & Daily Troubleshooter: You can benefit from Analyzify’s troubleshooting capabilities to detect any issues and fix with expert support.
Expert Support for Free: The Analyzify team is full of experts ready to solve problems, check your setup, and clean things up without extra cost. You get an expert-level audit, setup, and analysis for Google Ads pixels, including conversion tracking and dynamic remarketing.
Unlock All GA4 Ecommerce Reports. Integrate and Learn with Analyzify.
Install the App
Method 3: Other Shopify Analytics Apps
Make sure to check other Google Analytics apps for Shopify on the app store. We recommend you consider the following factors while evaluating:
- Do you want to pay an ongoing subscription fee for Google Analytics while you have the native integration or one-time-fee options like Analyzify?
- What will the app provide you as an addition to the native integration?
- Will it be easy to set up and use? Does the app offer a setup option if you are not a tech-savvy Shopify merchant? Does it have an extra cost?
- Will the app ensure that your setup is done correctly and data flows seamlessly?
The Most Important Google Analytics 4 Reports for Shopify Merchants
Now we can assume that you have done and verified your Google Analytics setup, you can jump into the following sections to learn more about Google Analytics reports and common Analytics issues for Shopify merchants.
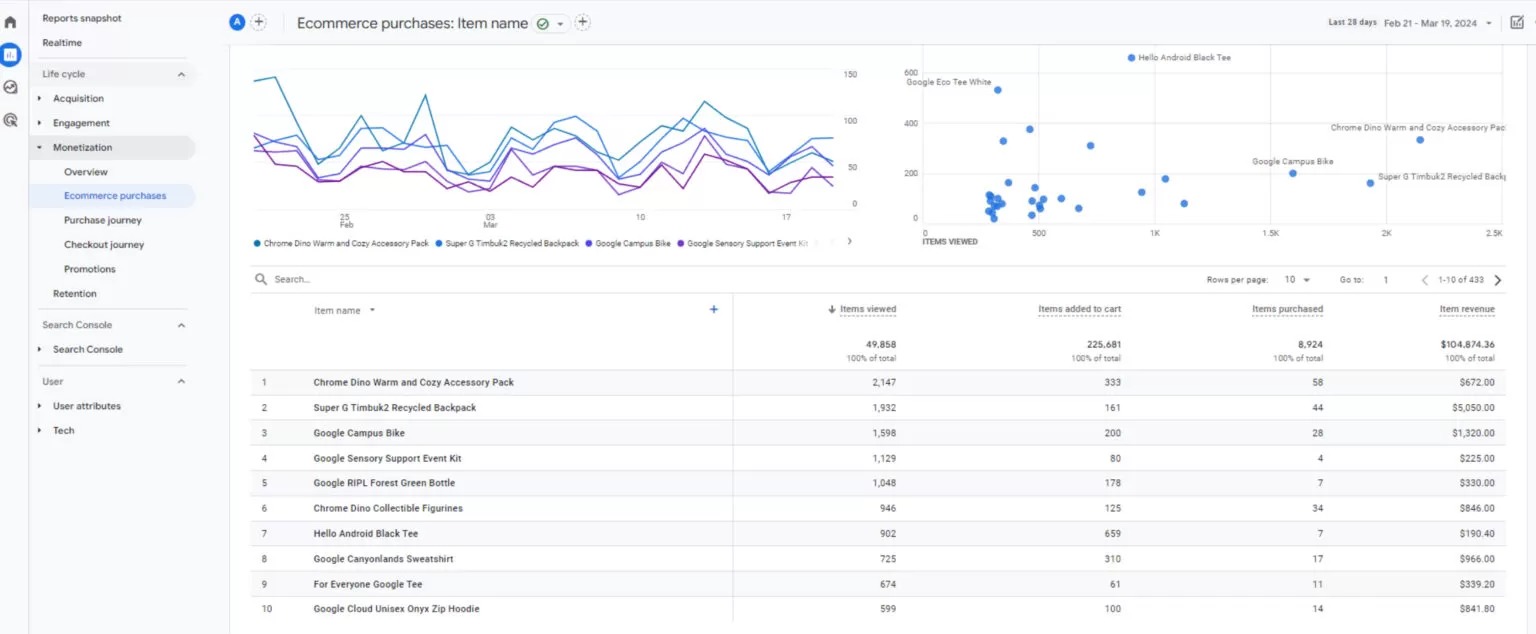
Product & Category & Brand Performance Reports
In GA4’s Ecommerce purchases report, you can evaluate the product performance by analyzing key metrics like views, add-to-carts, and purchase rates.
Detailed revenue data and purchase-to-view rates for each item reveal their sales effectiveness.
Category insights show which product lines excel and generate the most revenue, helping in strategizing for inventory and marketing focus.
Similarly, brand analysis uncovers which brands in your catalog are outperforming others in terms of attracting traffic and generating revenue, allowing you to adjust your brand strategies effectively.
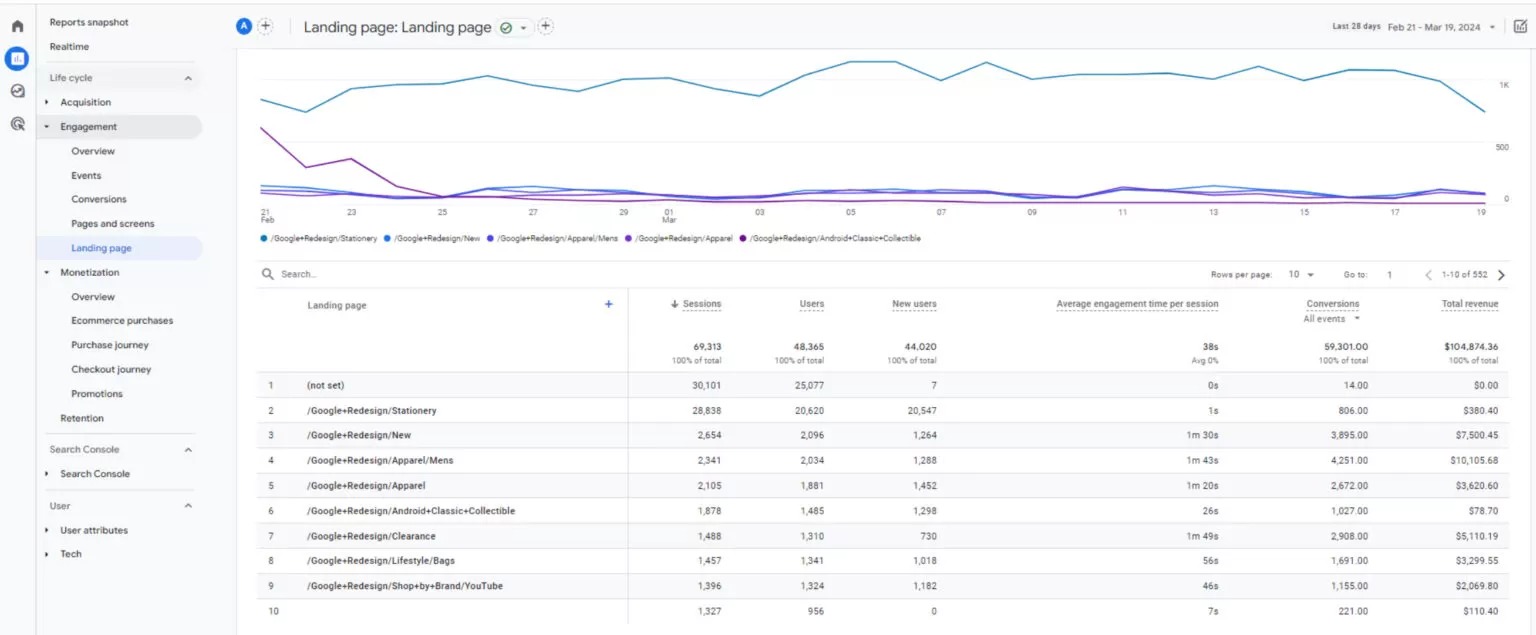
Engagement and Landing Page Reports
Engagement and Landing Page Reports provide a clear view of user interaction and page effectiveness.
These insights allow you to pinpoint which pages pull in visitors and drive revenue, and which ones don’t, revealing areas for optimization.
They’re especially useful for refining less detailed campaign data, like Performance Max, by identifying which campaigns generate clicks but no sales.
Utilizing these insights to adjust your campaigns and landing pages will enhance performance. Moreover, applying this knowledge across different reports sharpens your overall online strategy.
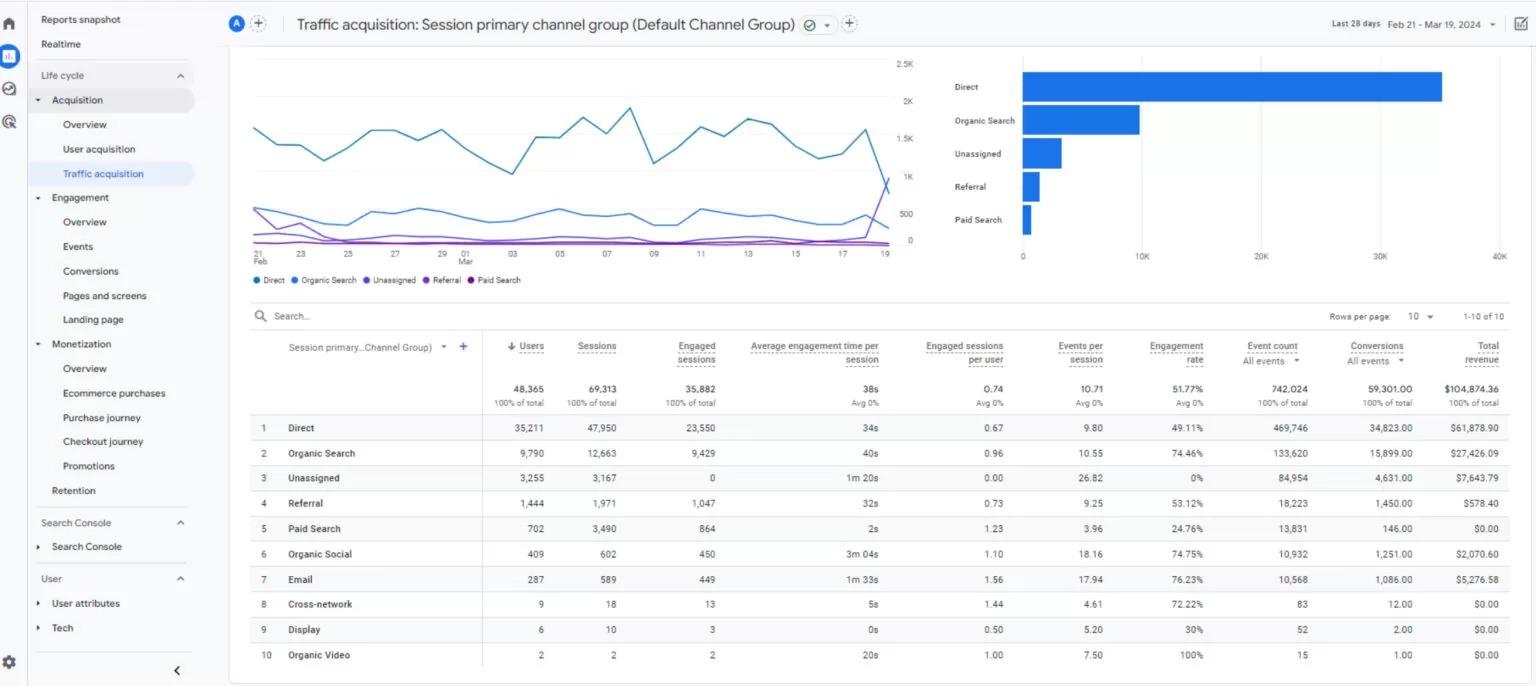
Traffic Acquisition Reports
GA4’s Traffic Acquisition Reports are crucial for refining your marketing strategy, helping you identify the most effective channels for attracting visitors and where to allocate your advertising budget.
They offer insights into how visitors interact with your Shopify pages, guiding you on areas for improvement.
You can use this information to improve strategies for underperforming channels and overall user experience. Proper use of these reports leads to better engagement and increased revenue growth.
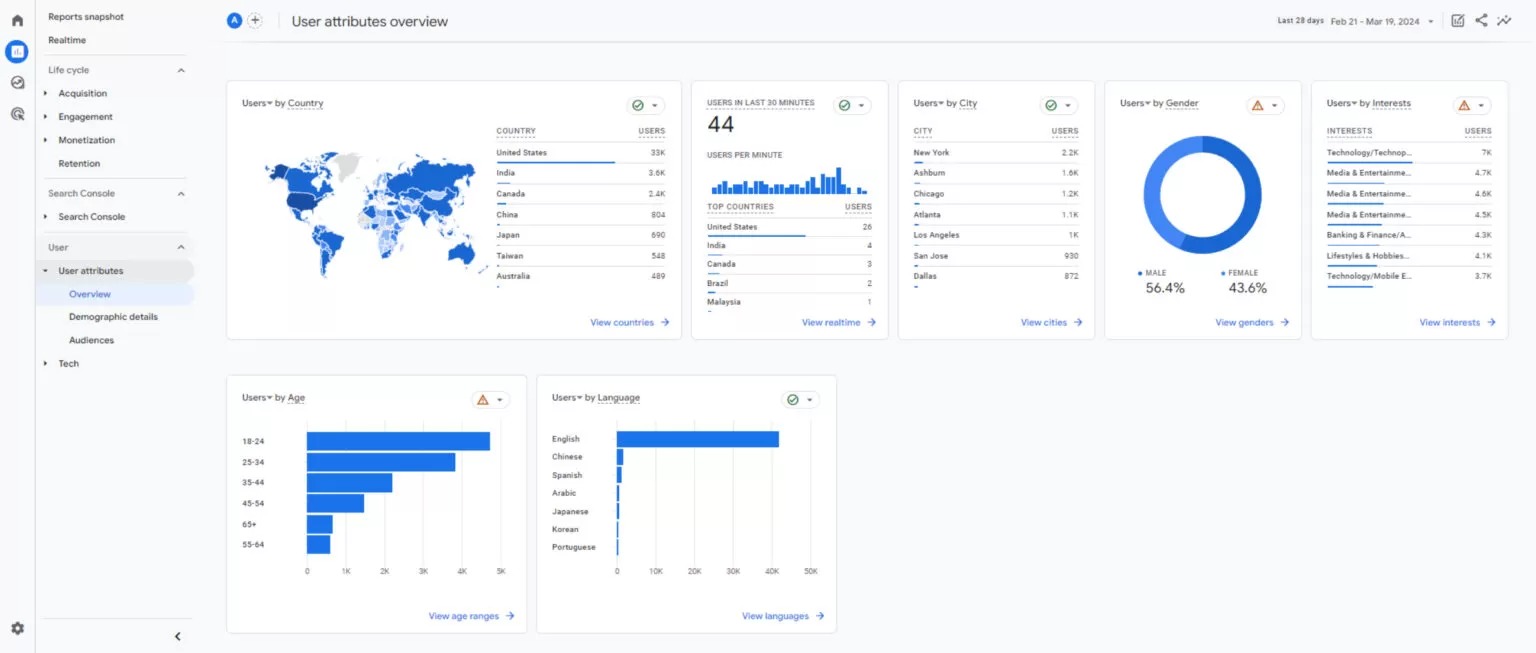
User Attributes Reports
GA4’s User Attributes Reports offer insights into your audience’s demographics like location and age, key for understanding user profiles.
Attributes such as city and gender are crucial, with clickable options for more depth.
You can apply filters for a focused analysis on aspects like city-based conversion rates, helping pinpoint where to invest your marketing budget for optimal ROI.
This approach is particularly effective for refining paid campaign strategies and reallocating resources towards more lucrative areas.
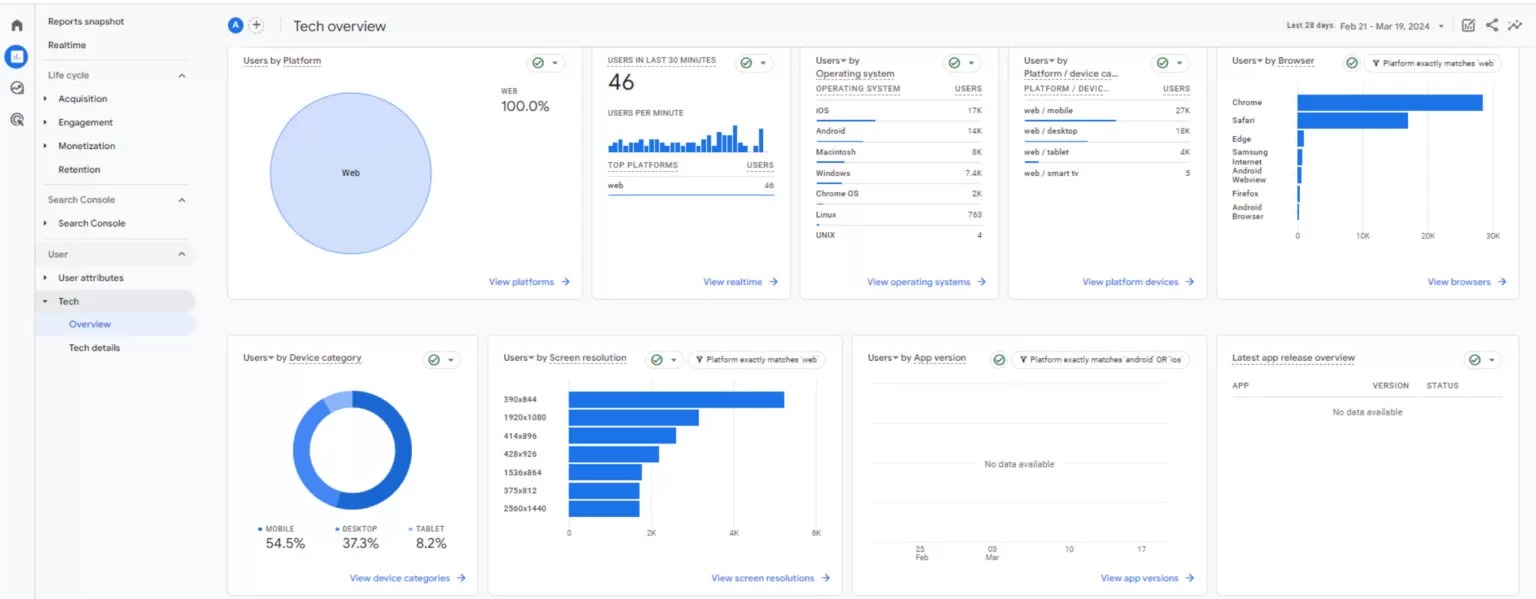
Health Check Reports
GA4’s Health Check Reports act as a crucial diagnostic for understanding how different technologies impact user interaction on your site or app.
The “Tech Overview” reveals critical data on mobile, desktop, and tablet use, shedding light on device-specific engagement.
For example, lesser engagement from tablet users might indicate UI/UX challenges, requiring a review.
Covering screen resolutions, platforms, and browsers, these reports highlight areas affecting user experience. Should any technology show underperformance, such as a browser leading to lower engagement, it’s a cue to find & solve potential issues.
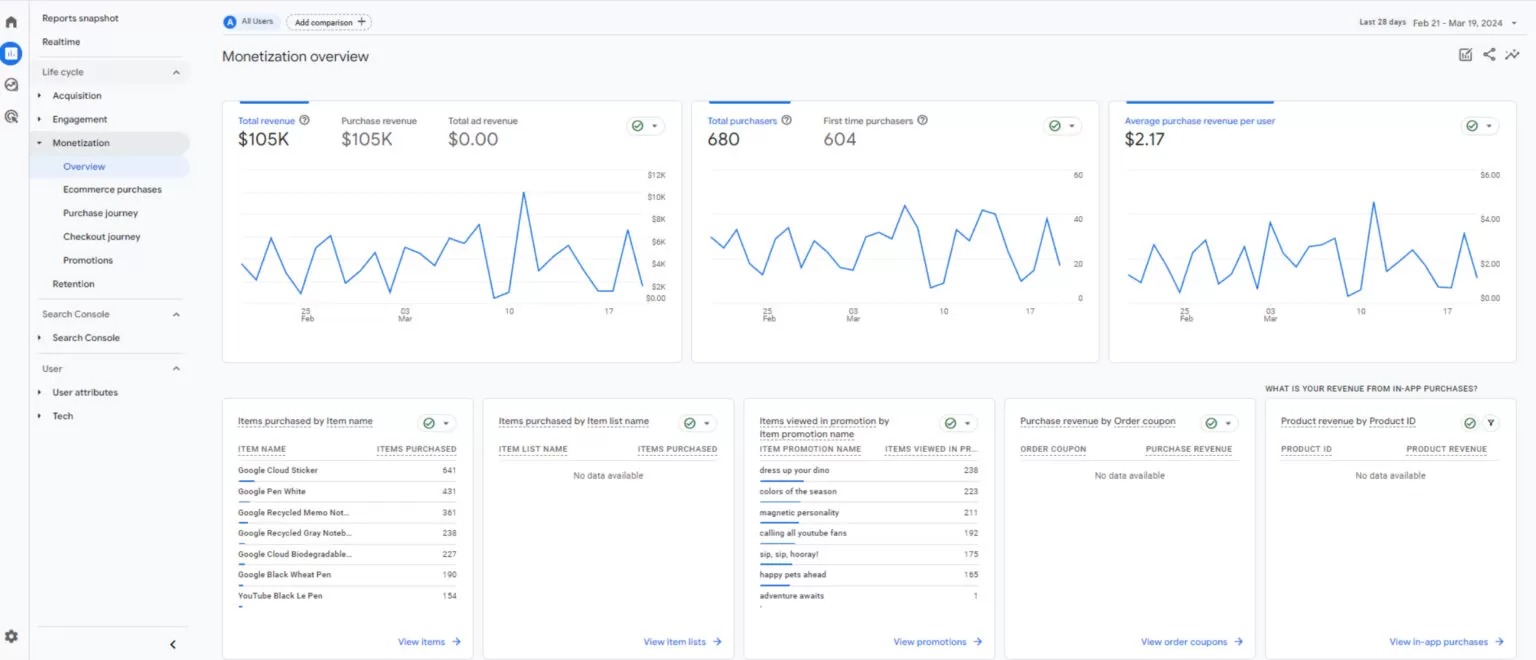
Monetization Reports
GA4’s Monetization reports give a detailed overview of your revenue streams, including transaction details and ad effectiveness.
They’re key for evaluating financial health and optimizing your monetization approach. The reports track sales patterns, first-time purchases, and user revenue, allowing customization for focused analysis.
Especially for Shopify merchants using coupons, this analysis is crucial. It delves into coupon impact on sales, providing clarity on their success and guiding smarter promotional planning.
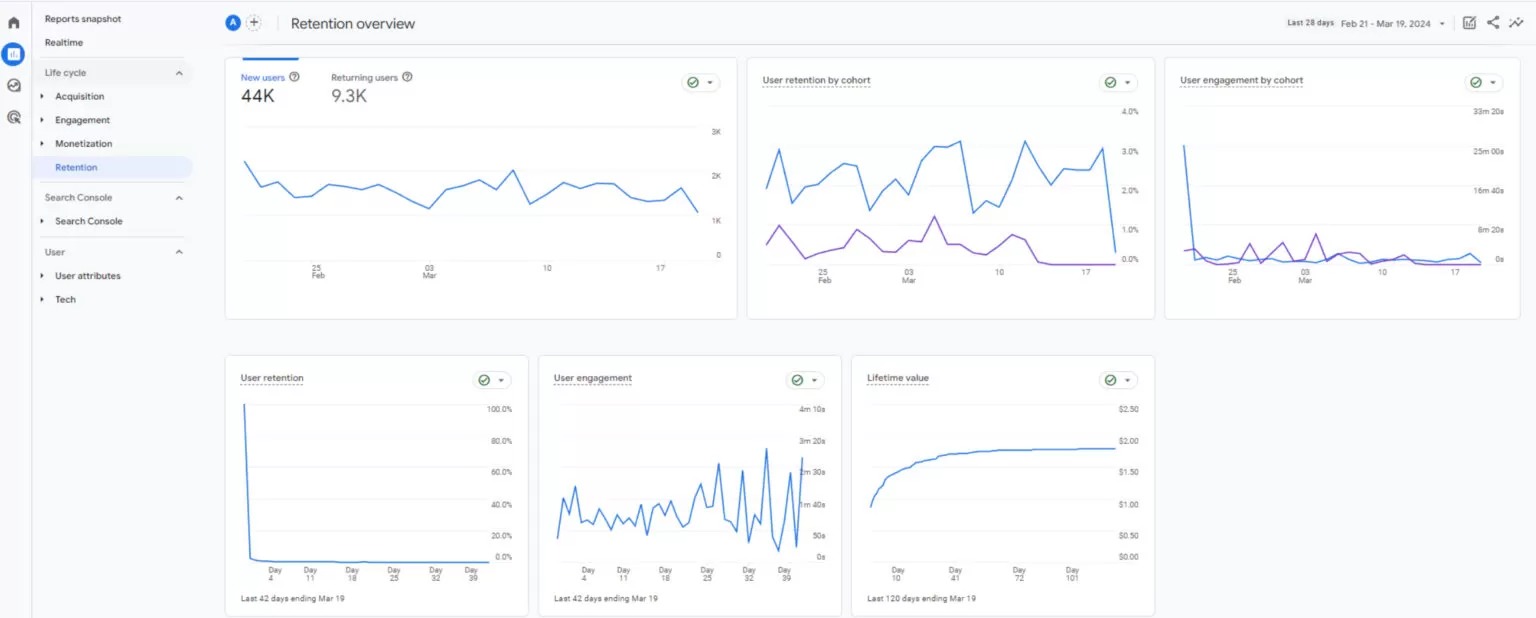
Retention & Lifetime Value Reports
Retention and Lifetime Value Reports in GA4 are important for understanding your customers’ long-term value and engagement trends.
These reports reveal how frequently and for how long users interact with your Shopify store, offering a window into their behavior and engagement levels.
By using this data, you can analyze the long-term profitability of your customer base, guiding strategic decisions to foster growth and enhance the lifetime value of your customers.
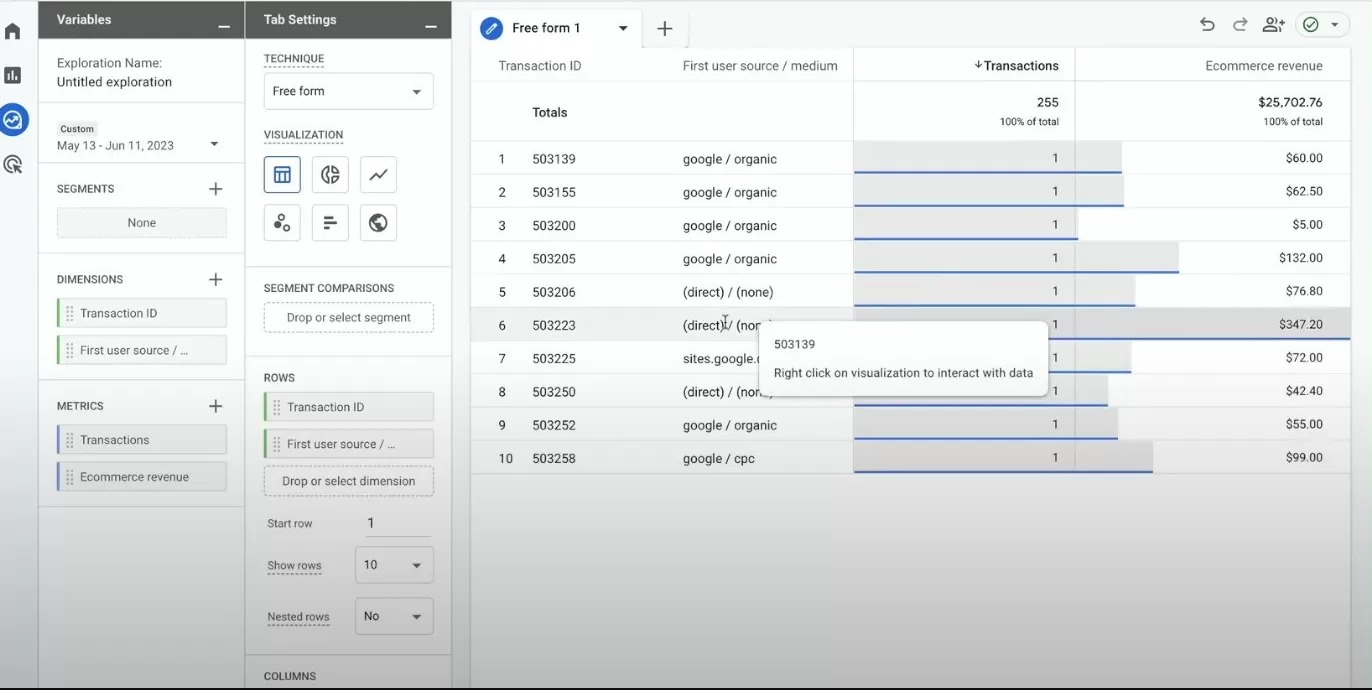
Custom Reports (Exploration)
GA4’s custom reports offer a tailored approach to data analysis, letting you see details relevant to your Shopify store.
Through the Explore section’s flexibility, you can enrich reports with filters, segments, and comparisons.
This adaptability means you can craft tables, charts, and dashboards that align precisely with your needs, starting from a blank canvas to fully personalize your data exploration.
Common Google Analytics 4 Issues for Shopify Stores
Data Discrepancy
It should be annoying when you don’t see all your sales or traffic on Google Analytics. There are a number of reasons for this issue and you can check the our following article for this: Discrepancy Between Google Analytics & Shopify
Too much direct traffic
It doesn’t seem natural, does it? It’s hard to imagine a website having 20%+ direct traffic. More than that usually refers to a problem. Make sure to check out An Overview of Direct Traffic in GA4 and Methods for Optimization
Unwanted referrals
Referrals are good – but we all know that Stripe or PayPal can not be a correct referral. It is just a payment provider and Analytics can not recognize it because of the missing setup. The worst part of this is that it overwrites the actual traffic source. So you don’t really know where the traffic is coming from.
Here is the solution, along with other important settings: The 8 Most Important GA4 Settings You Need to Know
Conclusion
Want to learn more about Shopify data analytics and marketing topics?
For more Shopify-related informative content, you can check out Analyzify Hub! We are creating valuable, actionable, up-to-date Data-Analytics & Marketing focused articles for Shopify Merchants and marketers.
Make sure to check it out and subscribe.


