
US-Canada trade statistics highlight the scale of economic integration now affected by the February 2025 announcement of sweeping US tariffs on Canadian imports, marking a significant shift in North America’s largest bilateral trading relationship.
Key Takeaways:
- A 25% tariff on Canadian goods and 10% tariff on energy exports will take effect February 4, 2025
- Bank of Canada projects these tariffs could reduce Canada’s GDP by 2.6% and US GDP by 1.6%
- Canadian households face potential annual costs of $1,900, while US families could lose $1,300 per year
- The manufacturing heartland faces particular exposure, with Ontario alone supporting 675,000 direct export-related jobs
- US gasoline prices could rise by $0.30-0.70 per gallon due to the energy tariff
Current US-Canada trade reflects deep economic interdependence as both nations prepare for the most significant change in their trading relationship since USMCA’s implementation in 2020.
The US administration has announced two major tariff measures:
- A broad 25% tariff on Canadian goods imported into the US
- A specific 10% tariff targeting energy exports from Canada
Both measures are set to take effect on February 4, 2025, giving businesses and markets minimal time to adjust to these dramatic changes. The speed of implementation has raised concerns about the potential for significant supply chain disruptions across both nations.
Bonus: Curious about US ecommerce power and trends? Explore our detailed page for key statistics and insights!
How Has Canada Responded to the New Tariffs?

Canada’s response to the US tariffs has been swift and strategically targeted. The Canadian government has developed a two-phase countermeasure approach designed to apply maximum pressure for tariff removal while protecting Canadian economic interests.
The first phase of Canada’s response includes immediate counteracting tariffs:
- 25% tariffs on $30 billion worth of US goods
- Implementation matching the US timeline of February 4, 2025
These initial tariffs target consumer goods and industrial products, including orange juice, peanut butter, wine, spirits, and beer, as well as appliances and pulp and paper products to apply pressure across diverse US industries.
The second phase of Canada’s response is even more substantial:
- Planned tariffs on an additional $125 billion in US imports
- Subject to a 21-day public comment period
This second round targets critical sectors of the US economy, including the automotive industry, agriculture, and heavy industry, strategically selecting products such as passenger vehicles, steel, aluminum, and agricultural goods to maximize pressure on key US voting districts.
What Trade Agreements Currently Govern US-Canada Trade?
The implementation of these tariffs comes against the backdrop of the United States-Mexico-Canada Agreement (USMCA), which has governed North American trade since 2020.
This situation creates a complex legal and economic environment as both nations navigate new tariffs within the framework of existing trade agreements.
The USMCA, which replaced the 26-year-old NAFTA framework, is scheduled for its first major review in 2026.
The timing of these tariffs, coming just before this scheduled review, adds another layer of complexity to an already challenging situation.
How Large is US-Canada Trade in 2025?
The relationship between these two nations represents one of the world’s largest bilateral trading partnerships, with implications that extend far beyond North America.
What is the Current Trade Volume?
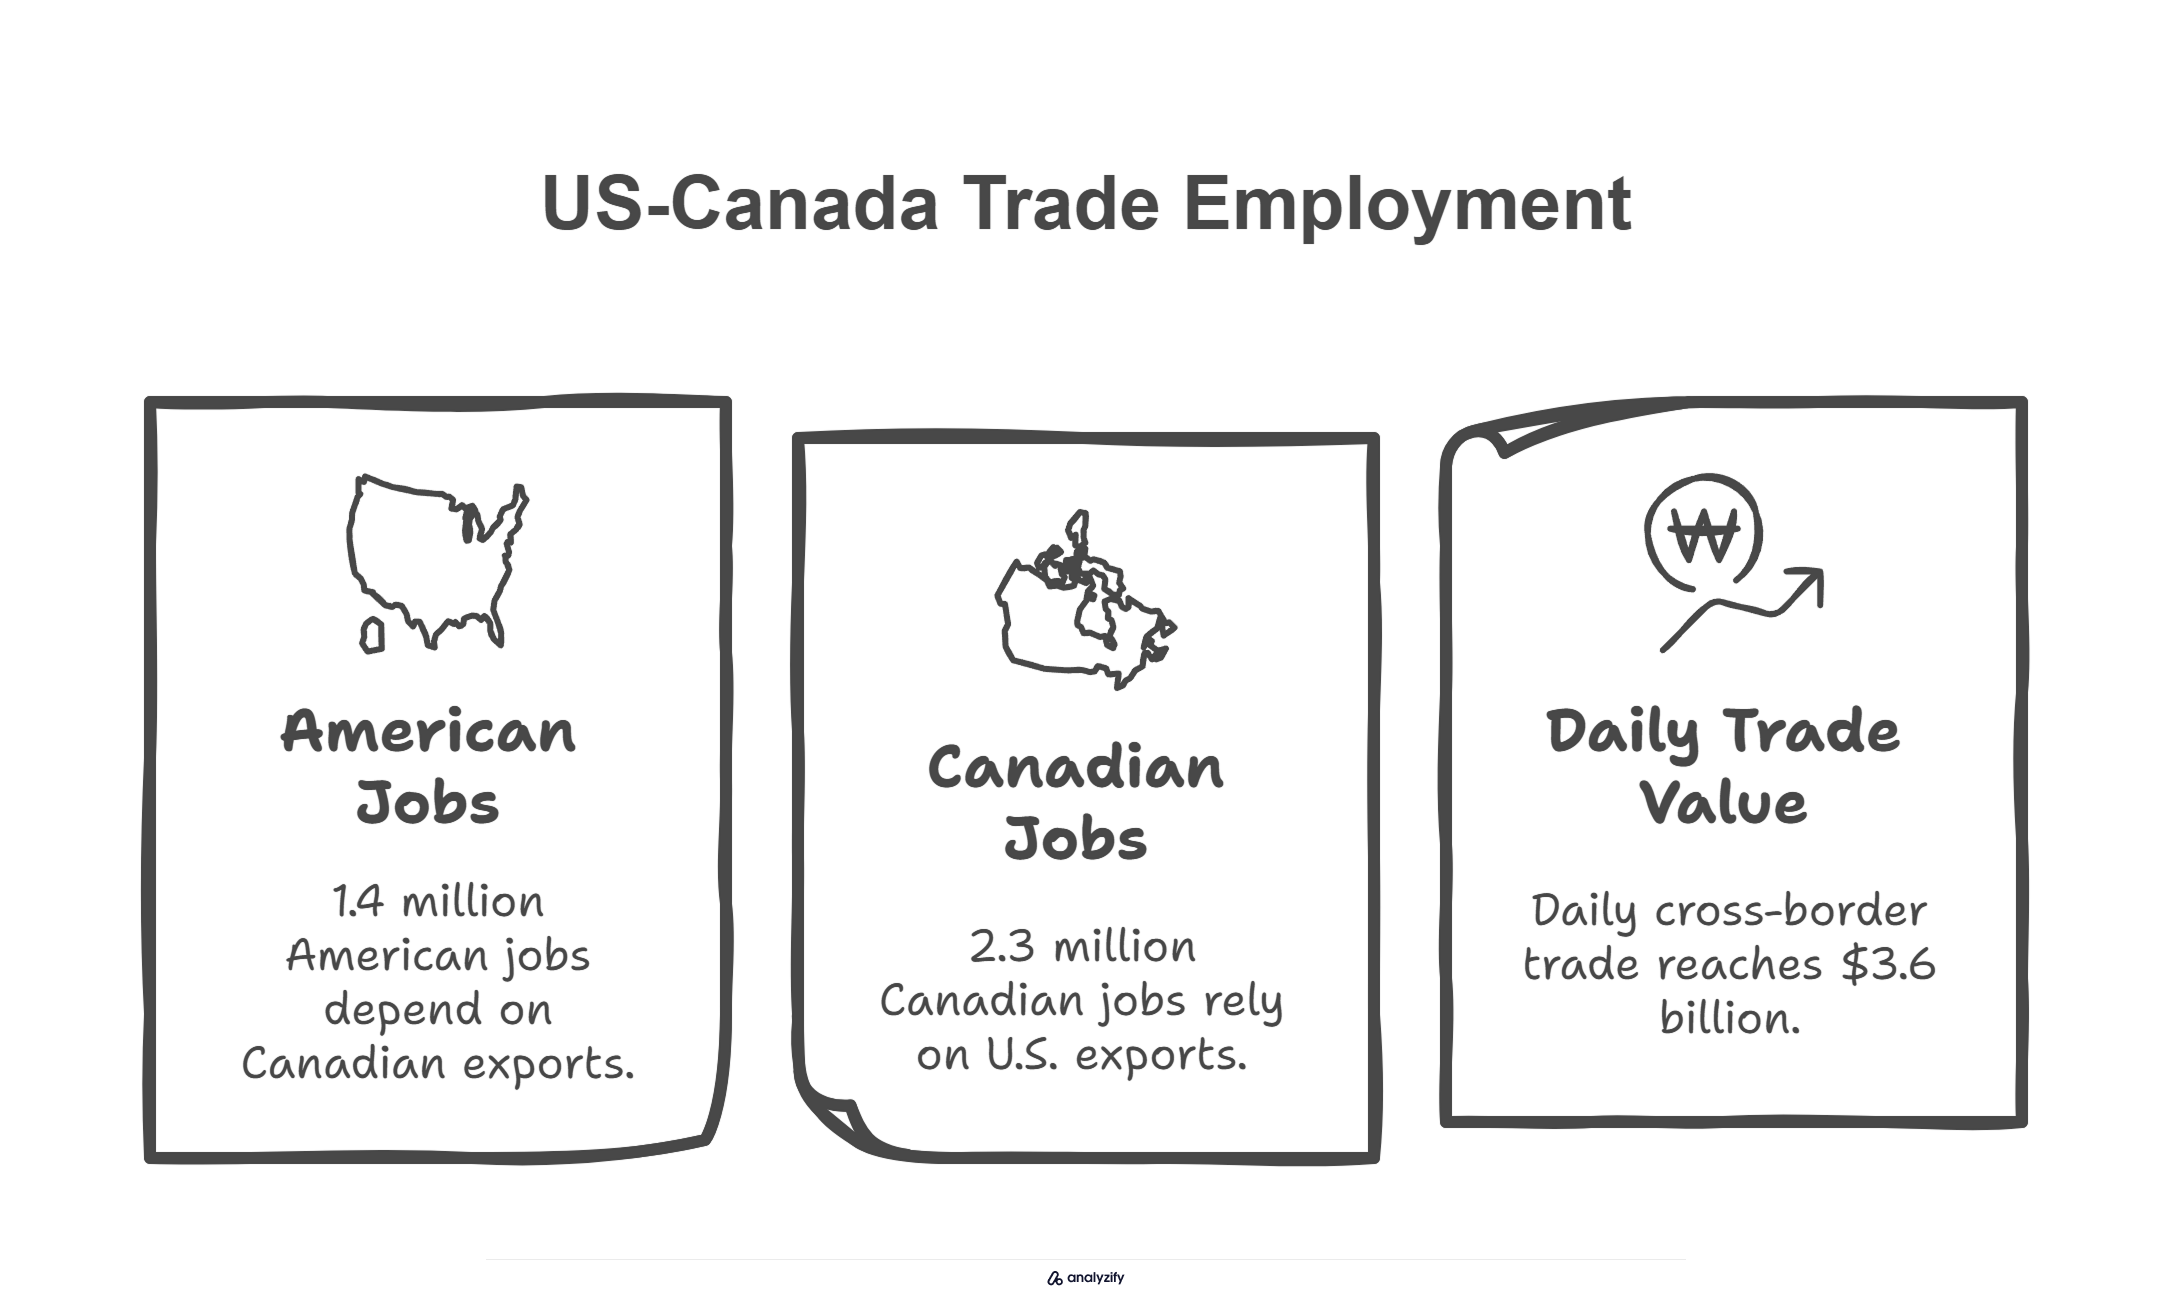
The scale of US-Canada trade reflects deep supply chain integration, with 50% of bilateral goods moving between related companies across the border. This integration creates substantial employment in both nations:
- 1.4 million American jobs depend on Canadian exports
- 2.3 million Canadian jobs rely on U.S. exports
- Daily cross-border trade reaches $3.6 billion in goods and services
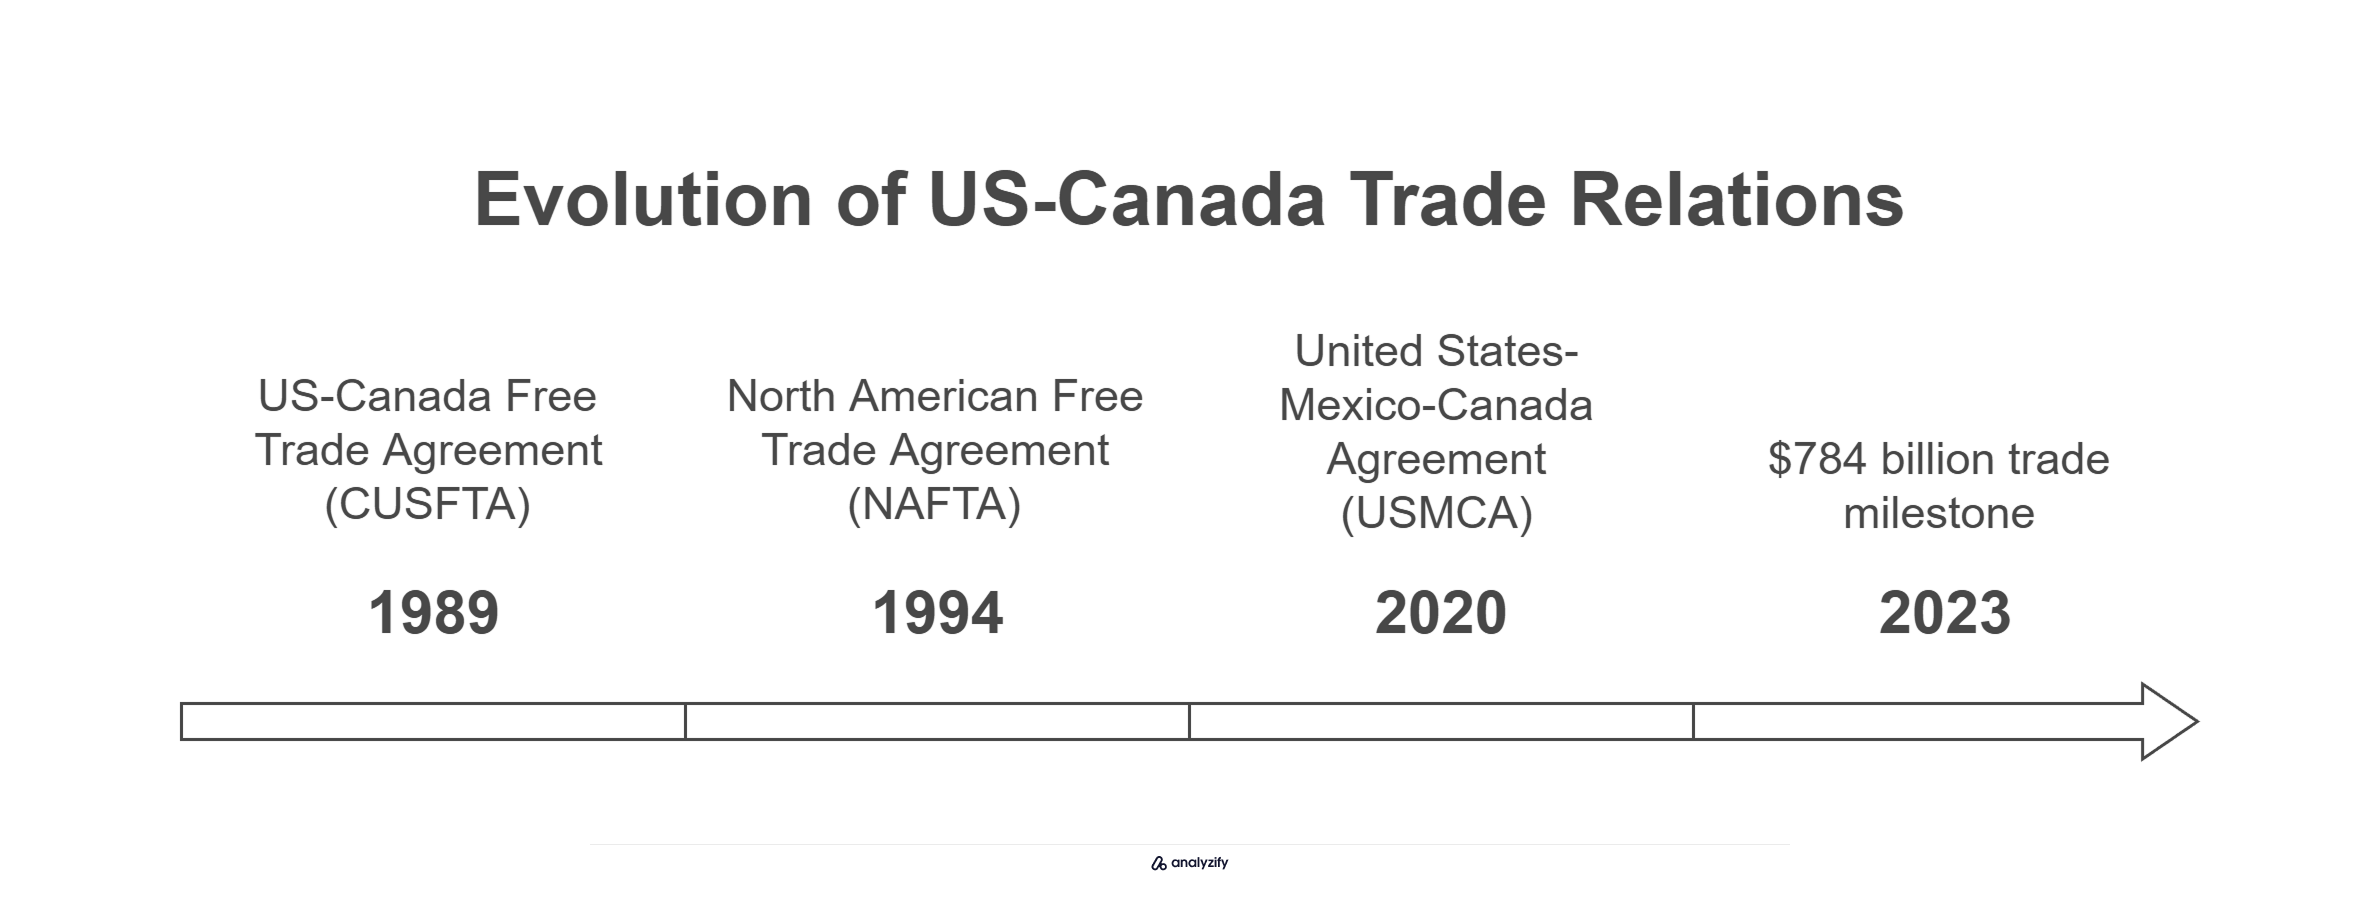
The relationship has grown through three major trade agreements:
- 1989: US-Canada Free Trade Agreement (CUSFTA)
- 1994: North American Free Trade Agreement (NAFTA)
- 2020: United States-Mexico-Canada Agreement (USMCA)
In 2023, total trade between the nations reached $784 billion, with Canada serving as the #1 export market for 34 U.S. states.
Who Has the Trade Surplus?
The trade balance between the United States and Canada presents a nuanced picture that challenges simplistic narratives. For the first eleven months of 2024:
The trade figures show:
- US exports to Canada reached $322.2 billion
- US imports from Canada totaled $377.2 billion
- This resulted in a US goods trade deficit of $55 billion
However, when energy trade is excluded, the US actually maintains a trade surplus of approximately $63 billion, highlighting the importance of energy in shaping trade figures.
How Dependent Are Both Countries on This Trade?
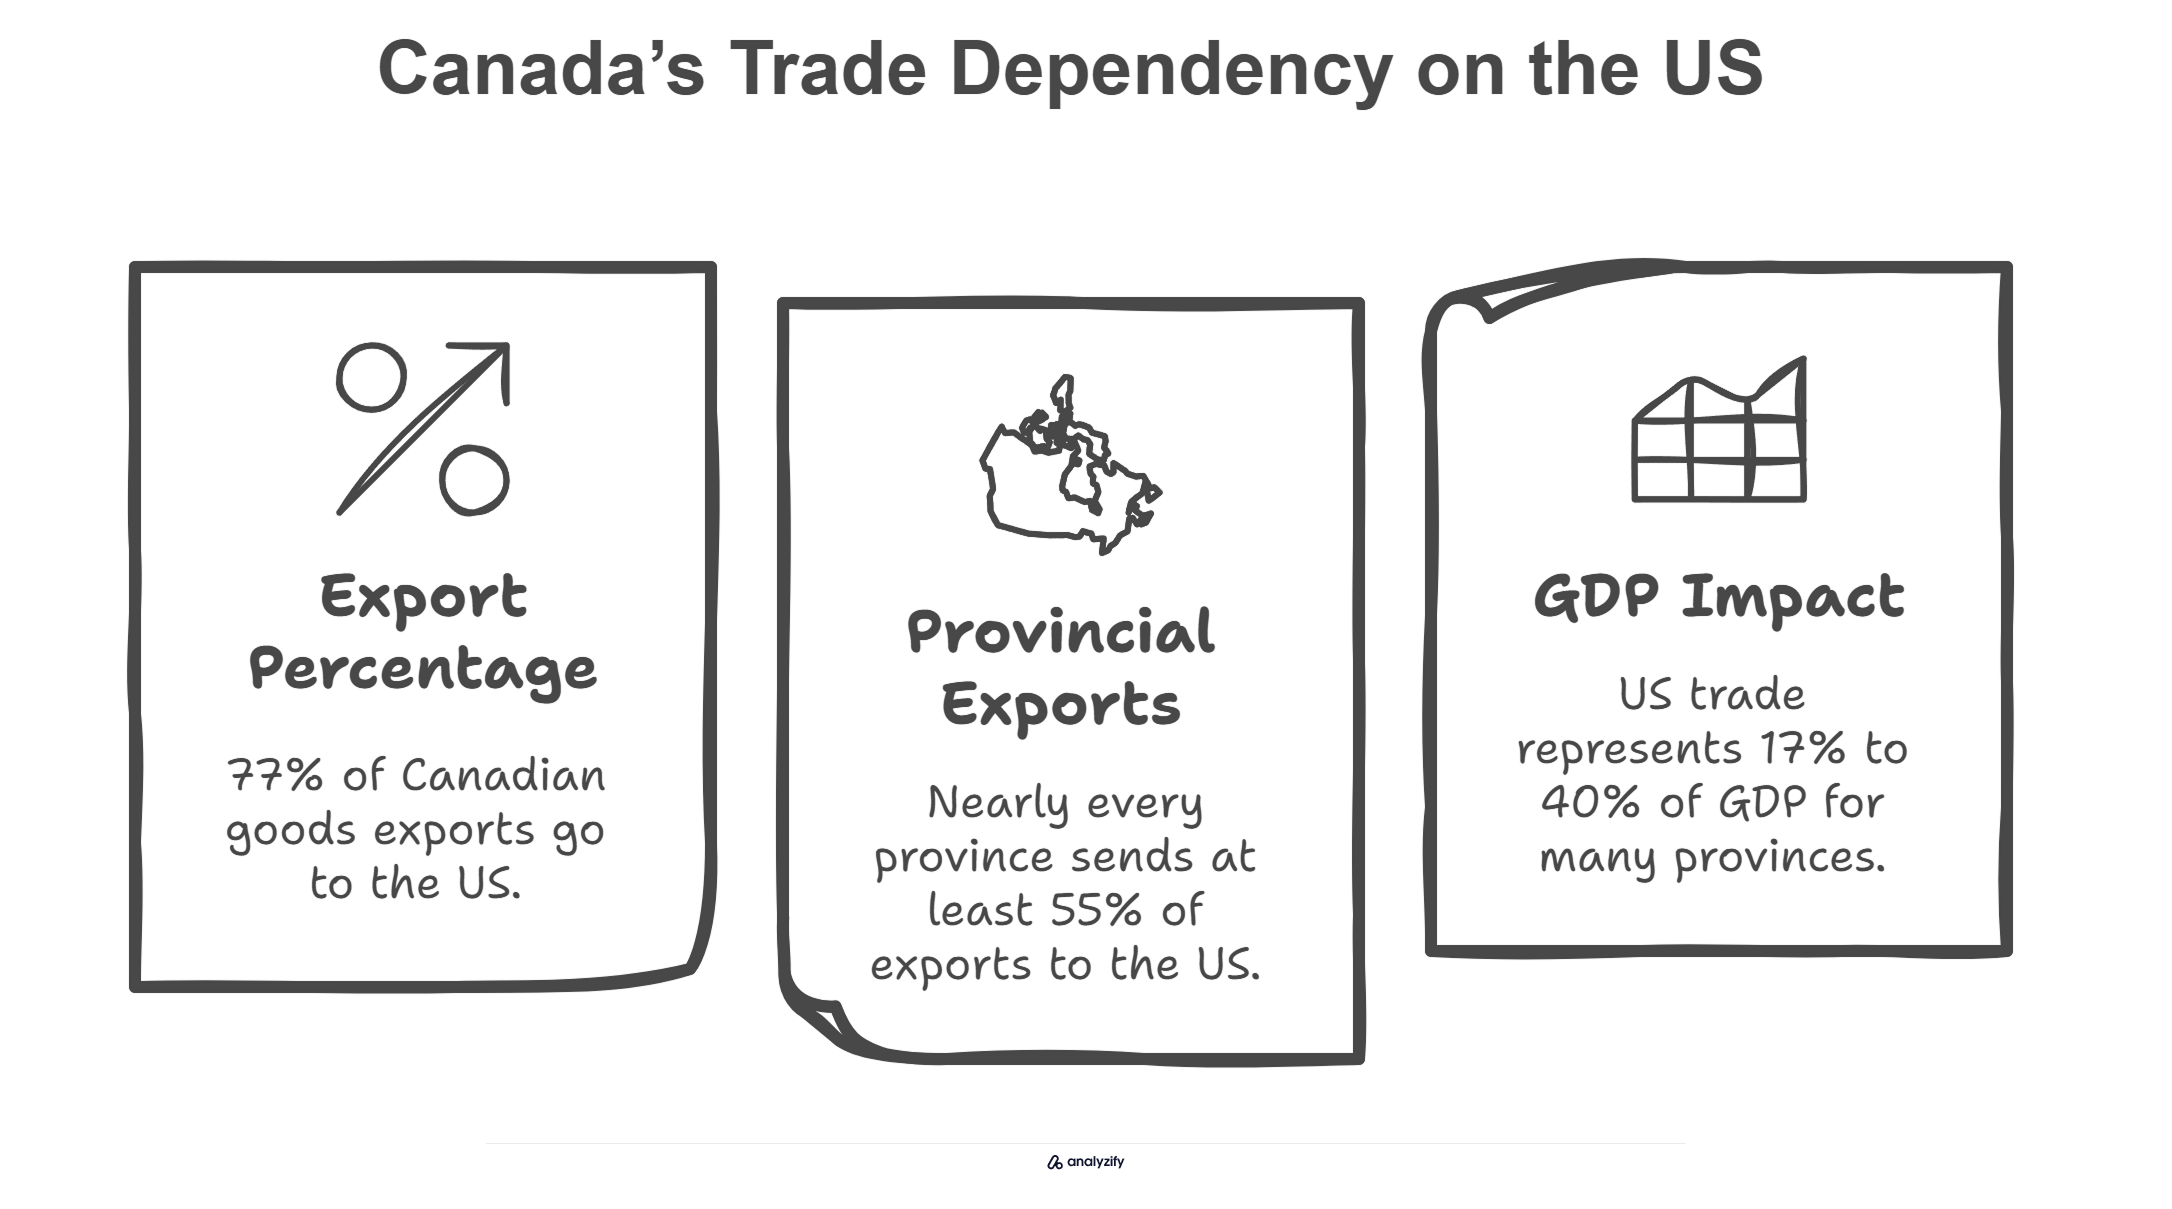
The trade relationship between the US and Canada reveals an asymmetric dependency that could significantly influence how both nations respond to the current tariff situation. Canada shows a particularly high degree of dependence on US markets:
- 77% of Canadian goods exports go to the US
- Nearly every Canadian province sends at least 55% of their exports to the US, with only Newfoundland and Labrador falling below this threshold
- For many Canadian provinces, US trade represents between 17% and 40% of their GDP
The United States, while less dependent overall, still maintains significant trade links with Canada:
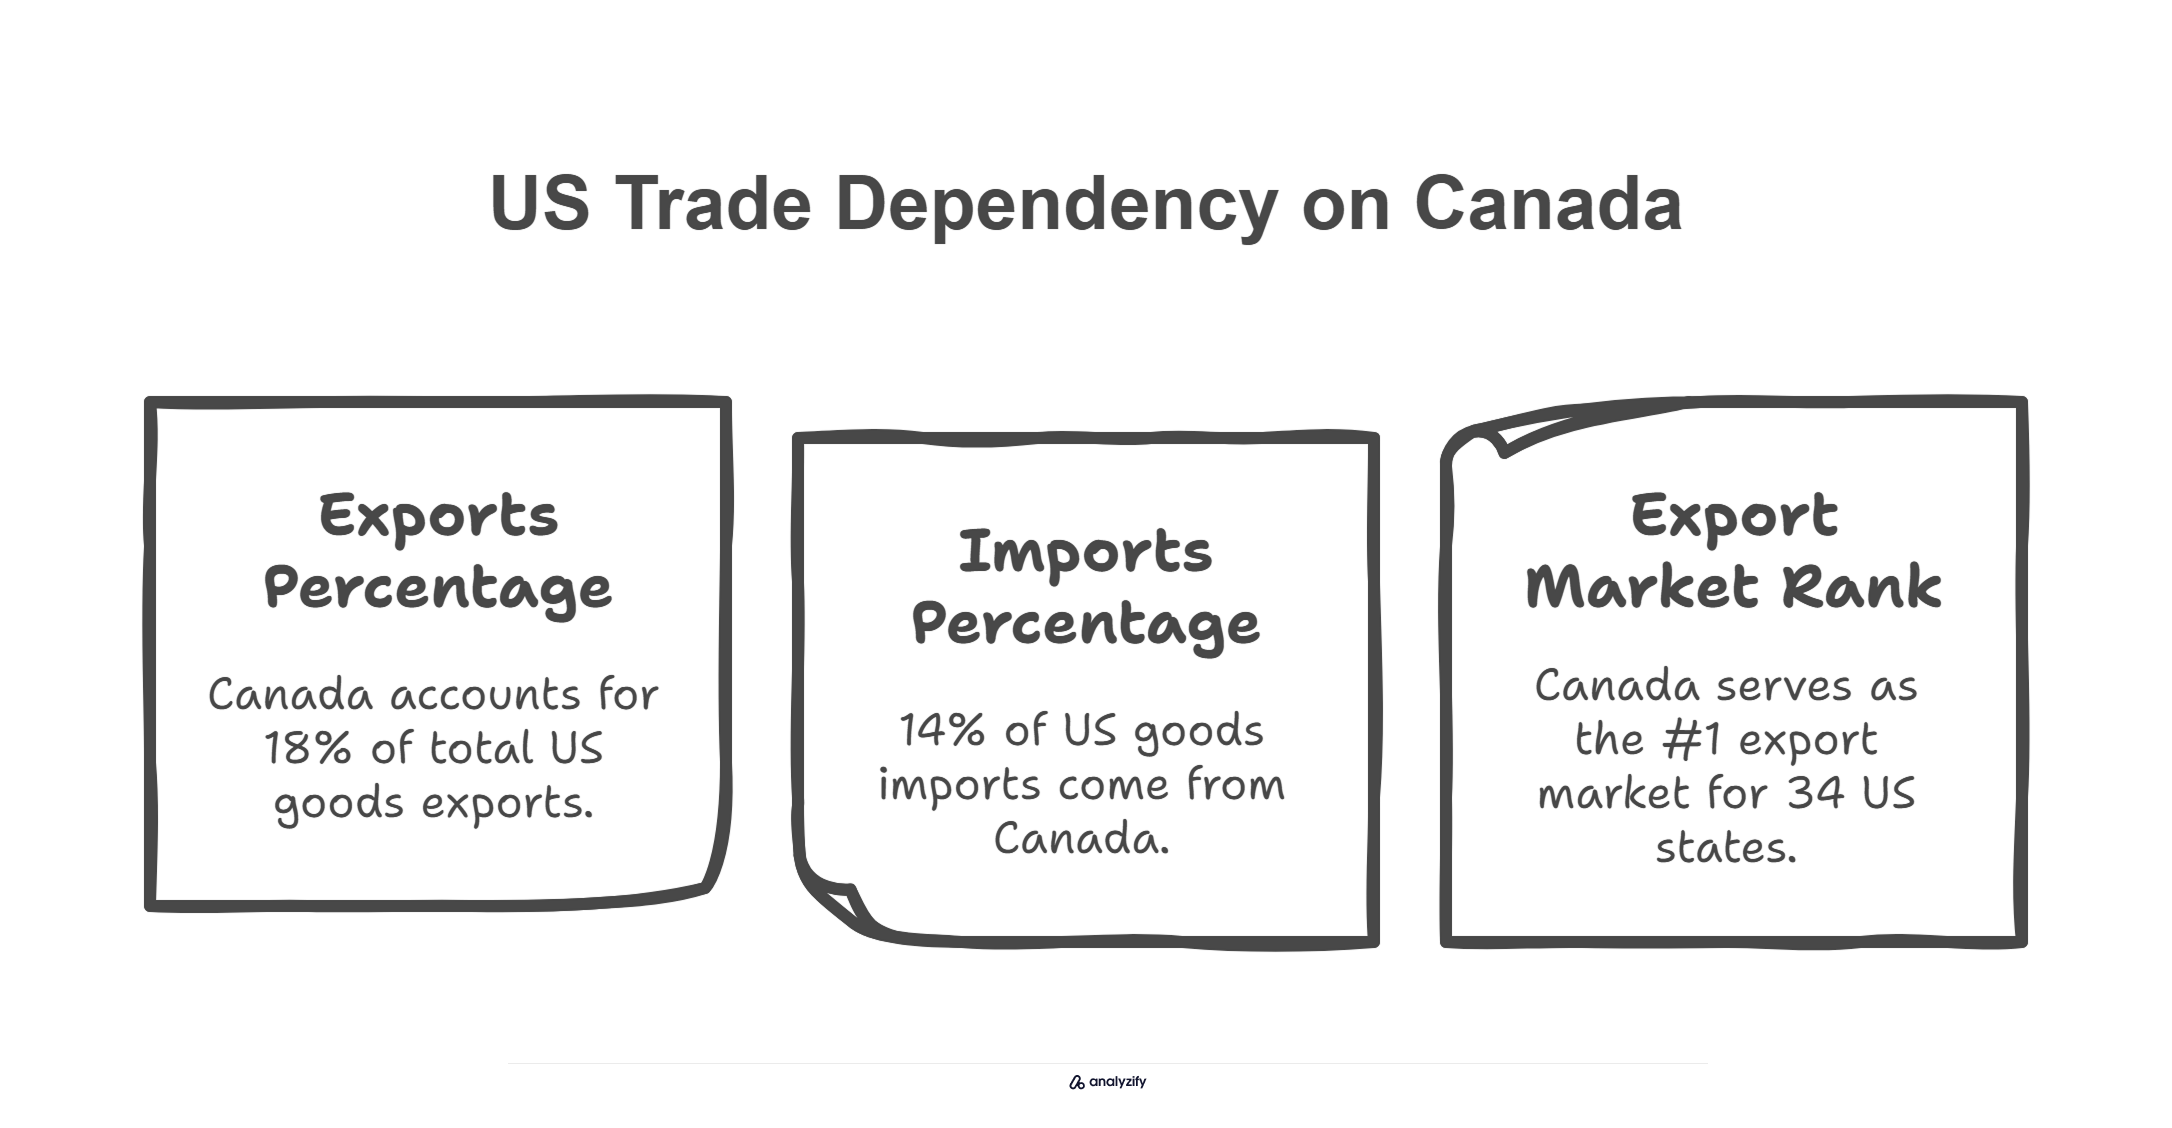
- Canada accounts for 18% of total US goods exports
- 14% of US goods imports come from Canada
- Canada serves as the #1 export market for 34 US states
What is the Scale of Cross-Border Investment?
Beyond trade in goods and services, the US-Canada economic relationship is strengthened by substantial cross-border investment flows. Recent figures show:
The investment relationship stands at:
- Canadian FDI in the United States: $671.7 billion
- US FDI in Canada: C$618.2 billion (approximately $455 billion)
Notably, in 2023, Canadian investment into the US ($101 billion CAD) actually exceeded US investment into Canada ($39 billion CAD), demonstrating the deep financial integration between these economies.
What Products Drive US-Canada Trade in 2025?
Recent trade data reveals the complex web of products and supply chains connecting the US and Canadian economies. The 2023 trade figures show US imports from Canada reached $431.19 billion, while the relationship continues to evolve across multiple sectors.
Which Products Does the US Import Most from Canada?
Energy dominates US imports from Canada, with mineral fuels and oils leading at $131.90 billion. This trade is particularly crucial for US energy security, as Canada now supplies 60% of US crude oil imports, delivering over 4 million barrels per day.
This marks a significant increase from just a decade ago, when Canada provided only 33% of US oil imports in 2013.
The top three non-energy imports from Canada include:
- Vehicles and Parts: $56.35 billion
- Nuclear Reactors and Machinery: $31.85 billion
- Plastics and Articles: $13.67 billion
What Does Canada Buy from the United States?
US exports to Canada center on manufactured goods, with machinery and equipment manufacturing leading at 35% of total goods exports. Chemicals and plastics follow at 16%, while electronics manufacturing contributes 13% of export value.
This manufacturing-focused trade relationship supports integrated production systems across North America.
How Integrated Are US-Canada Supply Chains?
The automotive industry exemplifies the deep integration of US-Canadian manufacturing. A single vehicle’s components typically cross the border multiple times during production, with some parts making up to eight border crossings before final assembly.
This integration creates a complex network where both countries depend on each other’s manufacturing capabilities.
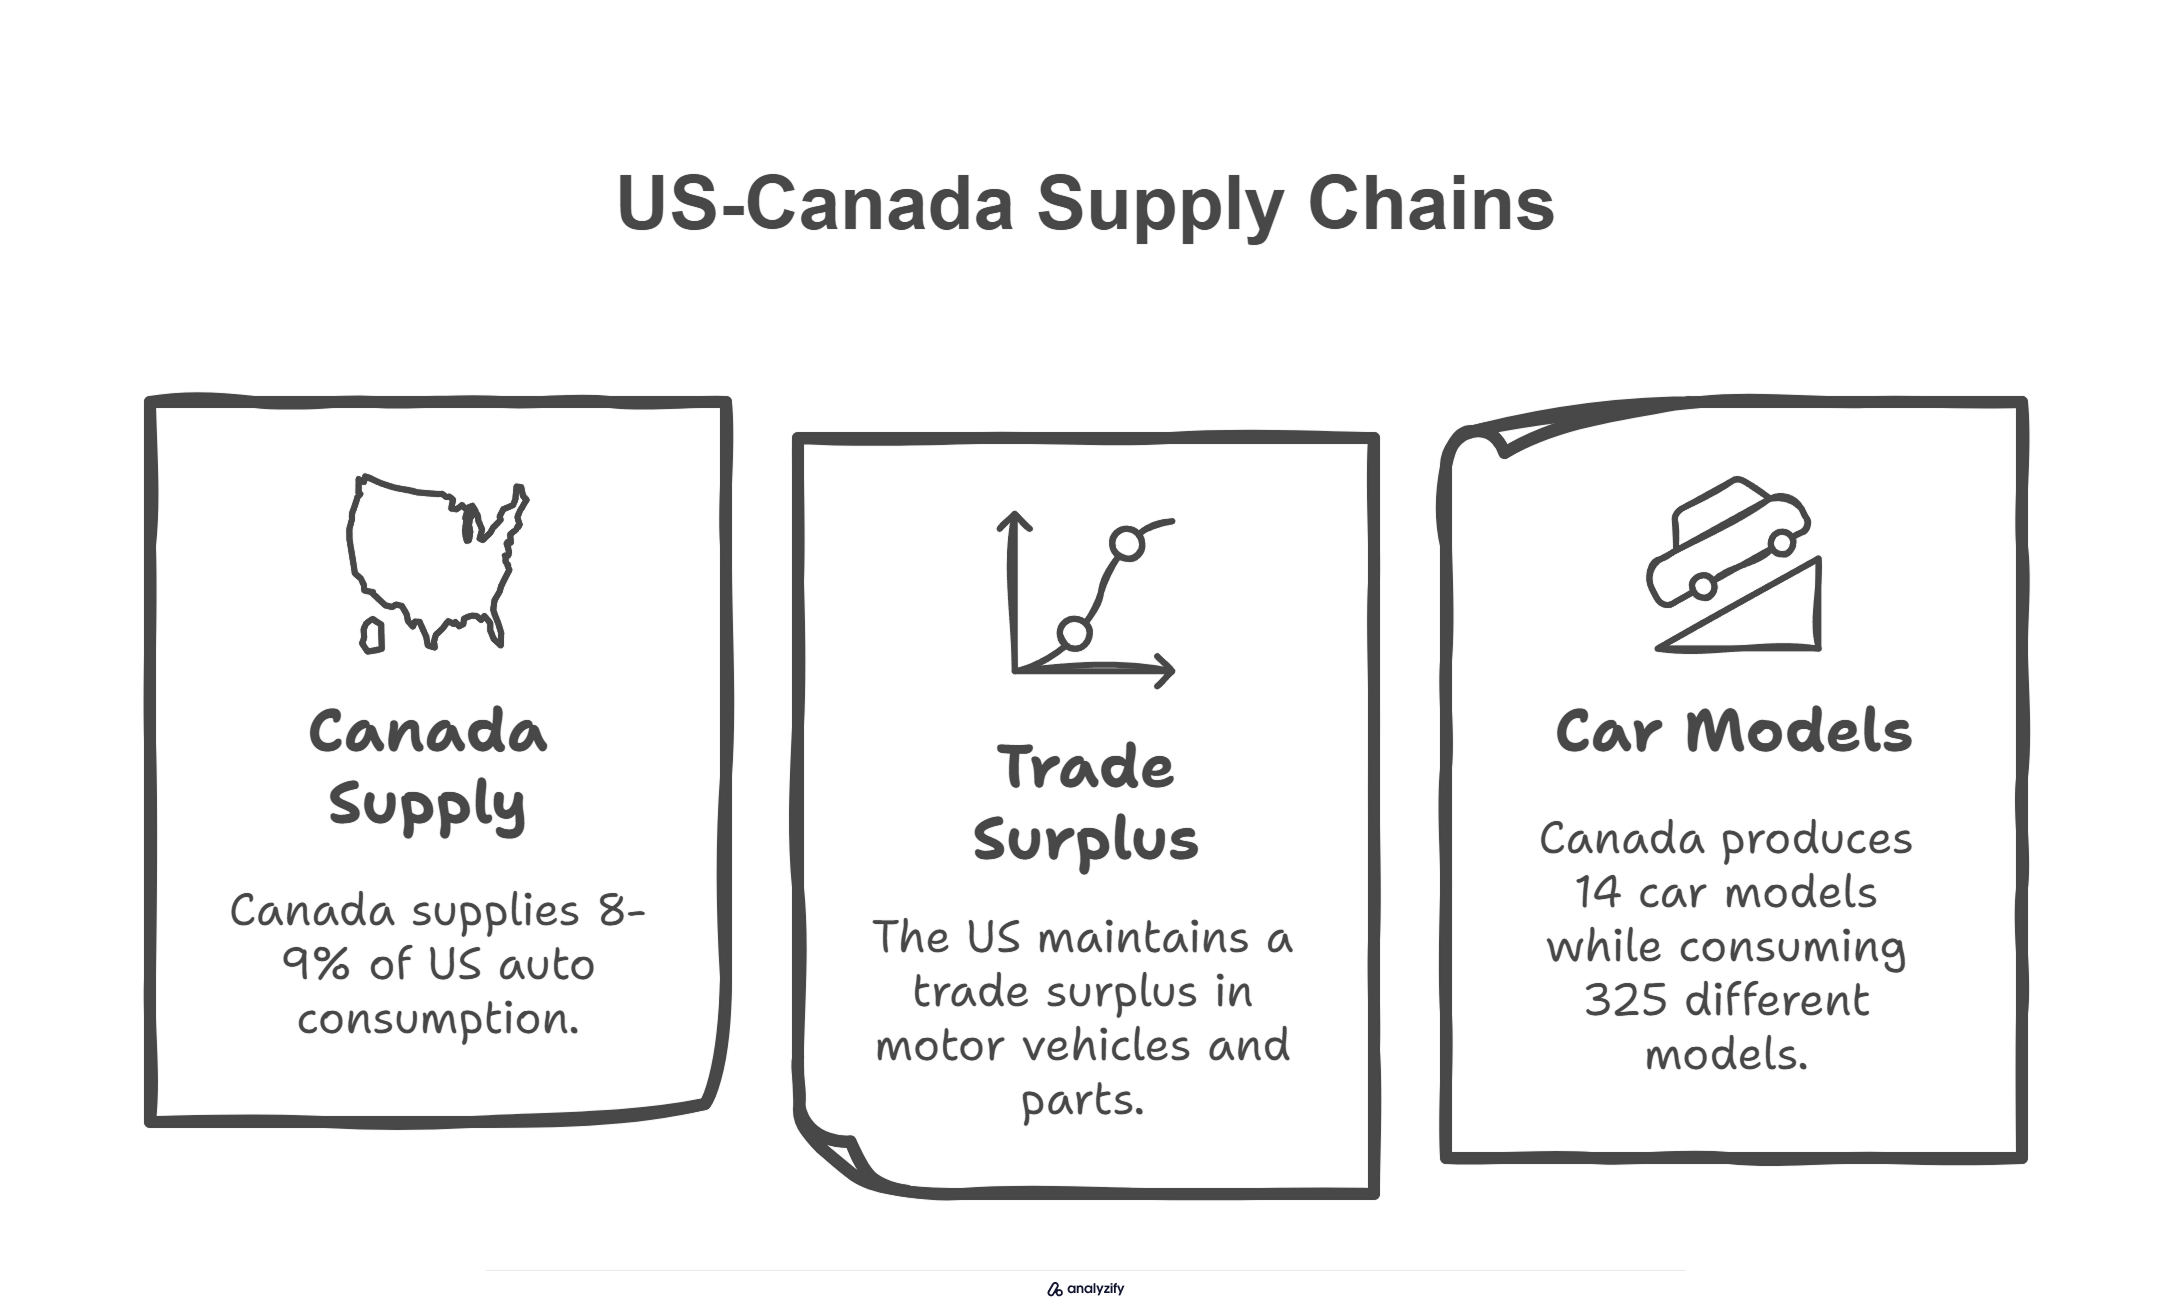
Three key statistics highlight this interdependence:
- Canada supplies 8-9% of US auto consumption
- The US maintains a trade surplus in motor vehicles and parts
- Canada produces 14 car models while consuming 325 different models
Why Are Critical Minerals Important in This Trade Relationship?
The US government has identified 50 critical minerals essential for economic and national security. Of these, the US must import 43, with Canada serving as a crucial supplier.
Canadian mines provide between 50-80% of US requirements for essential minerals like zinc, tellerium, nickel, and vanadium.
This relationship gains additional importance with the growth of green technology. Canada possesses significant reserves of materials crucial for electric vehicle batteries, including:
- Cobalt and graphite deposits
- Lithium resources
- Rare earth elements
Which States and Regions Depend Most on This Trade?
The impact of US-Canada trade varies dramatically by region. While Texas leads in absolute terms with $34 billion in exports to Canada, followed by Michigan at $22 billion, the relative importance of Canadian trade tells a different story.
North Dakota sends 70% of its exports to Canada, while Montana sources 92% of its imports from its northern neighbor.
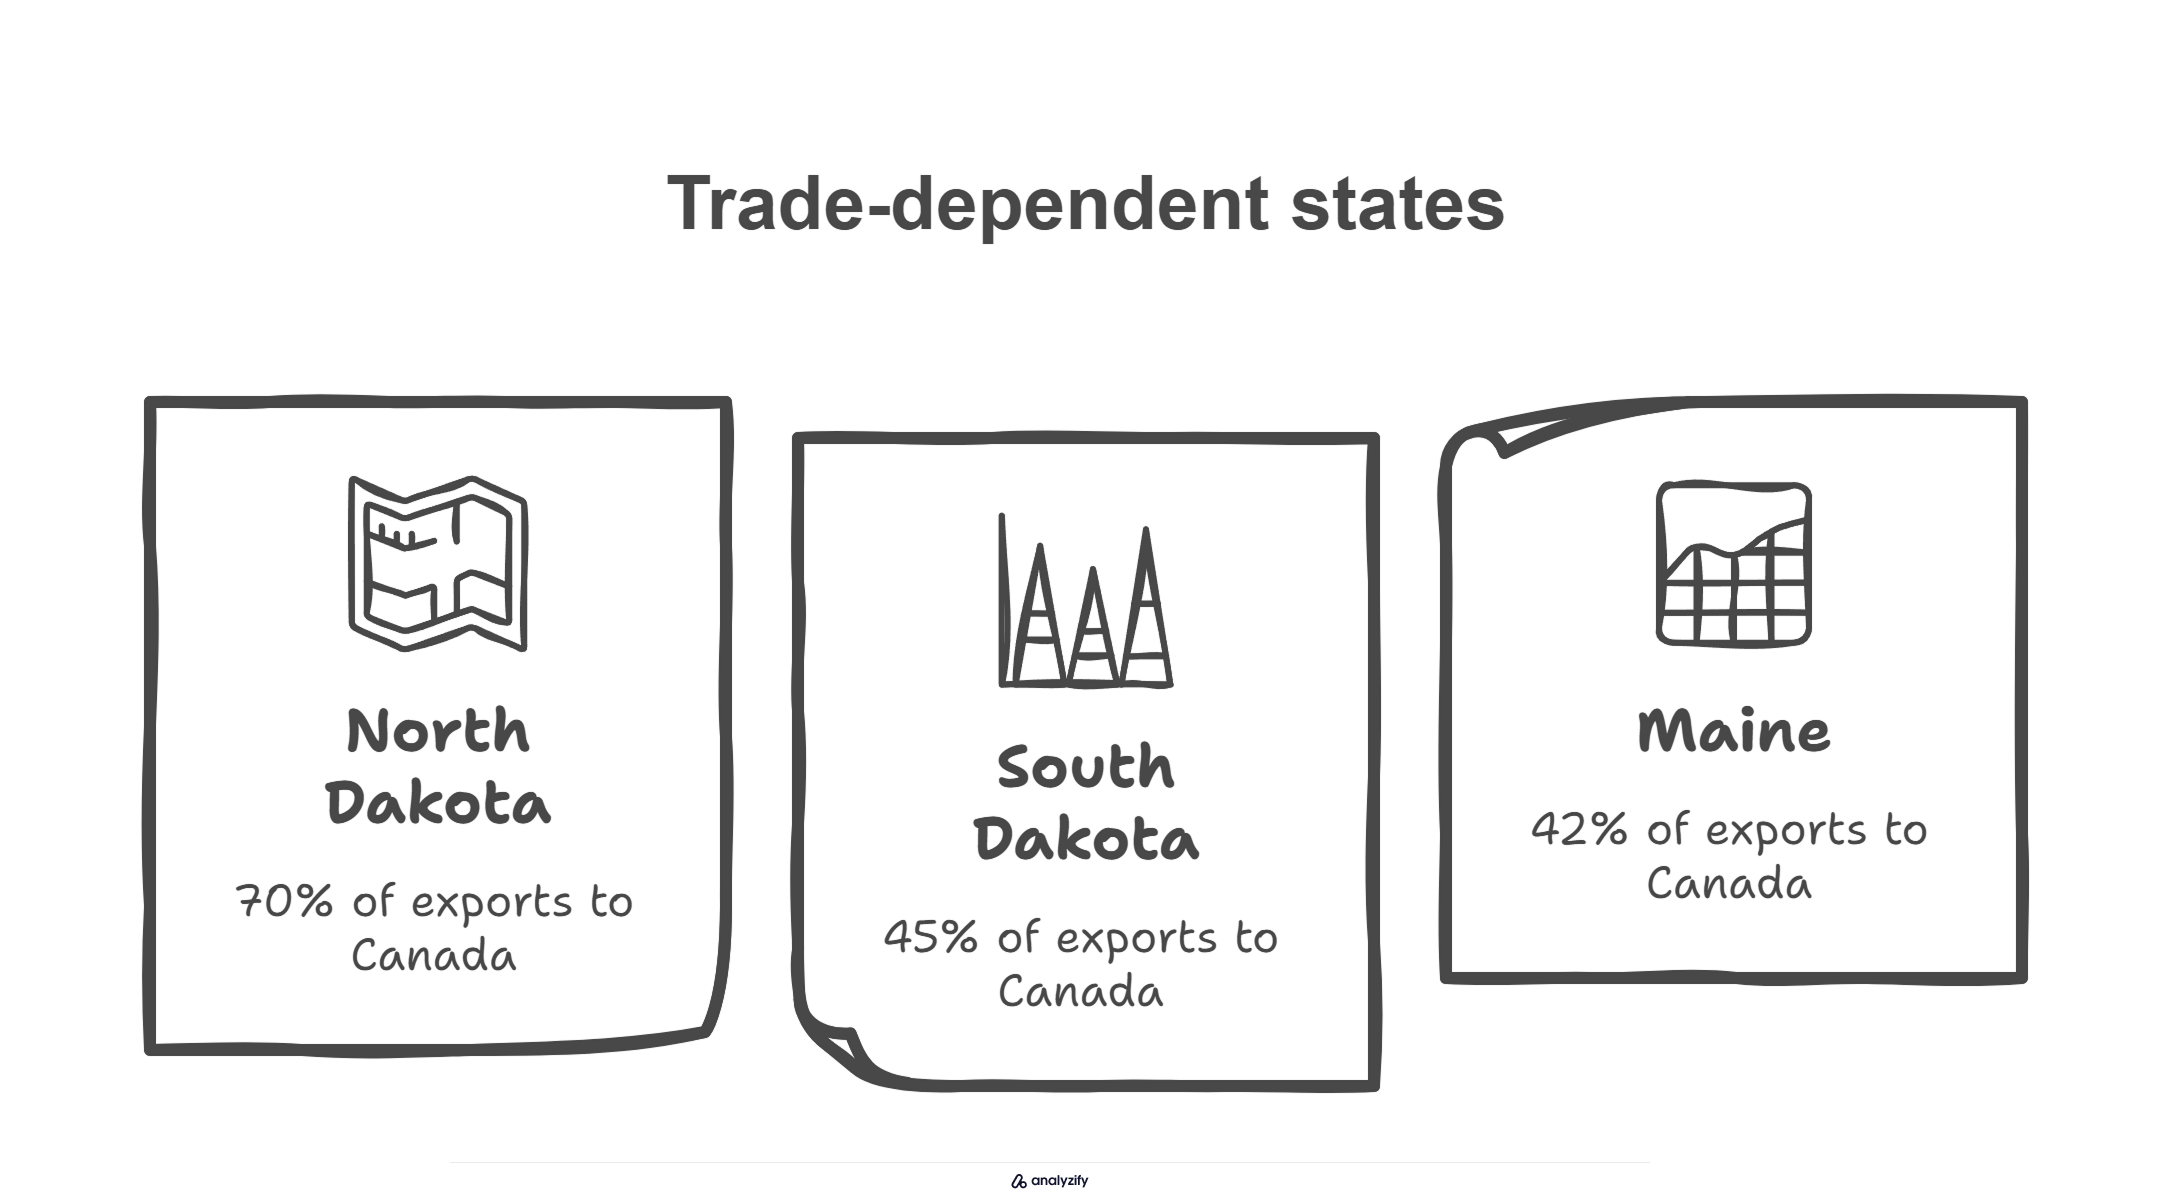
The most trade-dependent states include:
- North Dakota: 70% of exports to Canada
- South Dakota: 45% of exports
- Maine: 42% of exports
This regional variation reflects diverse economic ties, shaped by factors such as:
- Energy infrastructure connections, including cross-border pipelines
- Integrated manufacturing facilities, particularly in the Great Lakes region
- Agricultural trade relationships along the border
- Transportation networks that facilitate cross-border commerce
Each state’s trade pattern with Canada reflects its unique economic structure and geographic position, creating a complex tapestry of regional dependencies within the larger bilateral relationship.
How Will 25% Tariffs Impact the US and Canadian Economies?
The implementation of 25% tariffs on Canadian goods and 10% tariffs on energy imports threatens to create significant economic disruption across both nations.
Bank of Canada analysis provides detailed projections of the potential impacts on growth, inflation, and business operations.

What Are the Projected GDP Impacts?
The economic cost of these tariffs will be substantial for both nations. Analysis shows that a 25% tariff could:
- Reduce Canada’s GDP by 2.6%
- Shrink US GDP by 1.6%
- Cost Canadian households $1,900 annually
- Impact US families by $1,300 per year
How Will These Tariffs Affect Growth and Inflation?
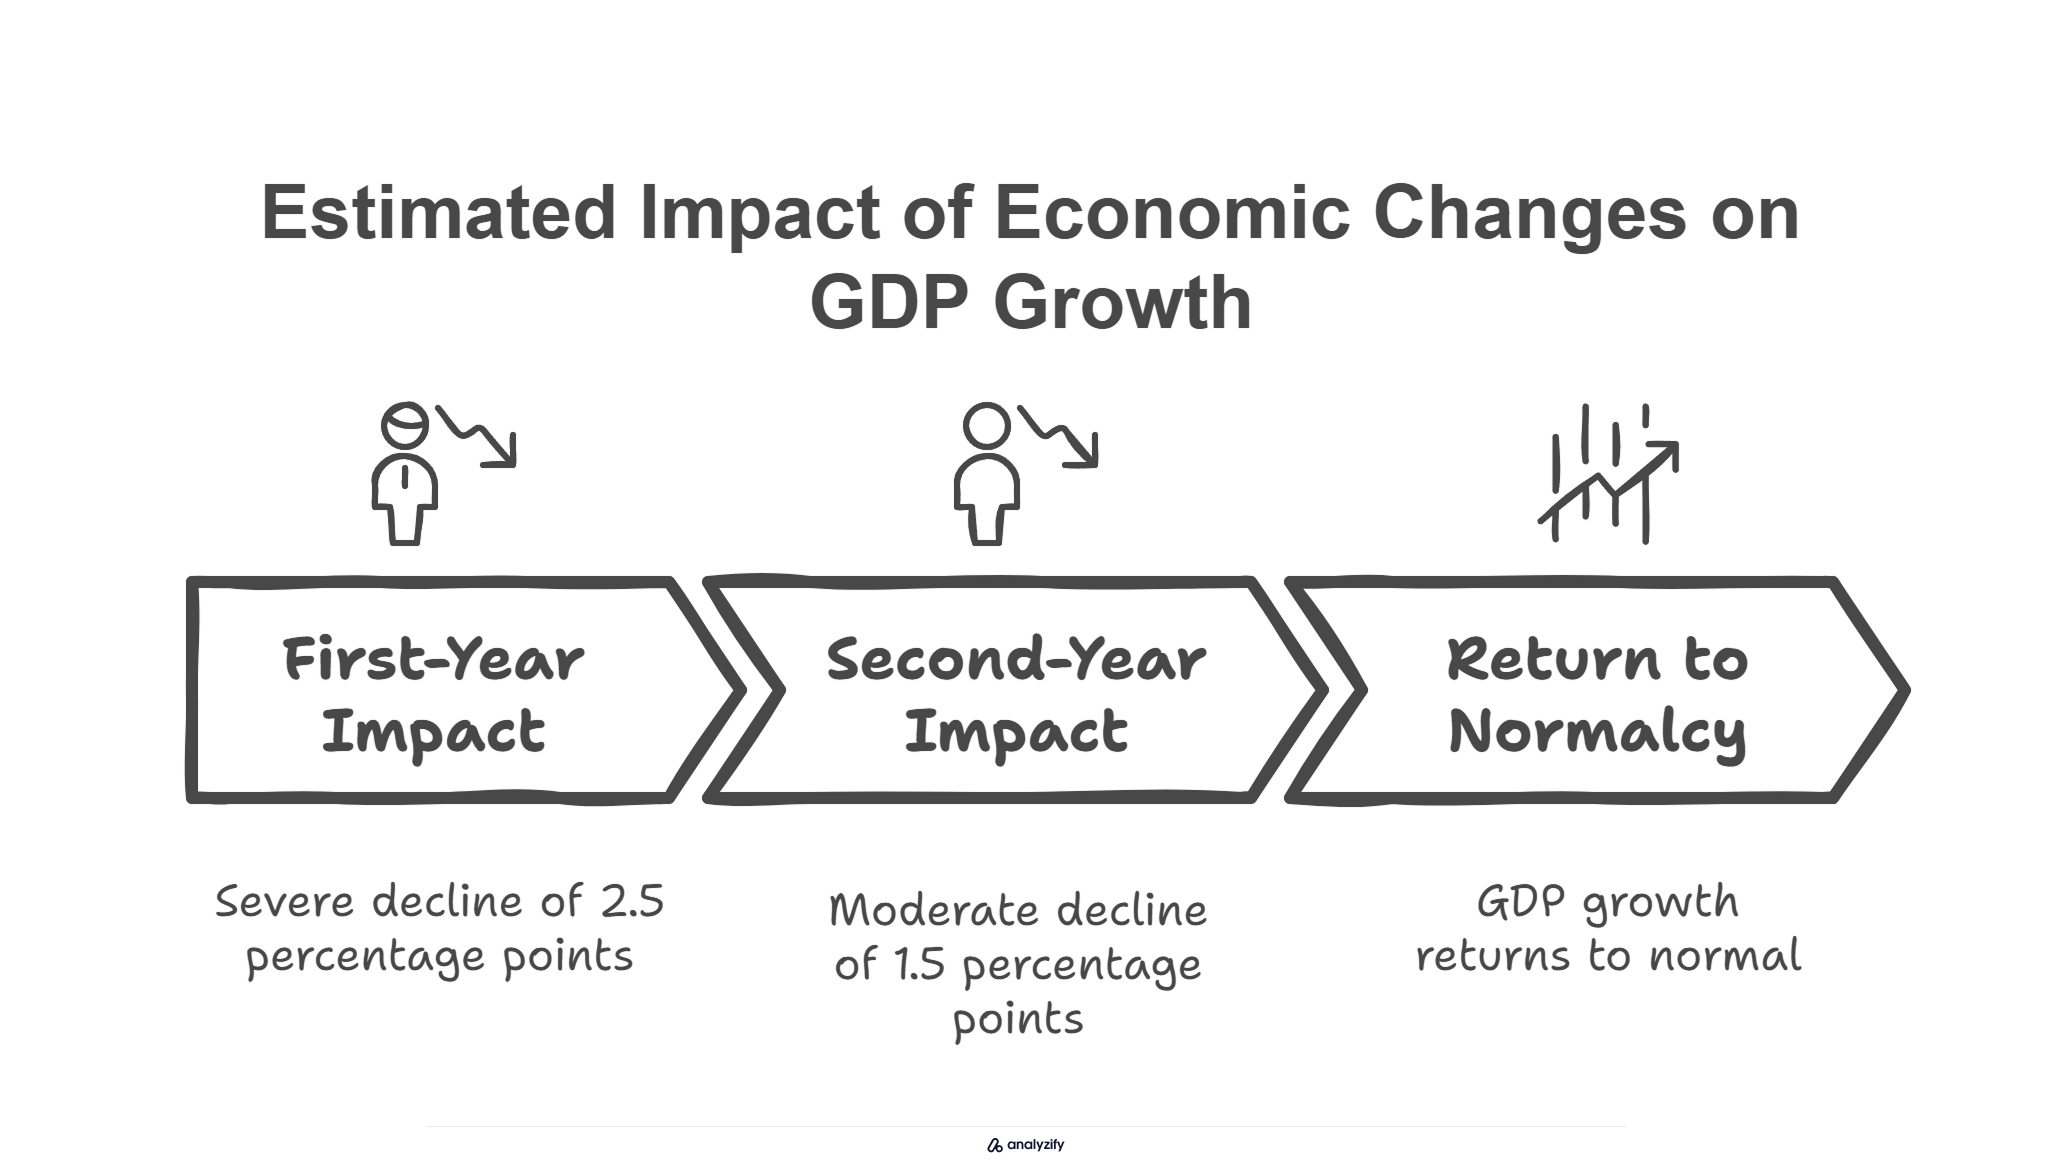
First-year impacts on Canadian economic growth will be severe. The Bank of Canada’s benchmark calibration indicates:
Annual GDP growth will decline by:
- 2.5 percentage points in the first year
- 1.5 percentage points in the second year
- Return to normal growth rates by the third year
Canadian inflation faces competing pressures. While GDP decline and weaker commodity prices initially suppress inflation, tariff pass-through effects eventually dominate.
The inflation impact varies based on how quickly businesses pass costs to consumers:
- Direct effects come from US goods making up 13% of Canada’s CPI basket
- Indirect effects arise from higher production input costs
- Full cost pass-through typically takes three years
What Happens to Business Investment?
Canadian business investment faces multiple challenges under the new tariffs:
Impact drivers include:
- Higher costs for US-sourced machinery and equipment
- Reduced export activity dampening expansion plans
- Lower business profits as companies absorb tariff costs
The US equipment impact is particularly significant because:
- US imports comprise about half of Canadian business investment in machinery
- Currency depreciation will further increase these costs
- Businesses face reduced profits while absorbing tariff costs
How Will Supply Chains Adapt?
The automotive sector illustrates the complexity of supply chain disruption. With parts crossing the border up to eight times during production, tariffs would:
- Amplify cost increases at each border crossing
- Raise production costs on both sides
- Potentially increase US retail car prices by $3,000
The energy sector faces similar challenges:
- US refineries, especially in the mid-West, are specifically designed for Canadian heavy crude
- A 10% tariff on Canadian crude could increase US gasoline prices by $0.30-0.70 per gallon
- Finding alternative suppliers is complicated by refinery configurations
What Currency and Trade Balance Effects Are Expected?
The tariffs will likely trigger significant adjustments in currency markets and trade patterns:
Trade impacts include:
- Weaker Canadian export volumes
- Lower global commodity prices
- Declining Canadian business investment
These factors combine to pressure the Canadian dollar lower, though this depreciation provides some offset to tariff impacts for Canadian exporters.
The adjustment period poses particular challenges because:
- Businesses need time to find alternative suppliers
- Some production processes can’t easily switch inputs
- Integrated supply chains take years to restructure
Which US States and Canadian Provinces Will Be Most Affected?
The impact of US tariffs and Canadian countermeasures varies significantly by region, reflecting different economic structures and trade dependencies.
These regional variations create a complex pattern of winners and losers across both countries.
How Do Canadian Provinces Depend on US Trade?
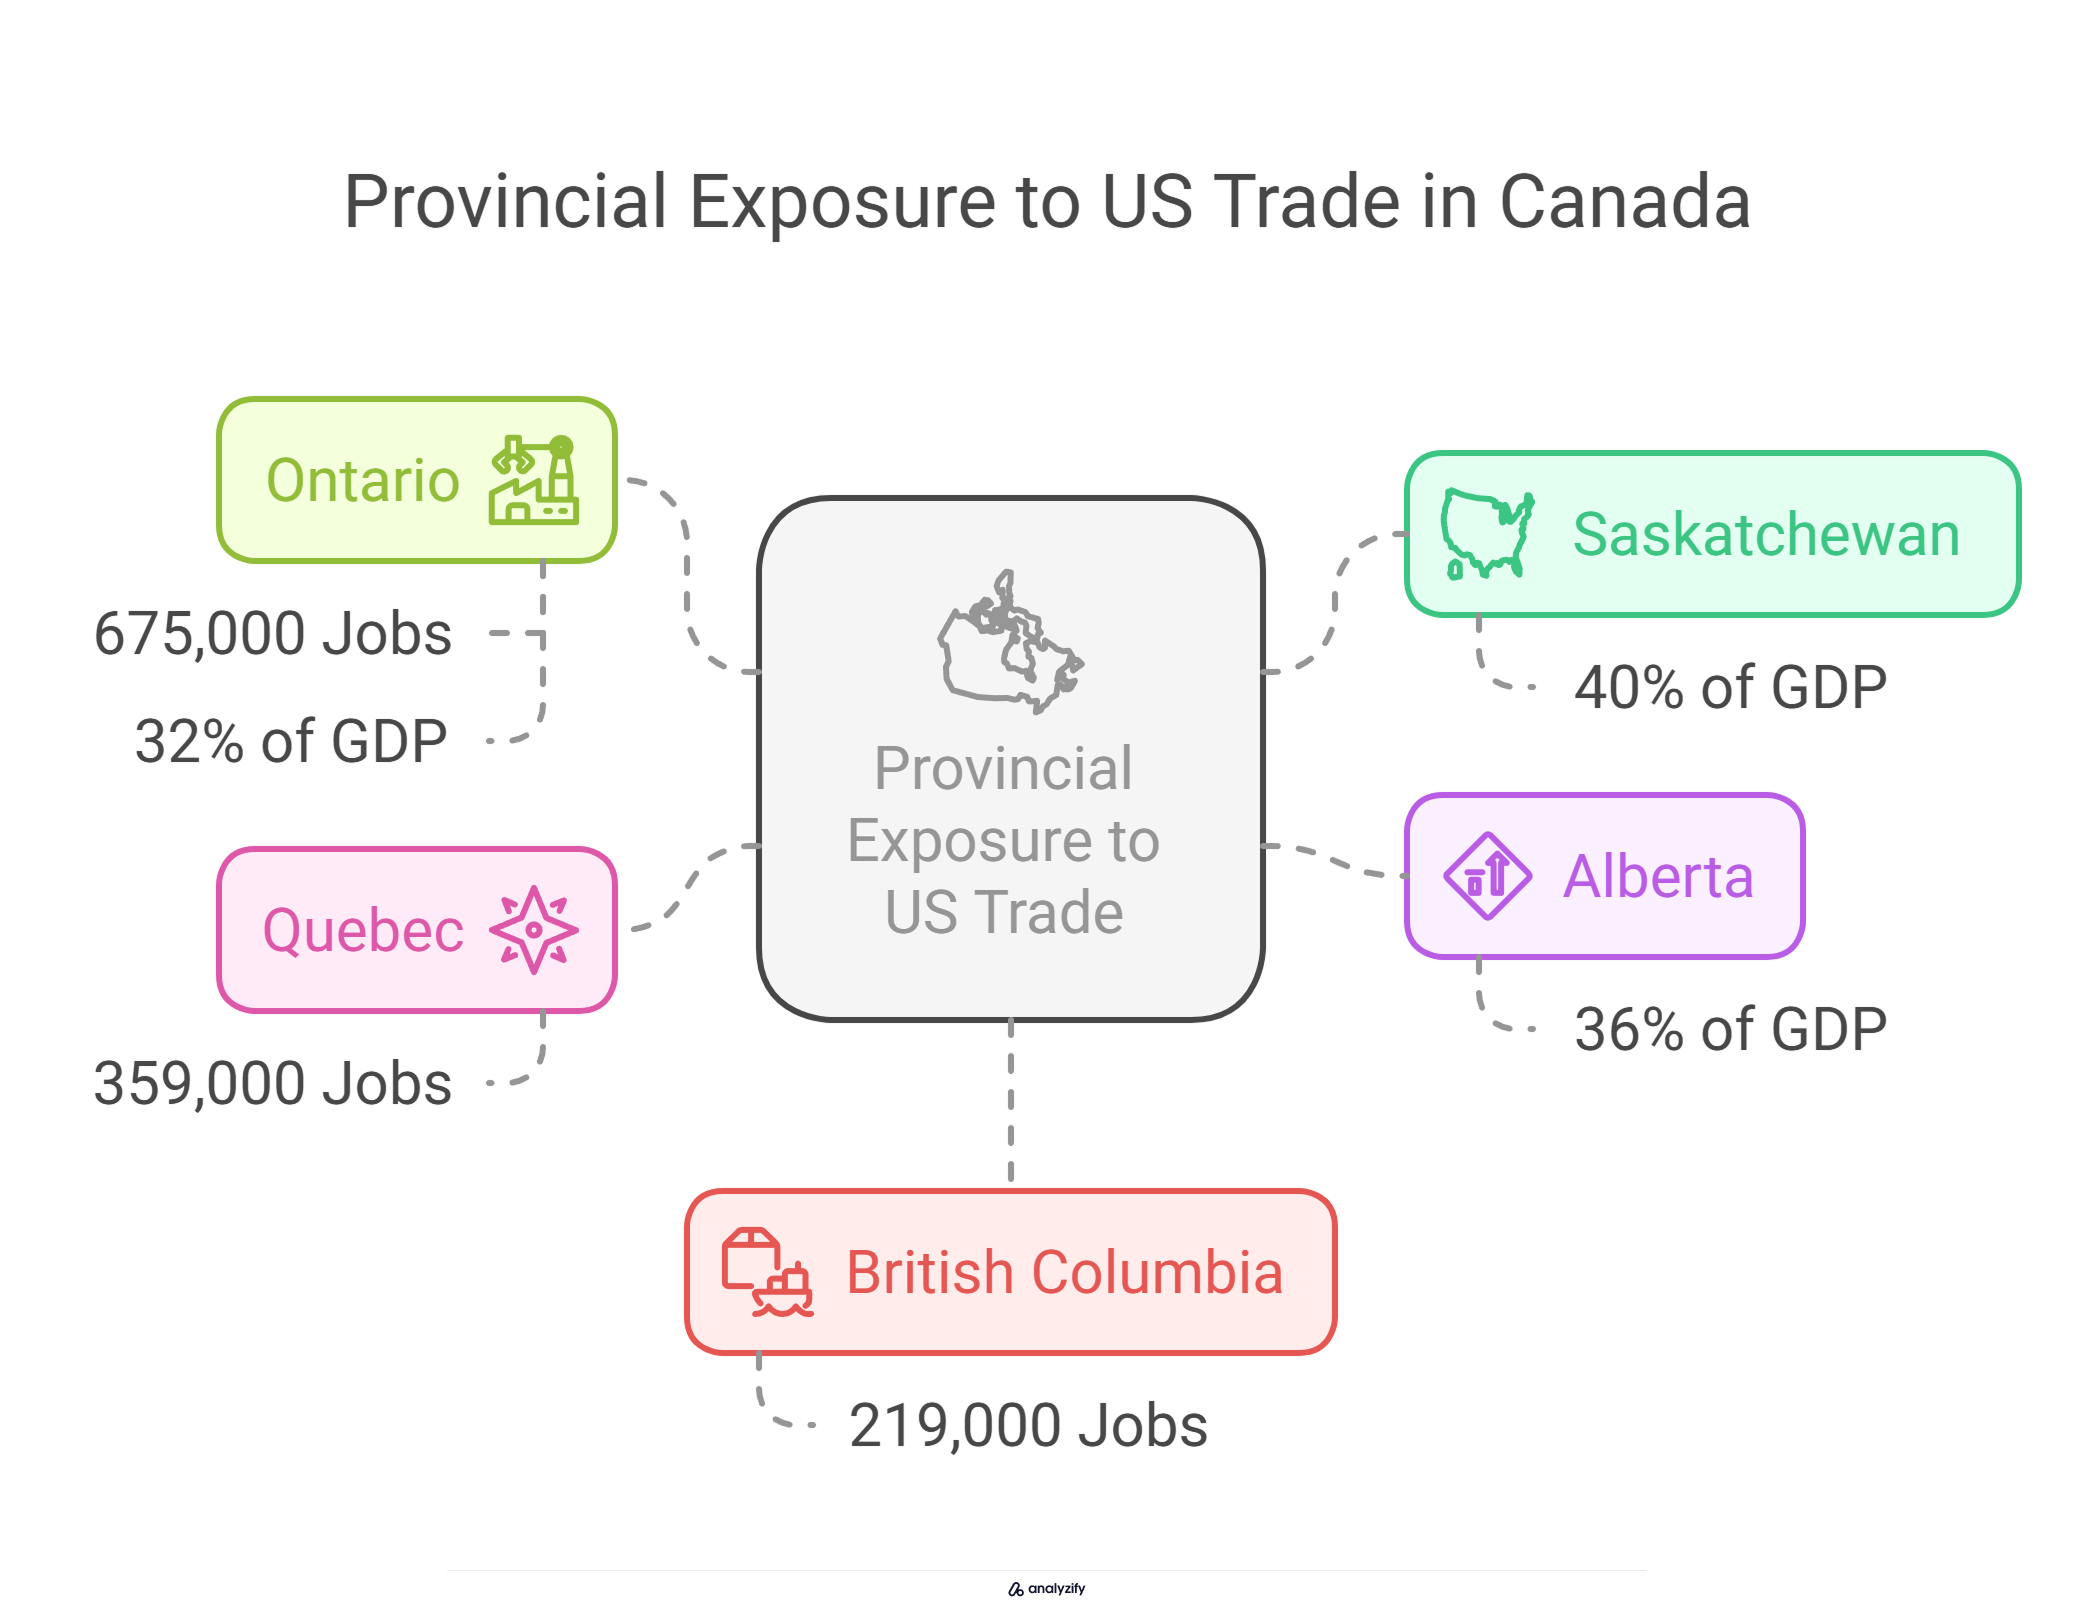
Provincial exposure to US trade varies dramatically across Canada. Export dependency as a share of provincial GDP reveals the economic stakes for different regions.
Saskatchewan leads with US exports accounting for 40% of its GDP, while Alberta follows at 36% and Ontario at 32%.
The manufacturing heartland faces particular challenges:
- Ontario generates 675,000 direct export-related jobs
- Quebec supports 359,000 export jobs
- British Columbia maintains 219,000 export positions
When including both direct and indirect employment, the impact grows substantially. Manufacturing accounts for 39% of total Canadian jobs tied to exports, with three provinces bearing the bulk of employment risk:
- Ontario: 1.2 million total trade-related jobs
- Quebec: 627,000 jobs
- Alberta: 397,000 jobs
Which Canadian Regions Face the Greatest Trade Exposure?
Regional trade patterns show varying levels of US market dependency. New Brunswick ships 92% of its exports to the US market, creating particular vulnerability to tariffs.
This regional variation in trade exposure creates different levels of risk:
As a share of GDP, international trade represents:
- 45% of Saskatchewan’s economy
- 38% of Alberta’s output
- 35% of New Brunswick’s economic activity
- 32% of Newfoundland and Labrador’s GDP
How Will Energy-Producing Regions Be Impacted?
Energy trade shapes regional economic vulnerability. For energy-producing provinces, the picture is particularly stark:
- Only Newfoundland and Labrador and Alberta see energy exports exceed non-energy exports in GDP contribution
- Ontario directly supplies electricity to 1.5 million US homes
- Energy exports significantly impact Michigan, Minnesota, and New York through power grid connections
Which US States Face the Greatest Risk?
State-level exposure to Canadian trade reveals unexpected vulnerabilities. Import dependency shows particular risks for northern border states:
- Montana sources 92% of its imports from Canada
- Maine relies on Canada for 71% of imports
- North Dakota obtains 65% of its imports from Canadian sources
The economic relationship extends beyond border states. Canada represents the primary export market for:
- 25% of consumer products exports
- 24% of machinery and equipment manufacturing
- 28% of forestry and wood products
How Will Manufacturing Hubs Adapt?
Cross-border manufacturing hubs face complex adjustment challenges. The impact varies by sector:
- US imports 51% of its total energy needs from Canada
- 38% of US forestry and wood products come from Canada
- 17% of US metals and minerals originate in Canada
These integrated supply chains can’t be quickly restructured. The top importing states from Canada highlight this integration:
- Illinois: $58 billion
- Michigan: $41 billion
- Texas: $35 billion
- Ohio: $18 billion
The depth of these connections means that finding alternative suppliers or markets will require significant time and investment, particularly in sectors with specialized infrastructure or long-standing business relationships.
What Will Happen to the US-Canada Energy Trade?
The new 10% tariff on Canadian energy imports represents a significant shift in North American energy relations. This change could disrupt long-established supply patterns and impact energy security across both nations.

How Much Energy Does Canada Supply to the US?
The scale of US-Canada energy trade has grown substantially over the past decade. Canadian energy supplies to the US have seen remarkable growth, with crude oil imports increasing from 924 million barrels in 2013 to 1.4 billion barrels in 2023.
This represents a dramatic shift in market share, as Canada’s portion of US crude imports rose from 33% to 60% during this period.
What Are the Direct Price Impacts of Energy Tariffs?
The implementation of energy tariffs threatens immediate price increases for US consumers. Analysis shows:
- Gasoline prices could jump by $0.30-0.70 per gallon
- Impact would be immediate due to refinery dependencies
- Price effects would vary by region based on reliance on Canadian crude
Why Can’t US Refineries Easily Switch Suppliers?
US refineries, particularly in the Midwest, have spent decades optimizing their facilities specifically for Canadian heavy crude oil. Without this supply, US gasoline prices would face significant pressure.
Alternative supply options face major barriers:
- Mexico already holds maximum market share in US oil imports.
- Venezuelan oil would require lifting current sanctions.
- The US Strategic Petroleum Reserve contains different grades of crude oil that are not a direct substitute.
How Important is Electricity Trade?
Cross-border electricity trade is a crucial part of regional power systems, with deep integration between the two countries’ power grids. Ontario alone powers 1.5 million US homes through its extensive export network.
Certain US states are highly dependent on Canadian electricity:
- Michigan relies on Ontario’s grid connections for peak demand periods.
- Minnesota integrates Canadian power into its renewable energy mix.
- New York receives crucial baseload power from Canadian sources.
What Are the Broader Economic Implications?
Energy trade fundamentally shapes the US-Canada economic relationship, creating dependencies that go far beyond simple import-export numbers.
Canadian energy exports to the US have reached approximately $170 billion annually, representing nearly one-third of total Canadian shipments.
This energy trade is so significant that it determines the overall trade balance between the nations.
The scale of energy trade reveals three critical aspects:
- It accounts for the entire US-Canada trade deficit
- Without energy, the US maintains a $63 billion trade surplus
- Energy exports serve as Canada’s primary trade advantage
How Will Energy Security Be Affected?
The tariffs pose significant challenges to North American energy security, threatening decades of carefully built integration.
An extensive network of pipelines carries oil and gas across the border, while interconnected electrical grids ensure power stability for communities on both sides.
This infrastructure represents billions in investment and years of coordinated development.
The US faces limited options for replacing Canadian energy supplies:
- Mexico already maintains a significant share of the US market
- Venezuelan oil access would require lifting current sanctions
- US Strategic Petroleum Reserve contains different grades of crude oil
Beyond current supply chains, the US and Canada have developed crucial joint initiatives for future energy security. The Energy Transformation Task Force (ETTF) coordinates efforts in several key areas:
- Development of critical mineral supply chains
- Expansion of nuclear energy capacity
- Implementation of carbon reduction technologies
- Enhancement of cybersecurity measures
These established partnerships cannot be quickly replaced, as they involve specialized infrastructure, technical expertise, and long-term planning commitments.
The 10% energy tariff threatens to disrupt these carefully balanced systems at a time when energy security concerns are paramount.
Final Words: The Scale and Significance of US-Canada Trade Relations
The US-Canada economic partnership represents one of the world’s most significant bilateral relationships, with annual trade reaching $784 billion and daily cross-border commerce of $3.6 billion.
The relationship is notably asymmetric - Canada depends on the US market for 77% of its exports, while the US sends 18% of its exports to Canada. Yet the US relies heavily on Canada for critical supplies, particularly energy, where Canada provides 60% of US crude oil imports.
The integration runs deeper than trade figures suggest. Foreign direct investment flows are substantial, with Canadian investment in the US reaching $671.7 billion and US investment in Canada at C$618.2 billion.
Manufacturing supply chains are deeply interconnected, particularly in the automotive sector, while energy infrastructure and power grids are physically integrated across the border.
The new tariffs threaten this complex economic ecosystem at a critical time. With 1.4 million American jobs and 2.3 million Canadian jobs dependent on cross-border trade, both nations face significant adjustment challenges.
The outcome of this trade dispute, combined with the approaching 2026 USMCA review, will determine whether North America’s most comprehensive trading relationship can maintain its historic strength and integration.