
Key Takeaways about Average Order Value in GA4:
- The AOV in GA4 is calculated by dividing the revenue by the total number of orders.
- A high AOV is a good sign that you’re boosting your revenue per sale. Raising AOV means increasing revenue without increasing the number of customers or sales. Therefore, having a high average order value in GA4 demonstrates that you can uncover the potential of your store’s performance
- Having a low or declining average purchase value indicates that your revenue is below the desired level.

🎉 Bonus Content: Before we dive in, explore the best Shopify GA4 apps to improve your data tracking & reporting.
What Is Average Order Value (AOV) in GA4 (AOV)?
Average order value (AOV) in GA4 is the average amount of money that a customer spends on each order in your online store. So, if you have $10,000 in revenue and 100 sales, your AOV is 100.
It is one of the key performance indicators (KPIs) you should check regularly to see the average amount of money your customers spend per sale.
As an important metric to track, it shows the overall health & performance of your e-commerce store and provides insight into how customers interact with your products. You can monitor the AOV for any time period, yet most merchants typically keep a close eye on the moving monthly average.
While a high AOV in GA4 helps you understand that your customers tend to buy more items per order, or they spend more on each item, a low AOV may show that your customers buy fewer items or they just spend less per item.
How to Calculate Average Order Value in GA4?
You can calculate the average order value (AOV) very easily. To do that, you should divide the total revenue by the number of orders placed.
 For example, if you want to calculate the average order value (AOV) of an e-Commerce store that generates $10,000 in revenue from 100 orders, you need to do the following operation:
$10,000 / 100 orders = $100/order (AOV)
That’s to say, the AOV would be $100 in this case.
- Yet, it’s important to note that AOV in GA4 only reflects the average amount spent per transaction and does not take into account the number of items purchased in each order.
- If you want to understand the average value of each item sold, you need to use a different metric called Average Selling Price (ASP).
What Is the Average Order Value (AOV) for ecommerce?
Firstly, you should know that the average order value (AOV) of ecommerce can vary significantly based on the sector, business, and categories of products.
However, e-commerce stores offering pricey products such as electronics or luxury items may have higher AOVs in comparison to those shipping low-priced items such as clothing or accessories.
We have analyzed the 2023 July e-commerce average order value report and here what we have found:
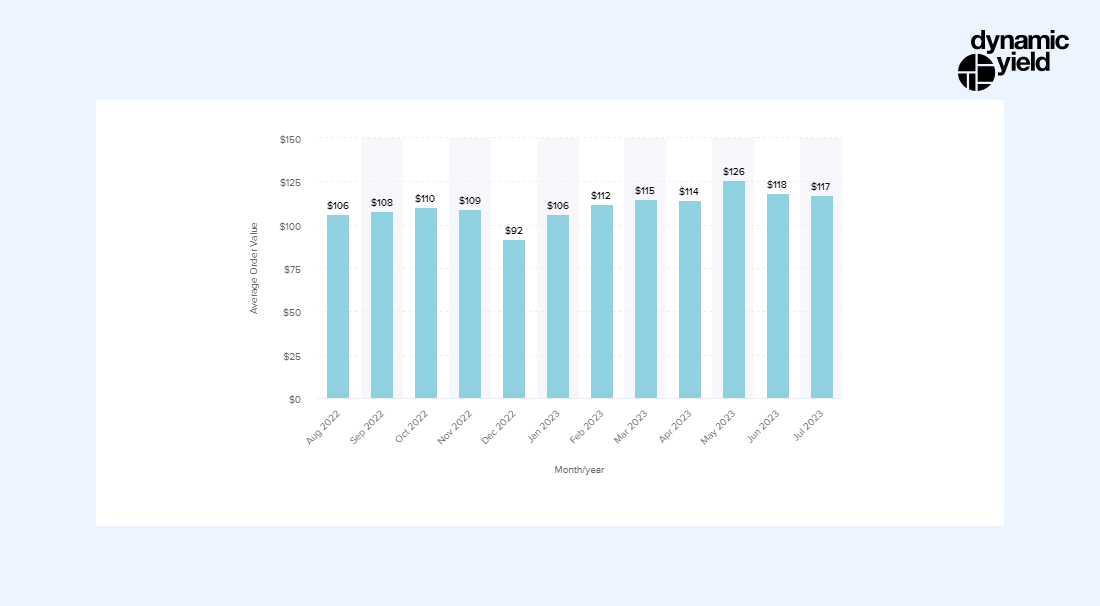 Let’s zoom in on the numbers from last July – it’s akin to browsing through snapshots in a sales report. Here’s what caught our eye:
Home & Furniture Highlight: The Home & Furniture category took the spotlight, boasting an impressive Average Order Value (AOV) of $265. This marked a noteworthy 4% surge compared to the previous month, indicating evolving shopping behaviors.
A Yearlong View
If we step back and consider a full year:
Steady Home & Furniture Performance: Home & Furniture maintained a consistent AOV of $238 per order, demonstrating unwavering consumer spending trends.
Variation in Pet Care & Veterinary Services: In contrast, Pet Care & Veterinary Services presented a lower AOV of $70, underscoring the influence of product types on spending.
Regional Insights
Now, let’s explore where these transactions unfold:
EMEA’s Leadership: The EMEA region (Europe, Middle East, and Africa) took the lead with an impressive average value of $195.
Americas and APAC Following: The Americas closely followed with an average AOV of $106, while the APAC region (Asia-Pacific) was in the vicinity at $102.
Device Impact
When it comes to how people buy things, different devices play a role:
Desktops Dominating: Desktops, led the way with an AOV of $121.
Mobile’s Influence: Mobile devices followed suit with a respectable $104 AOV.
Tablets Contributing: Tablets added their part with an average value of $80.
- It’s important to note that the average order value (AOV) in Google Analytics 4 is just one metric and should be taken into account alongside other metrics such as conversion rate and customer lifetime value.
- Analyzing all the metrics can help you get a better understanding of your ecommerce performance.
How to Find Your Average ecommerce Order Value in GA4?
Once you find your average ecommerce order value in Google Analytics 4, you can get a better understanding of how much money your customers are spending per transaction and identify trends and patterns in their spending habits.
In order to view the Average Order Revenue (referred to as Purchase Revenue in GA4) in Google Analytics 4, you need to generate a custom Exploration report.
Follow the steps below to find your AOV in Google Analytics 4 (GA4):
- Log in to your GA4 account and navigate to Explorations.
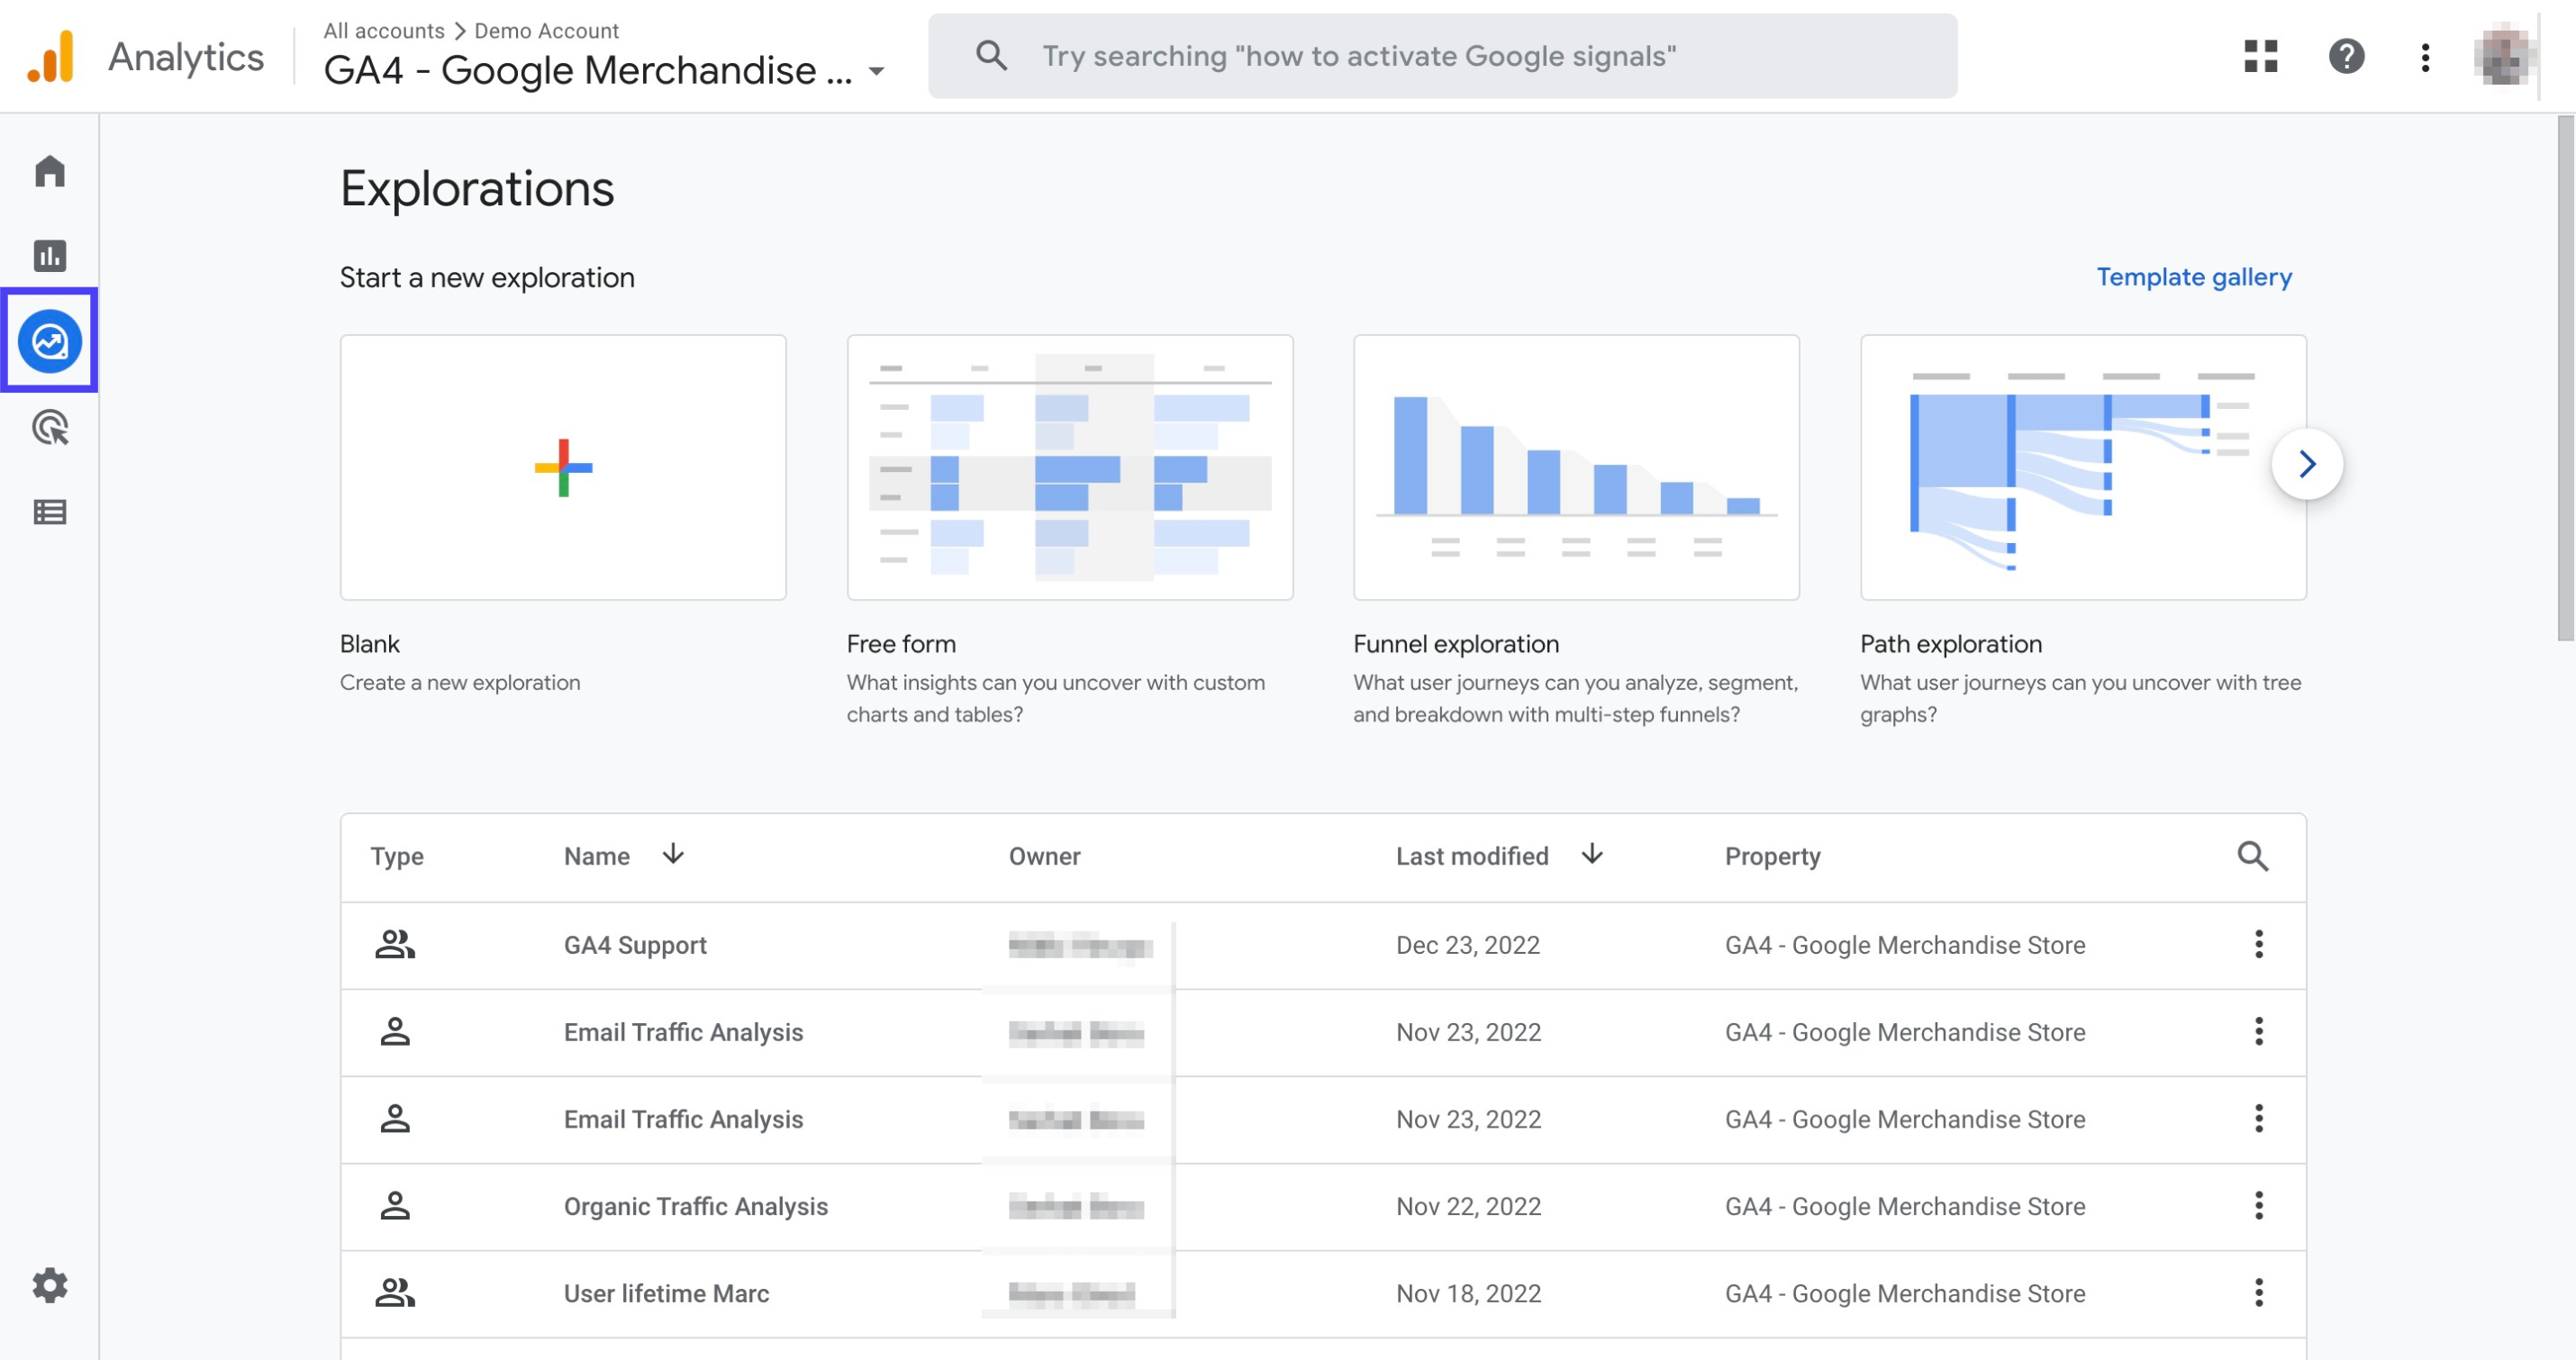 2. Click on the plus icon to create a new Exploration.
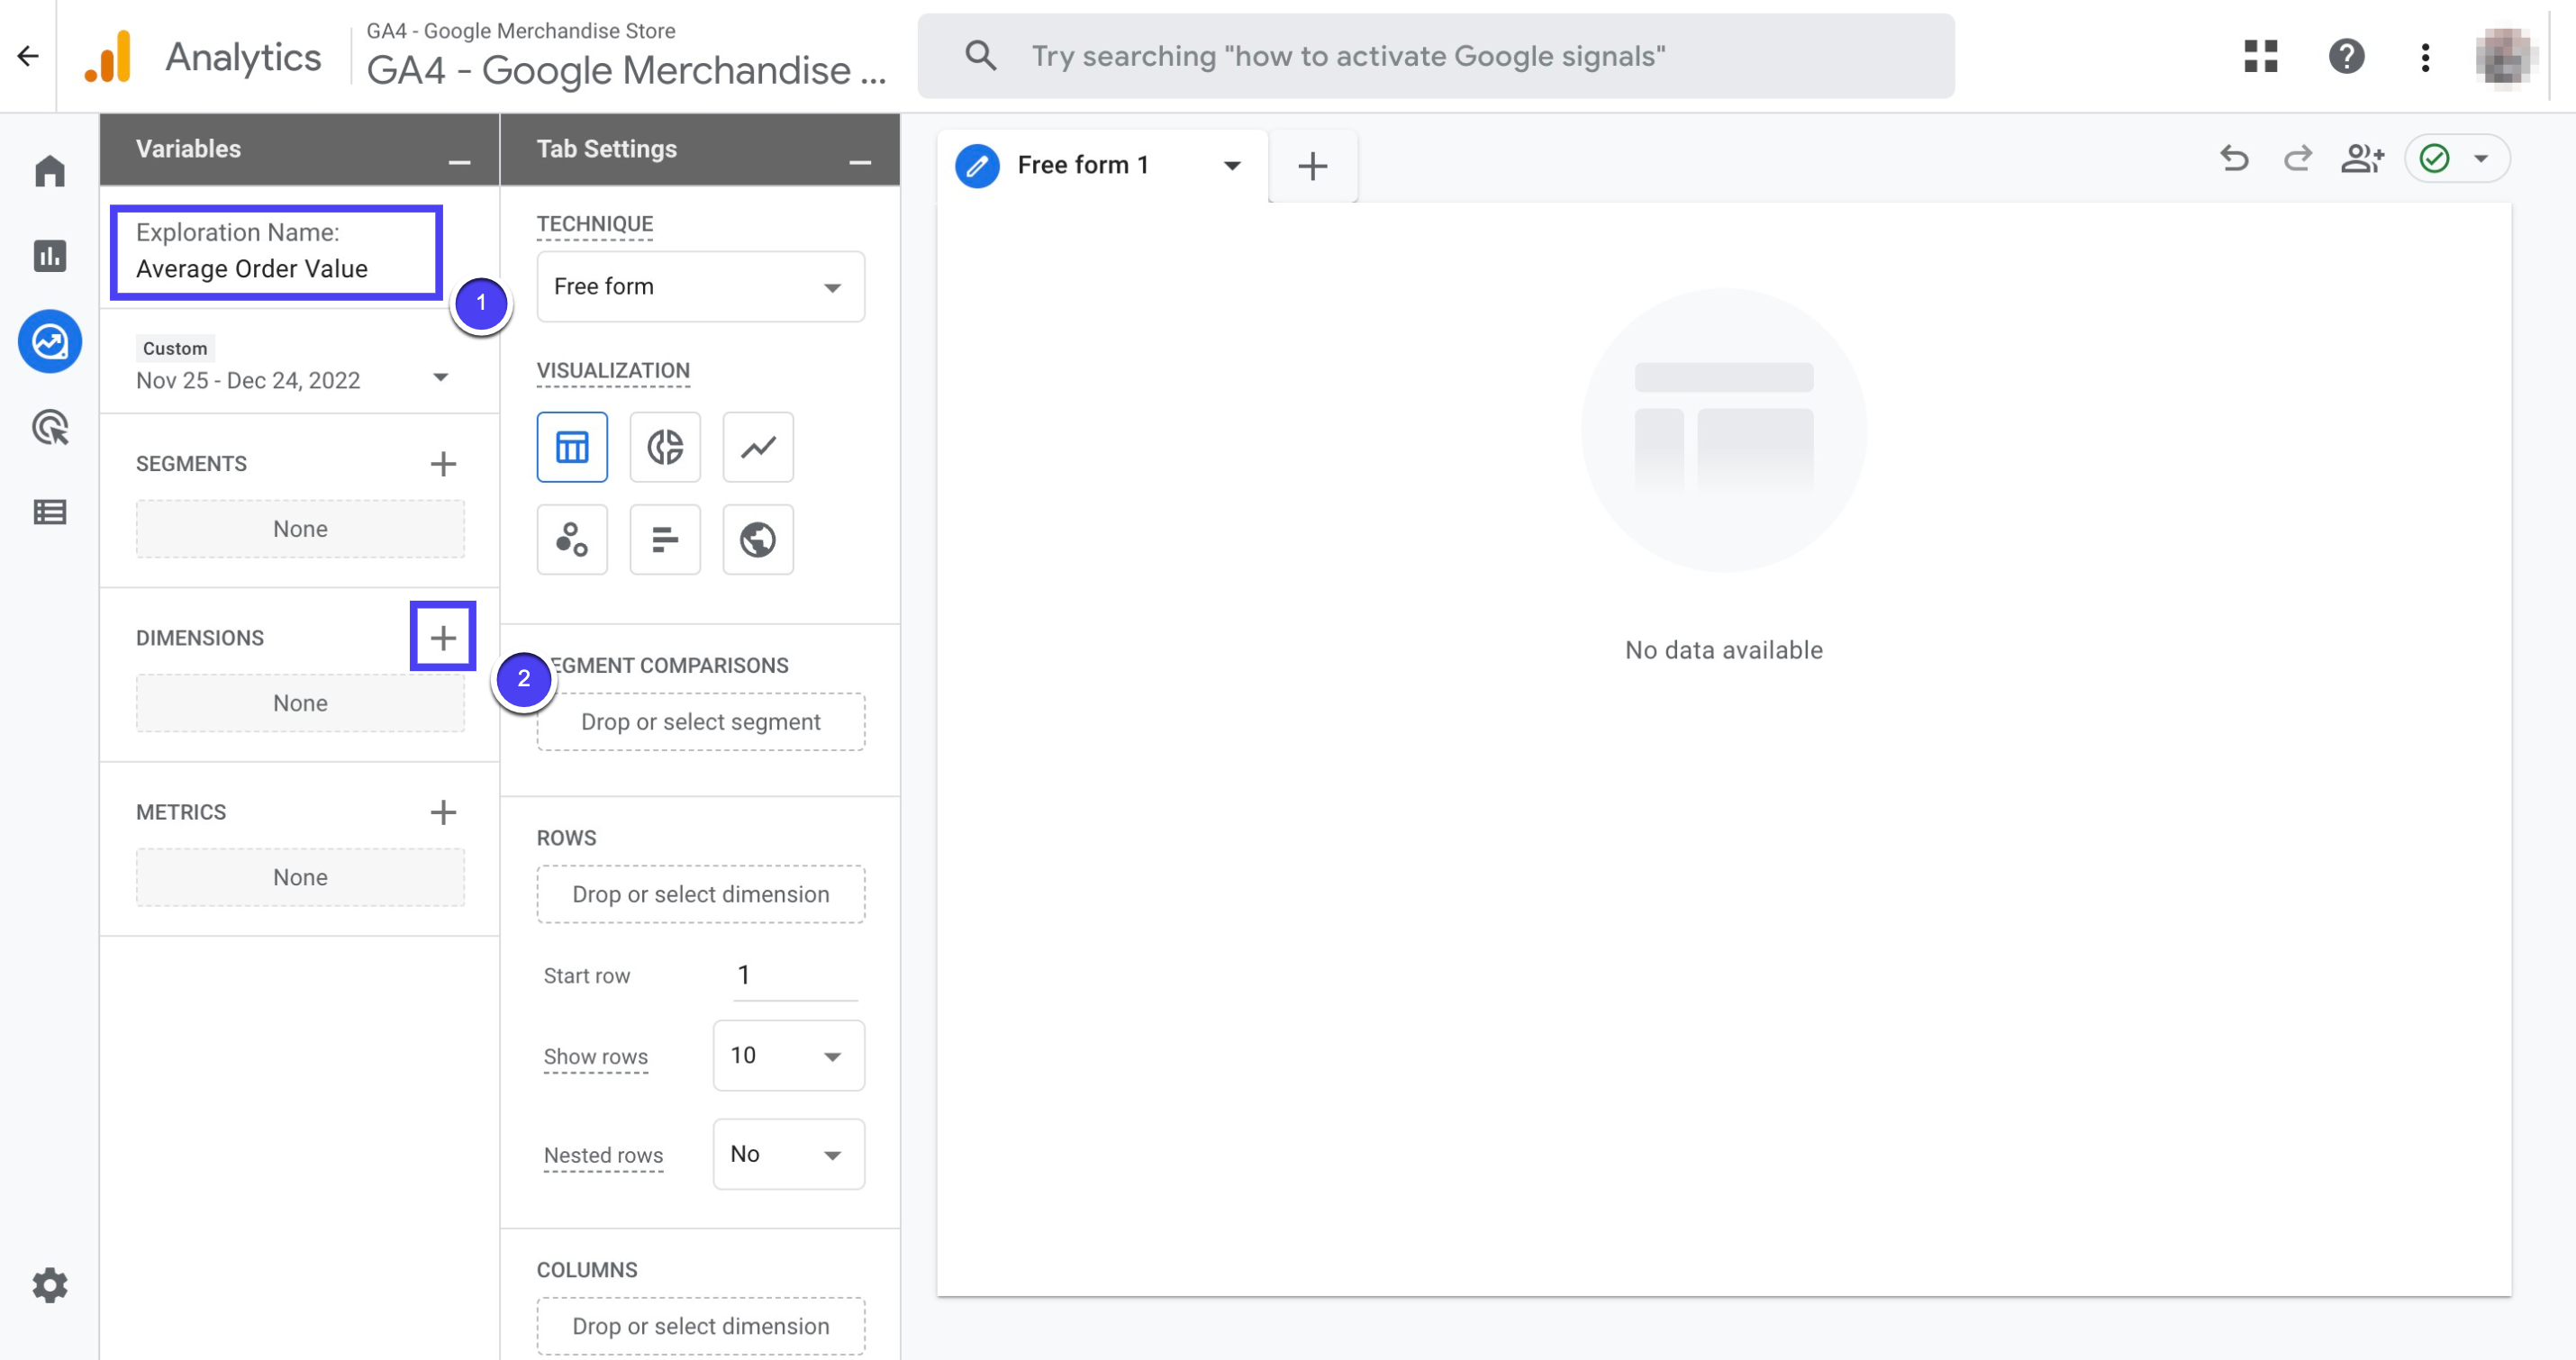
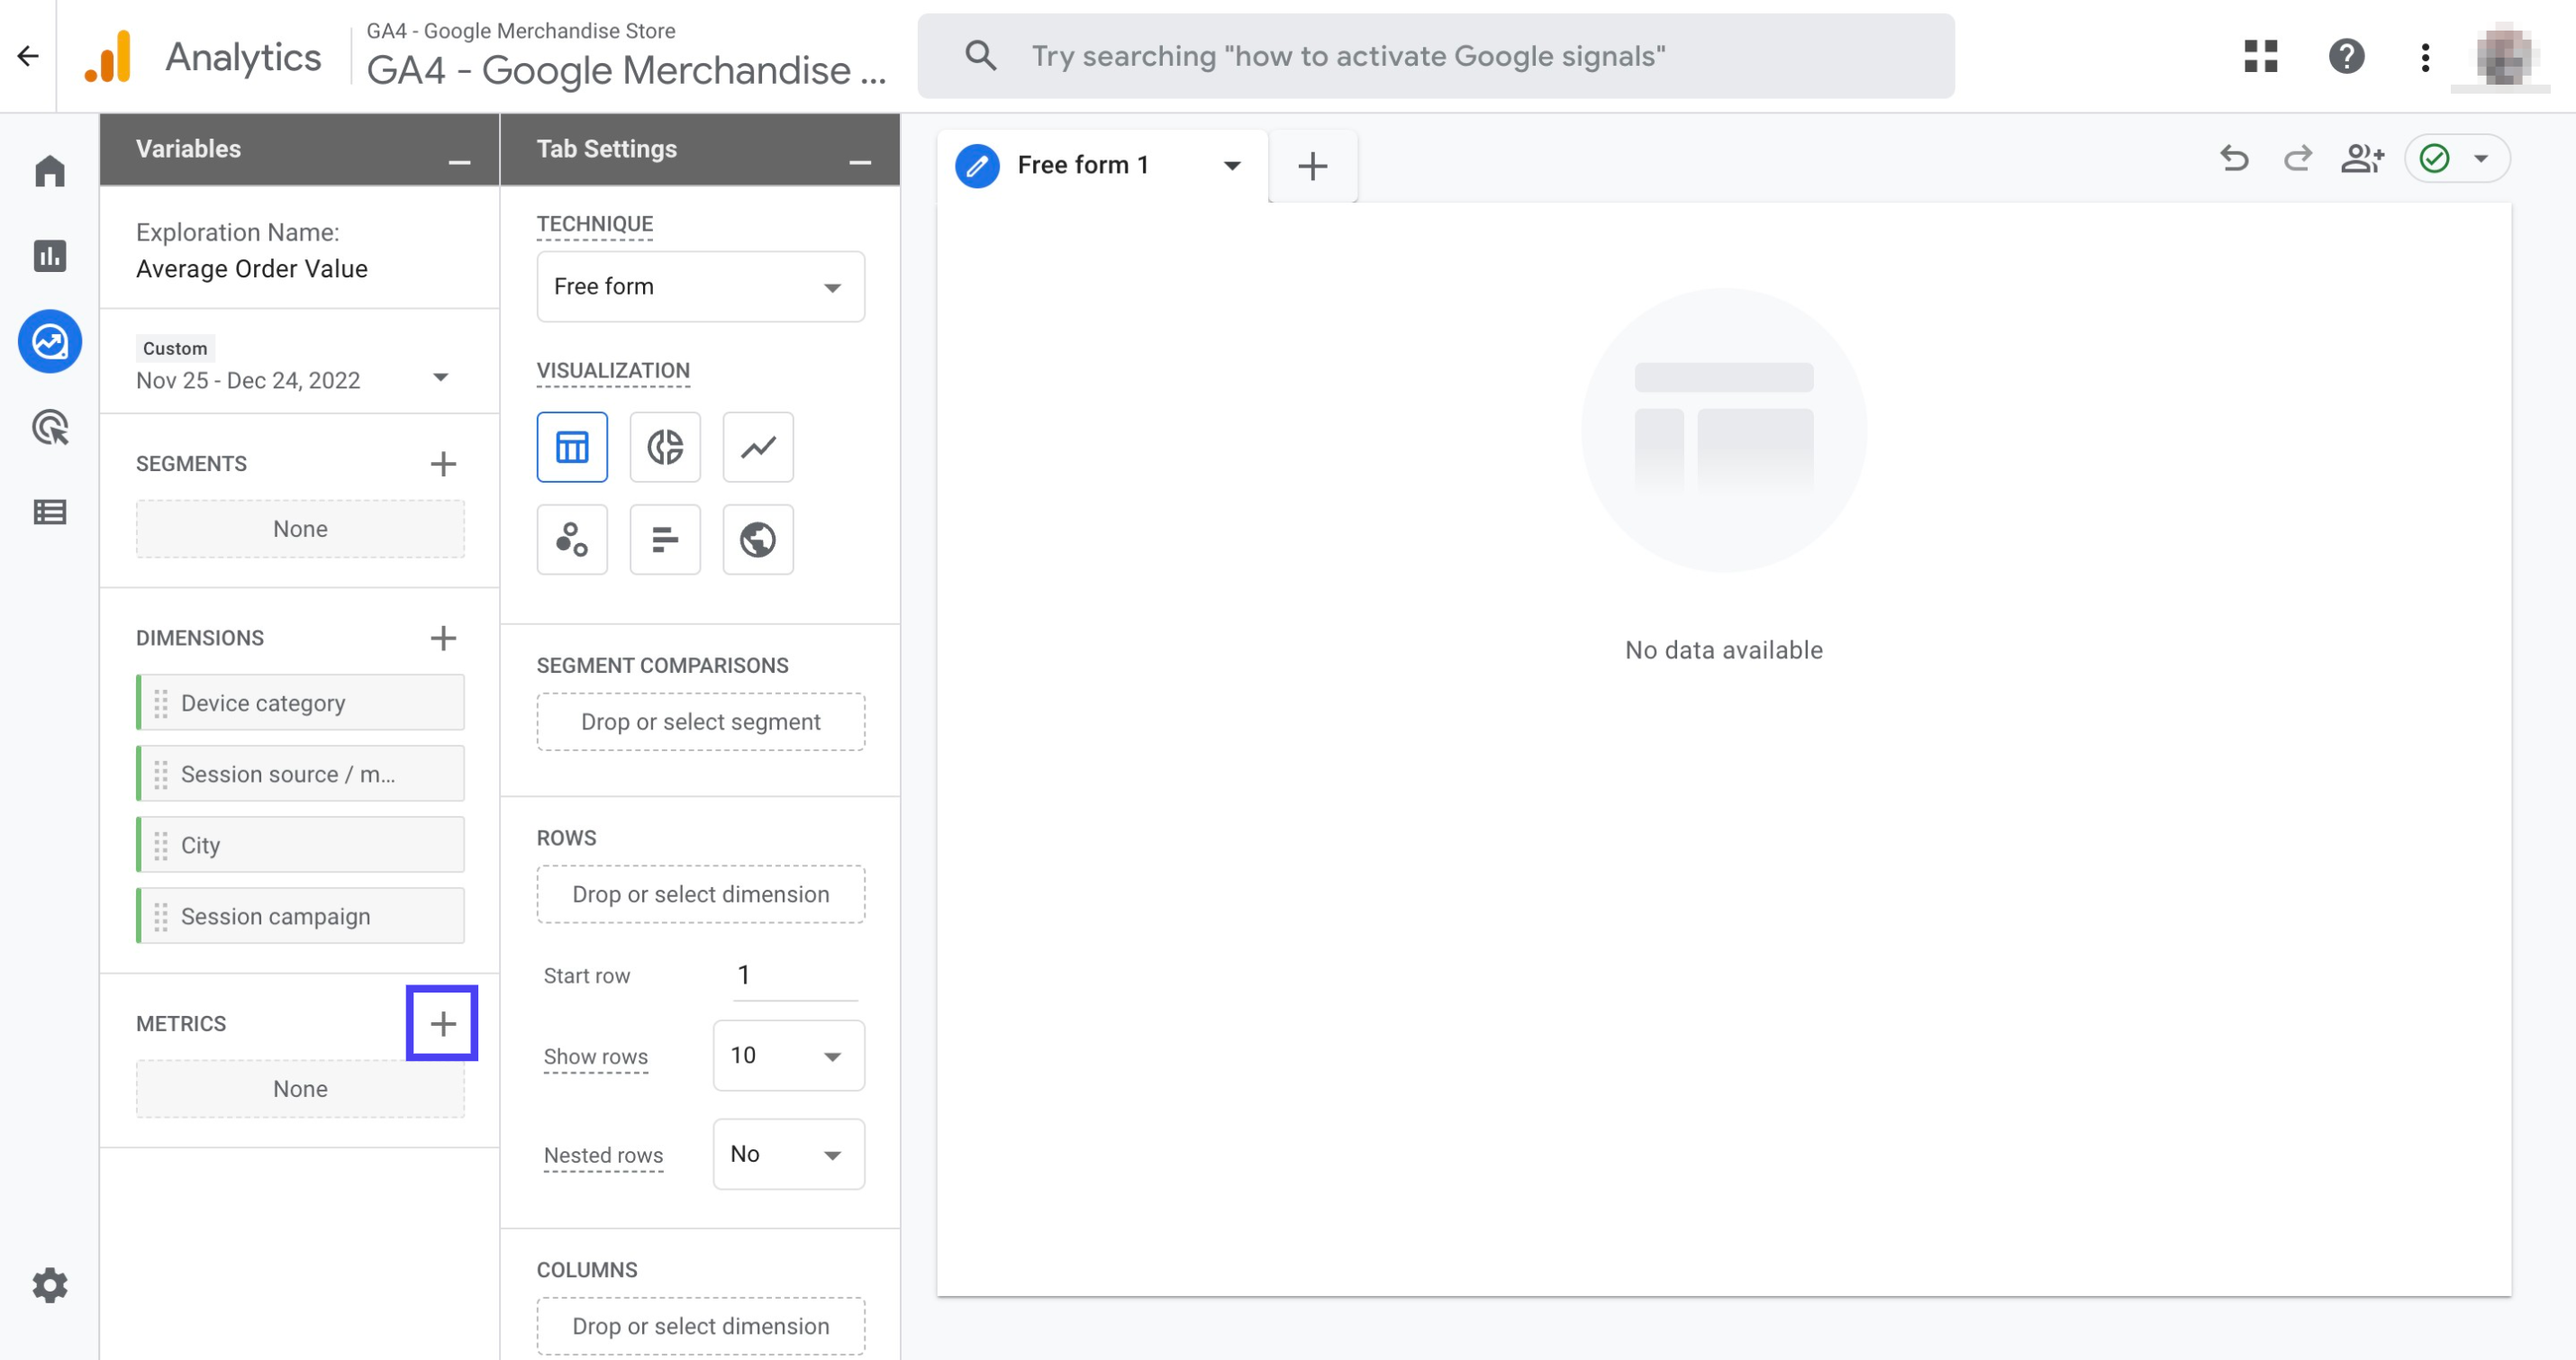
 3. Name your report as ‘Average Order Value’, and then click the plus icon next to Dimensions.
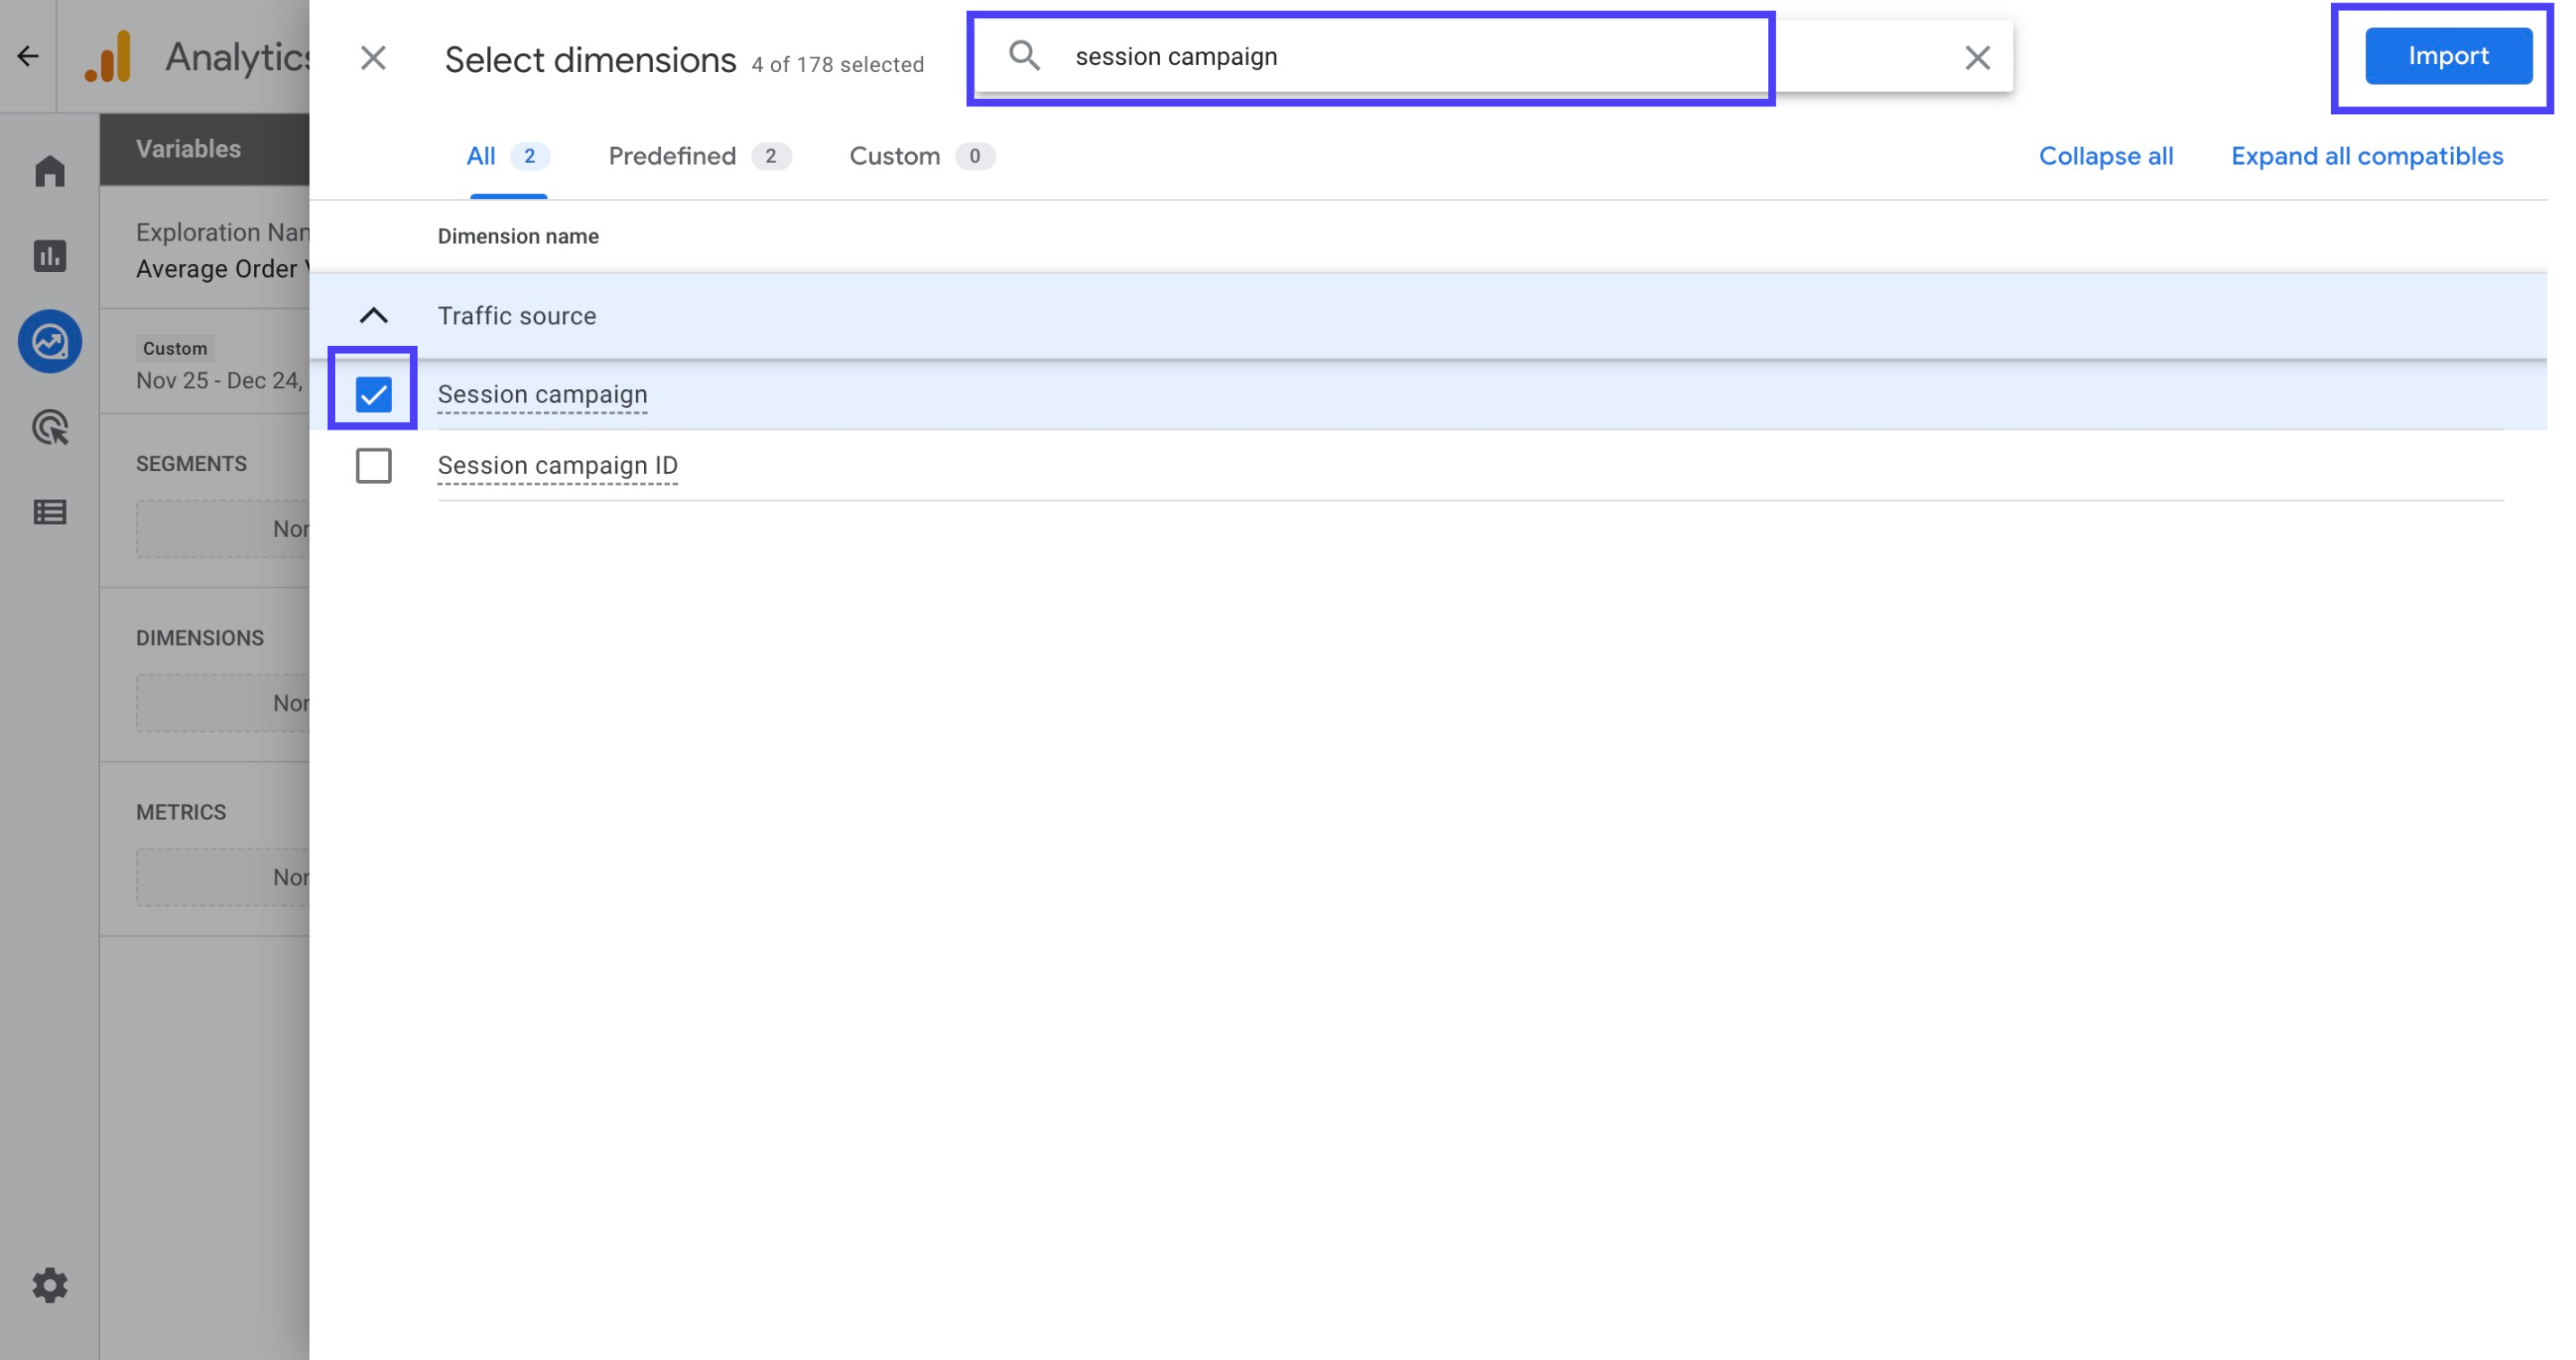
 4. Search for ‘Device category’, ‘Session source/medium’, ‘City’, and ‘Session campaign’ to add them to your report by checking the box and then clicking Import in the end.
 5. Click the plus icon next to Metrics.
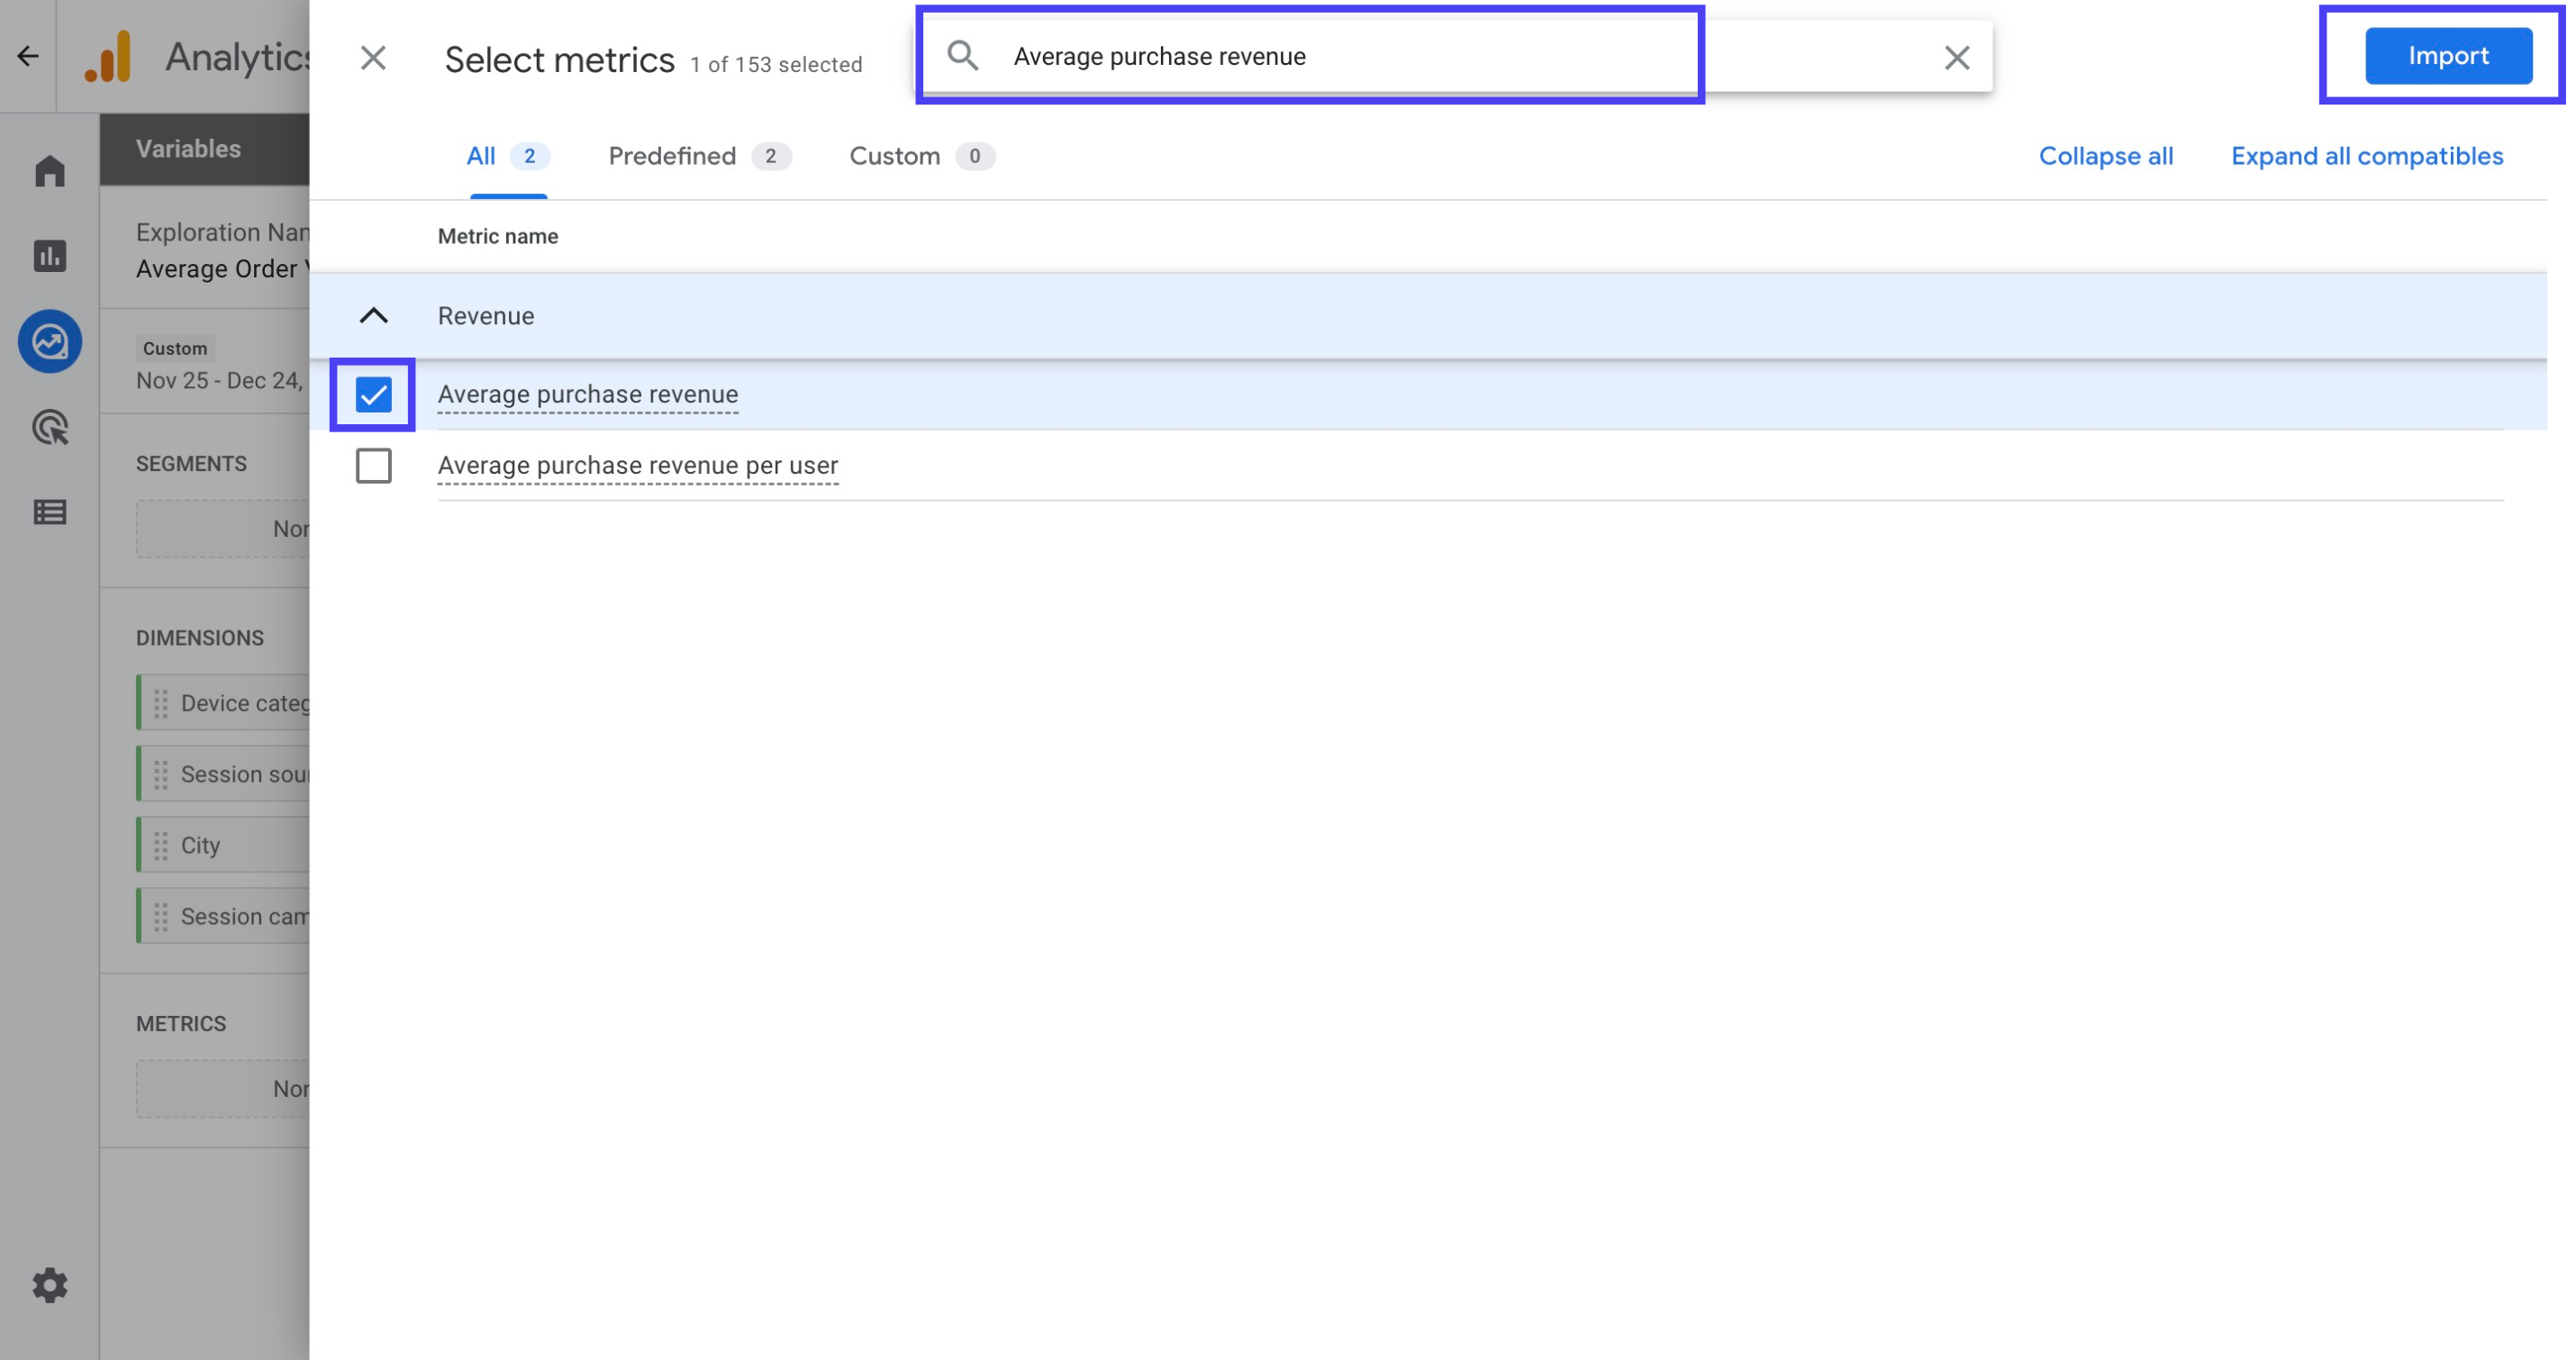
 6. Search for ‘Average purchase revenue’ and import it to your report.
 7. Choose a dimension to drag & drop it over to the Rows section. You can start with ‘Session source/medium’.
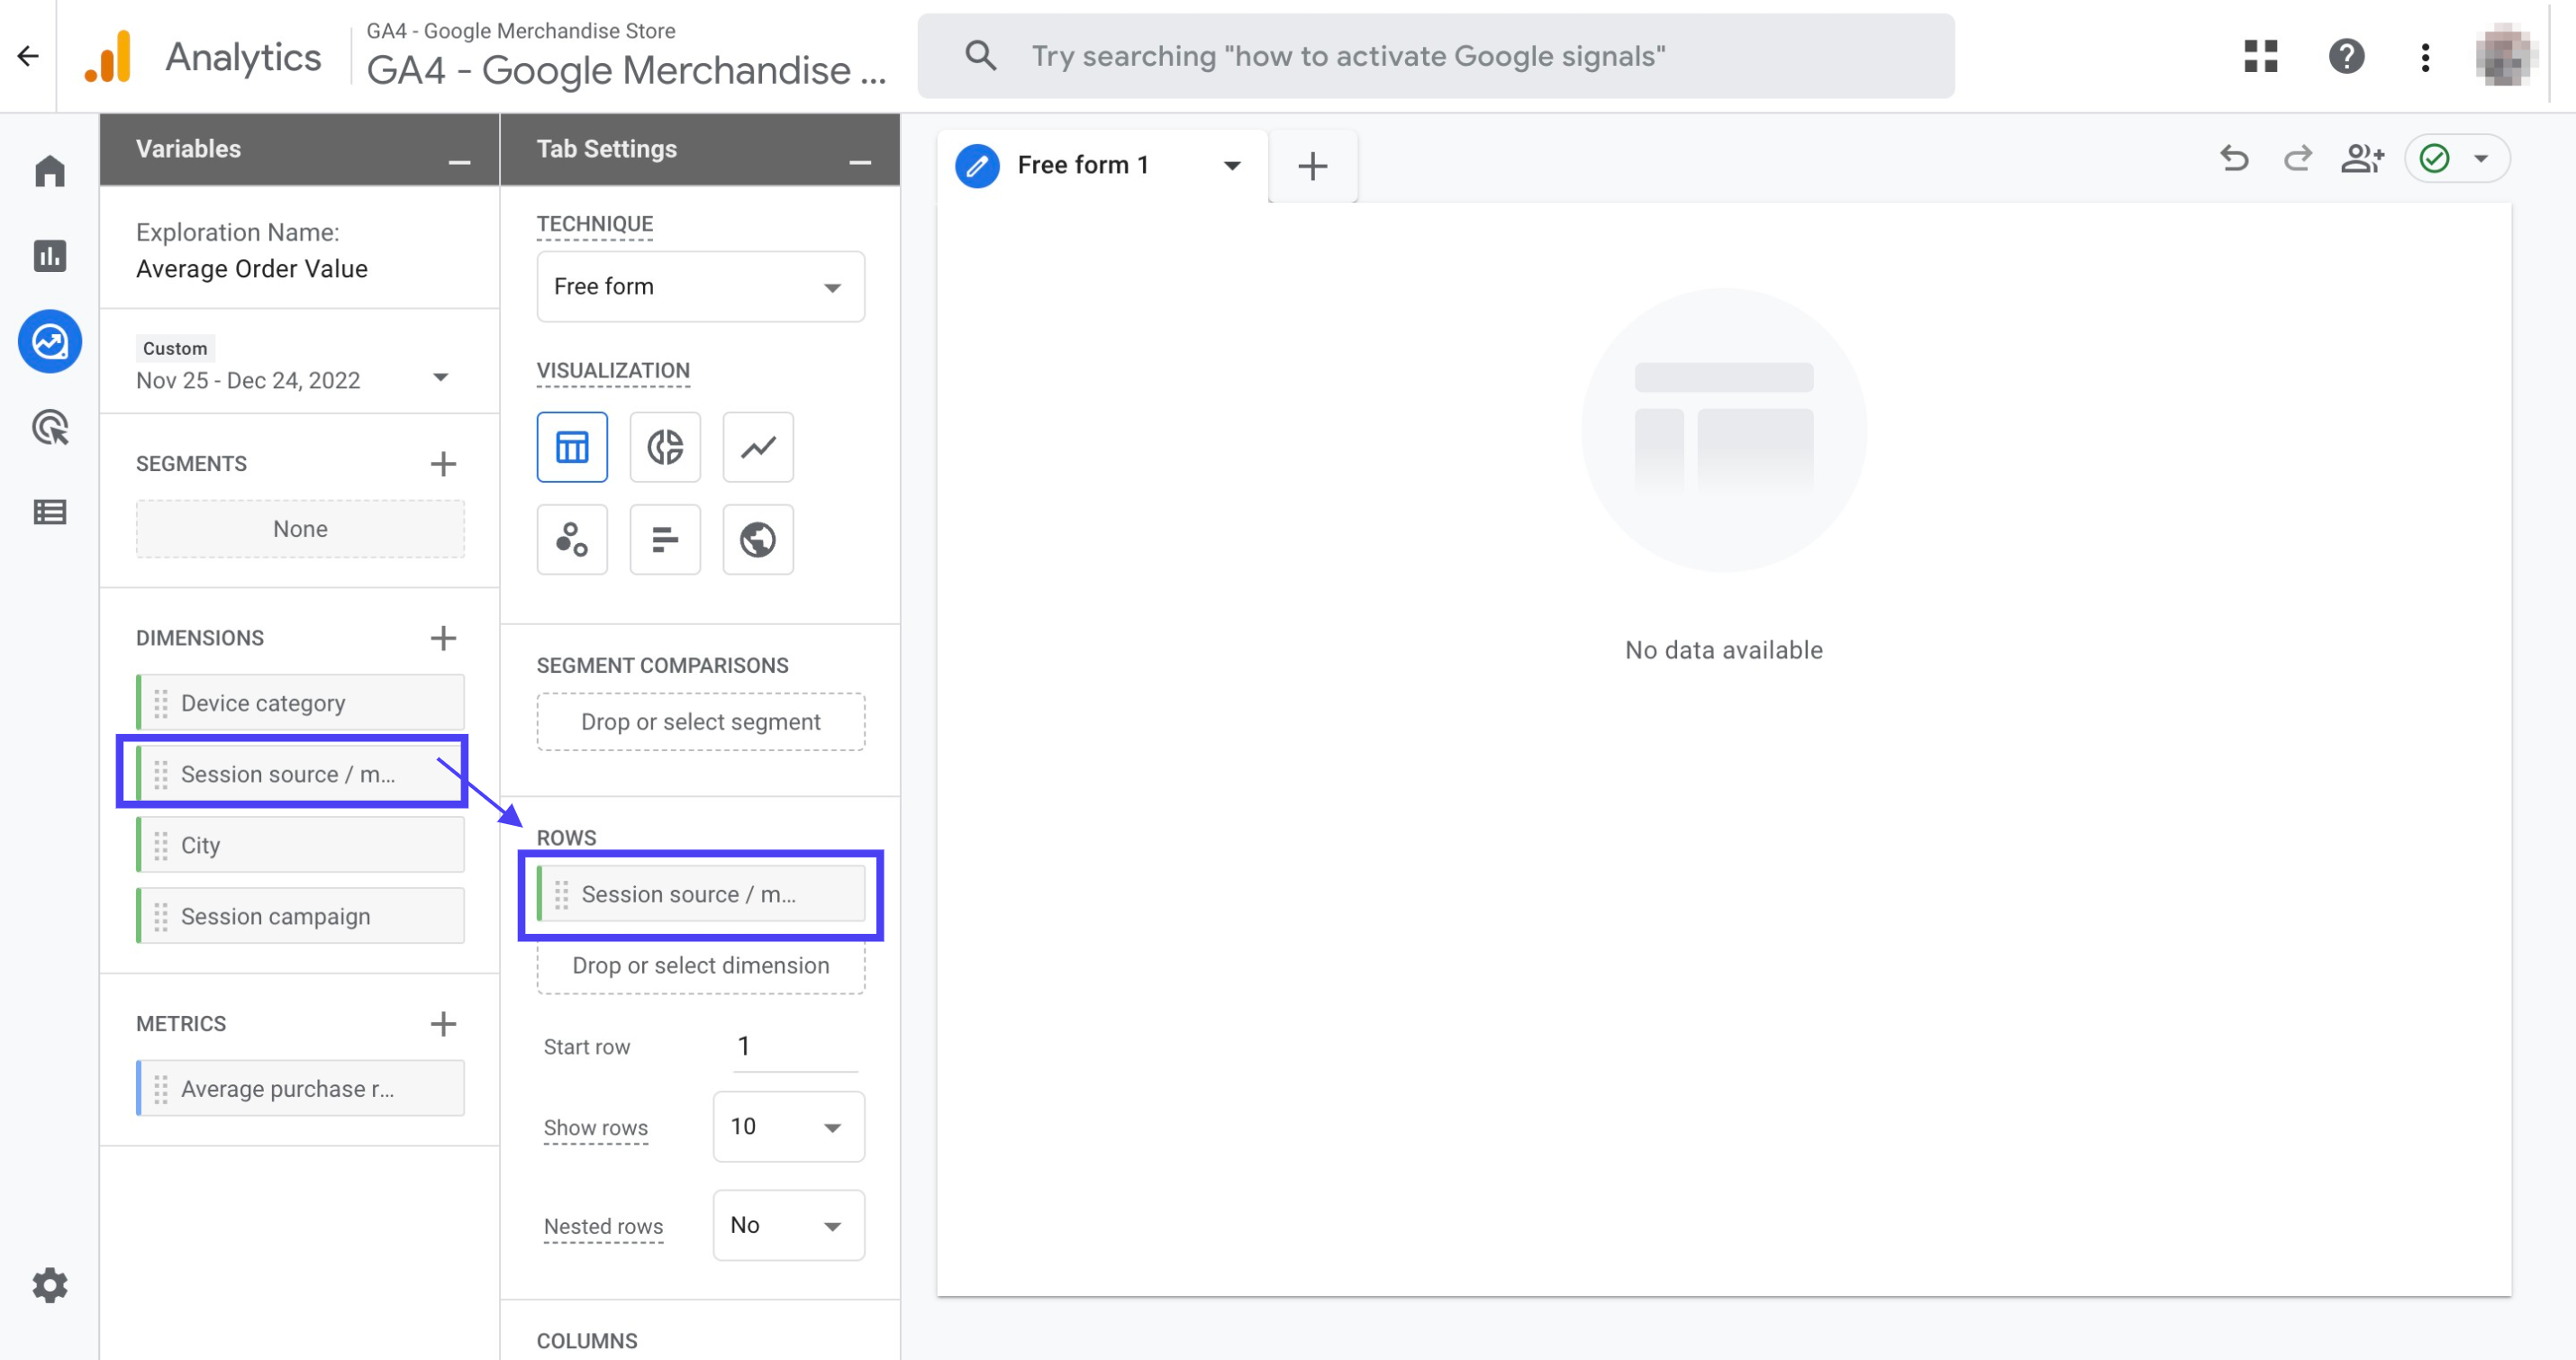 8. Move ‘Average purchase revenue’ from the Metrics over to the Values by dragging & dropping.
 9. Now, you can view the average order value (average purchase revenue in GA4) for each session campaign.
You can go ahead and play around with the other dimensions you added by removing session campaign and adding those instead in order to get further details from your data.
How to Increase Average Order Value? 5 Tips for Improving Average Order Value (AOV) in GA4
Usually, when customers shop online, they tend to buy only what they are looking for. However, with some strategies that you can use to increase average order value, you might be able to present customers with more useful products, which will result in more sales from each order.
Here are 5 tips for improving your average order value:
Cross-Sell Products: Scenario: A customer is looking for gloves for their fitness routine. You can cross-sell by suggesting lifting straps alongside the gloves. This way, you’re offering a complete workout package for wrist health.
Offer Free Shipping: Scenario: Many users hesitate to complete purchases due to shipping fees. For instance, after a user adds items to their shopping cart, you can display a banner saying “Enjoy Free Shipping on Orders Over $100.” This encourages them to add more items to avail of the free shipping option.
Give Volume Discounts: Scenario:Customers love discounts! For example, a customer adds $80 worth of products to their cart. If they see a message like “Spend $100 or more and get $15 off your order!” they might add more items to benefit from the discount.
Provide First-Time Offers: Scenario: First-time user offers are appealing to many customers. Let’s say a first-time visitor added a bracelet and necklace to their cart. If you inform them about discounted prices on certain rings because they’re a first-time visitor, you can motivate them to make more purchases.
Up-Sell Products: Scenario: A customer visits your store to buy a phone. After they select a phone they like and proceed to checkout, you can showcase a phone with higher features and a newer model. This encourages them to consider purchasing a higher-priced product.
After applying these 5 tips to increase the AOV in GA4, you should ask these questions:
Evaluate your marketing efforts: Are you targeting the right audience? Are your ads effective? Are you running enough promotions?
Understand your customer behavior: What are your customers buying? How much are they spending? What are their pain points?
Tailor your marketing efforts and product offerings: Are you offering the right products to the right people? Are your prices competitive? Are you providing enough value?
Adjust your pricing strategies: Can you offer discounts for larger orders? Can you bundle products together?
Benchmark your performance against industry standard: How does your AOV compare to other online stores?
Monitor your overall performance: Are you seeing any trends in your AOV? Are there any areas where you can improve such as better eCommerce product pages?
By tracking your AOV and making changes to your marketing, pricing, and product offerings, you can improve your sales performance and grow your business.
Another strategy that should be among your sales strategies is to use Google Shopping Ads effectively. You can find more details about this topic in our blog post
Relevant Metrics and KPI’s to Keep in Mind Analyzing AOV in GA4
Conversion Rate (CR) If your AOV in GA4 is high but your conversion rate is low, this indicates that your products are being purchased mainly by high-value customers. This situation suggests that you might not be fully tapping into the true potential of your products.
Customer Segmentation It’s important that your sales aren’t driven by a single customer segment. Otherwise, you might not be reaching a wide audience, and the progress of your store could be dependent on a specific subset of customers. Therefore, it’s necessary to analyze AOV based on different customer segments.
Profit margin AOV increases are good, but make sure they don’t come at the cost of profit margins.
Promotional impact If promotions are driving AOV increases, make sure they’re sustainable and not distorting customer behavior. If you offer too many promotions, you may be cannibalizing your regular sales and reducing your profit margins
Purchase frequency Monitor AOV increases alongside purchase frequency to make sure customers are spending more on each order and not just making fewer purchases overall. If your purchase frequency is declining, it could mean that customers are spending more on each order but less frequently overall.
Conclusion
In conclusion, the average order value (AOV) in GA4 is an important metric that you should keep your eyes on for your ecommerce store. Calculating & understanding it can provide insight into the purchase behavior of your customers, allowing you to see what items customers are buying and how much they are spending.
By tracking this metric and understanding how it influences customer behavior, you can optimize your pricing and promotions, and drive more sales. Therefore, the AOV can be a great means for you to increase your revenue, maximize customer satisfaction, and stay competitive in the digital marketplace.