
For years, digital marketers and business owners have been seeking practical ways to understand their data in the broader market context.
Benchmarking in GA4 directly addresses this need by providing reference metrics so you can make comparisons against others in your industry.
Here, we are exploring:
- Details of benchmarking in GA4
- How to use this new feature
- All the metrics provided
- What it might mean for your business
along with practical examples and use cases so you can get the most out of it easily.
What is Benchmarking in GA4?
At its core, GA4’s benchmarking feature serves as your competitive compass.
Google’s new GA4 feature processes anonymized, aggregated data from websites within your industry sector, providing a reliable baseline for comparison.
Unlike static benchmarks that quickly become outdated, GA4 refreshes this comparative data every 24 hours, ensuring you always have access to current, relevant insights.
The system maintains strict privacy standards through robust encryption and protection protocols.
This ensures that while you gain valuable industry insights, individual website data remains confidential and protected.
The aggregated nature of the benchmarks means you can trust the comparisons without compromising anyone’s privacy.
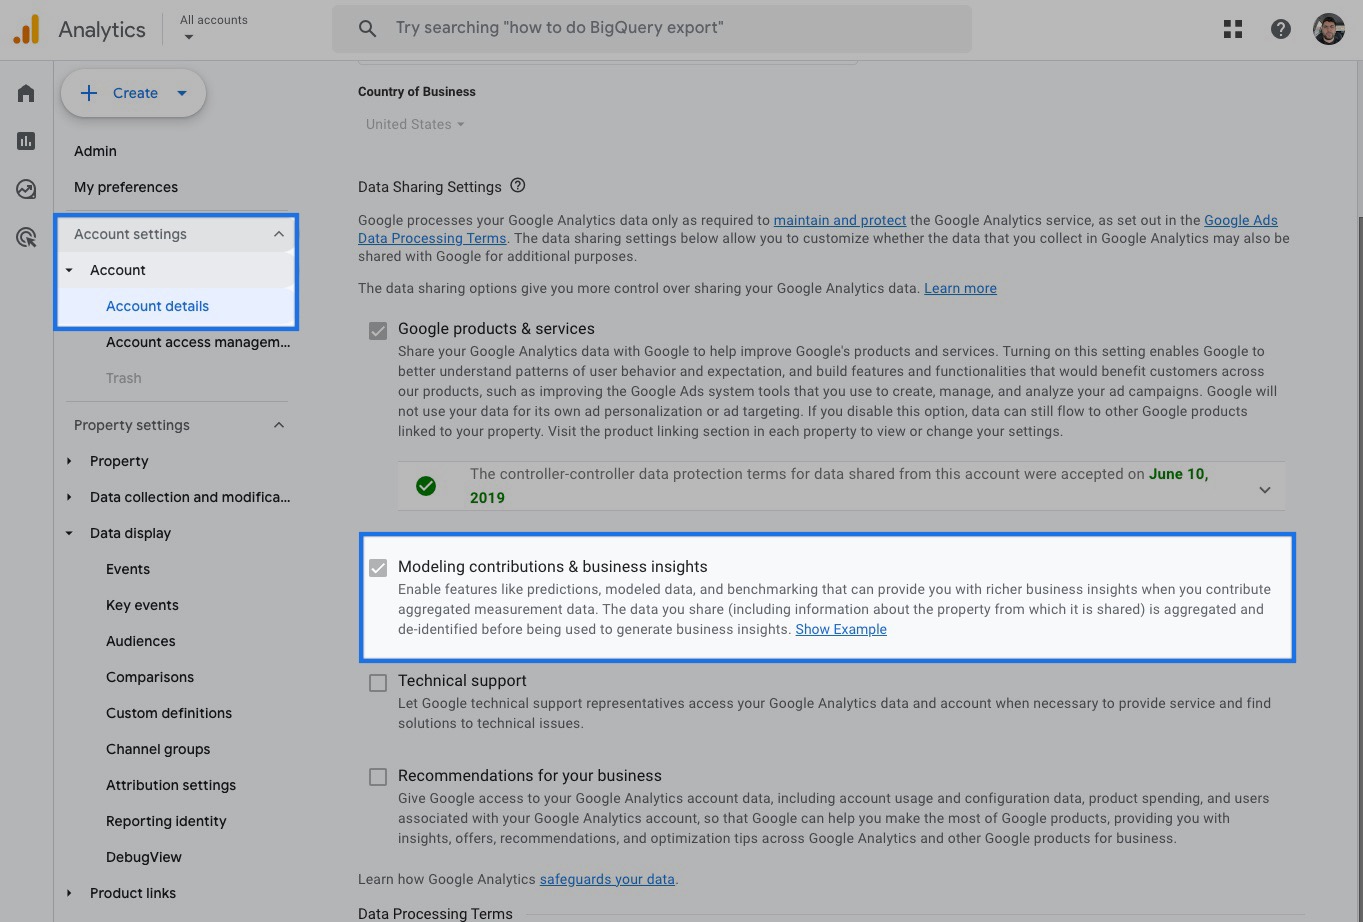
How to Activate Benchmarking in GA4?
To activate benchmarking in GA4 and compare your data against other businesses, you need to follow the steps below:
Go to GA4 Admin settings Access Account Settings Enable “Modeling contributions & business insights”
Once activated, you gain access to an extensive suite of over 30 benchmark metrics.
This comprehensive set of measurements allows you to track your performance across multiple dimensions.
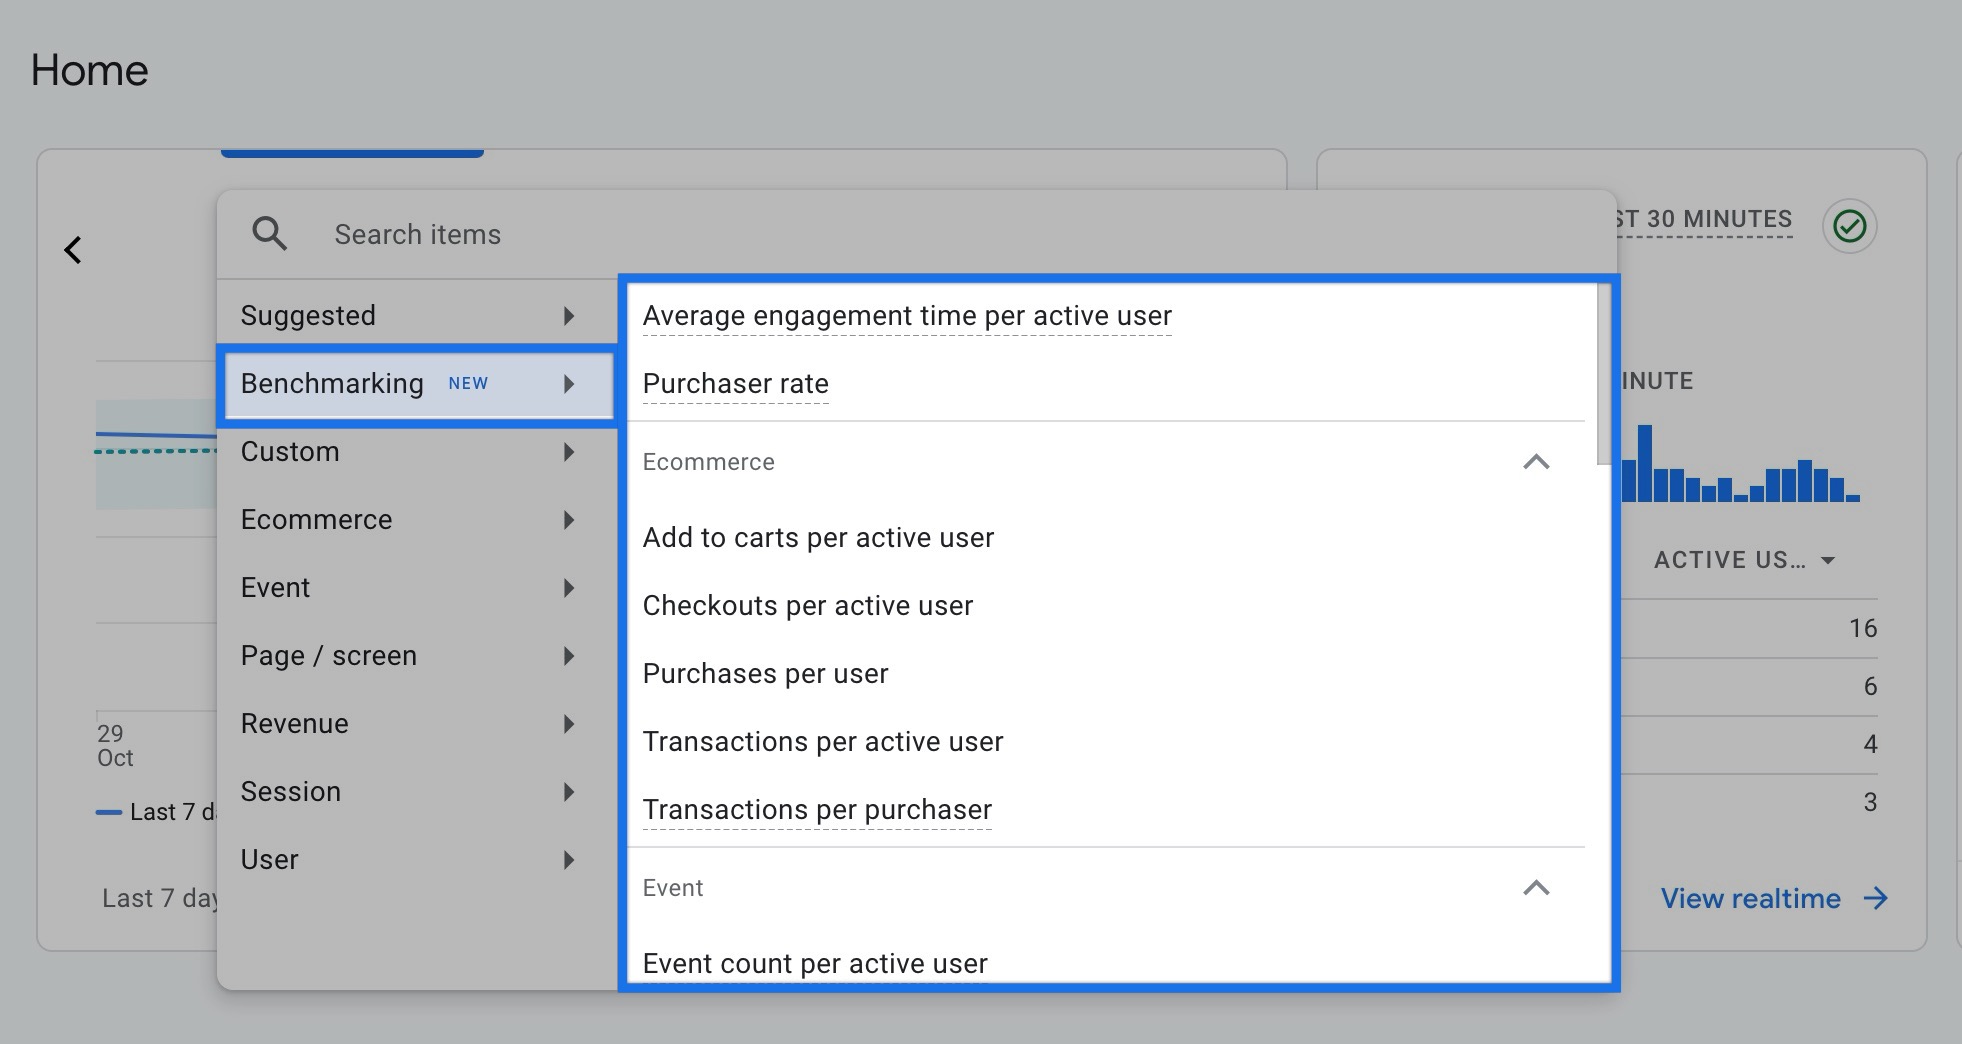
Which Metrics Are Available for Benchmarking in GA4?
There are over 30 benchmark metrics available in Google Analytics. These are placed under categories such as ecommerce, event, page/screen and so on:
Once you click to expand these benchmarking metrics categories, you will see thirty metrics including:
- New user rate
- Average engagement time per session
- Average engagement time per user
- Average session duration
- Engagement rate
- Engaged sessions per user
- Event count per user
- Events per session
- Session key event rate
- Sessions per user
- User key event rate
- Views per session
- Views per user
- Bounce rate
- Daily active users / Monthly active users (DAU / MAU)
- Daily active users / Weekly active users (DAU / WAU)
- Weekly active users / Monthly active users (WAU / MAU)
- Add to carts per user
- Average revenue per user (ARPU)
- Average revenue per paying user (ARPPU)
- Average purchase revenue per user
- Checkouts per user
- First-time purchaser rate (FTP rate)
- First-time purchasers per new user
- Paying monthly active users / Daily active users (PMAU / DAU)
- Paying weekly active users / Daily active users (PWAU / DAU)
- Total ad revenue per user
- Transactions per purchaser
- Transactions per user
These metrics help you understand not just how many users are converting, but how efficiently your site guides them toward conversion goals.
Ecommerce websites benefit from transaction-focused metrics that provide insight into customer behavior patterns and monetization efficiency.
For websites focused on engagement, several key metrics deserve attention.
The engagement rate shows how well your content resonates with visitors, while average session duration indicates the depth of user interaction with your site.
The new user rate helps you understand your success in attracting fresh audiences compared to industry standards.
Important GA4 Benchmarking Metrics for Shopify Stores
Understanding which benchmarking metric is crucial for your business is crucial in making the most of GA4’s benchmarking capabilities.
For example, if you have a Shopify store, some of the benchmarking metrics you can analyze include:
- Purchases per user
- Average purchase revenue
- ARPU (Average Revenue Per User)
- Engagement rate
- New user rate
For example, let’s say you are selling eco-friendly kitchen products on your Shopify store. Once you check out your benchmarking data in GA4, you discover:
- While customers are buying, they’re making fewer repeat purchases compared to competitors.
- Your store’s average cart value is significantly higher than most competitors
- Your average revenue per user is slightly above the average
- Your engagement rate is ranked well among competitors
- Your new new user rate is lower than the average
Based on such an analysis using GA4 benchmarking, you can:
- Focus on encouraging repeat purchases through targeted email campaigns and a loyalty program
- Maintain & improve your product bundling strategy
- Leverage your decent engagement rate by converting more engaged users into customers
- Invest in customer acquisition channels like paid advertising and SEO
- Consider implementing a referral program to tap into your engaged customer base for new user acquisition
How to Analyze Benchmarking Data in GA4?
Once you take a look, you may come up with questions such as:
- What does 75th percentile mean?
- What is Peers’ median?
- What to understand from 25th percentile?
Let’s see what they represent and how you can analyze benchmarking data in GA4 easily:
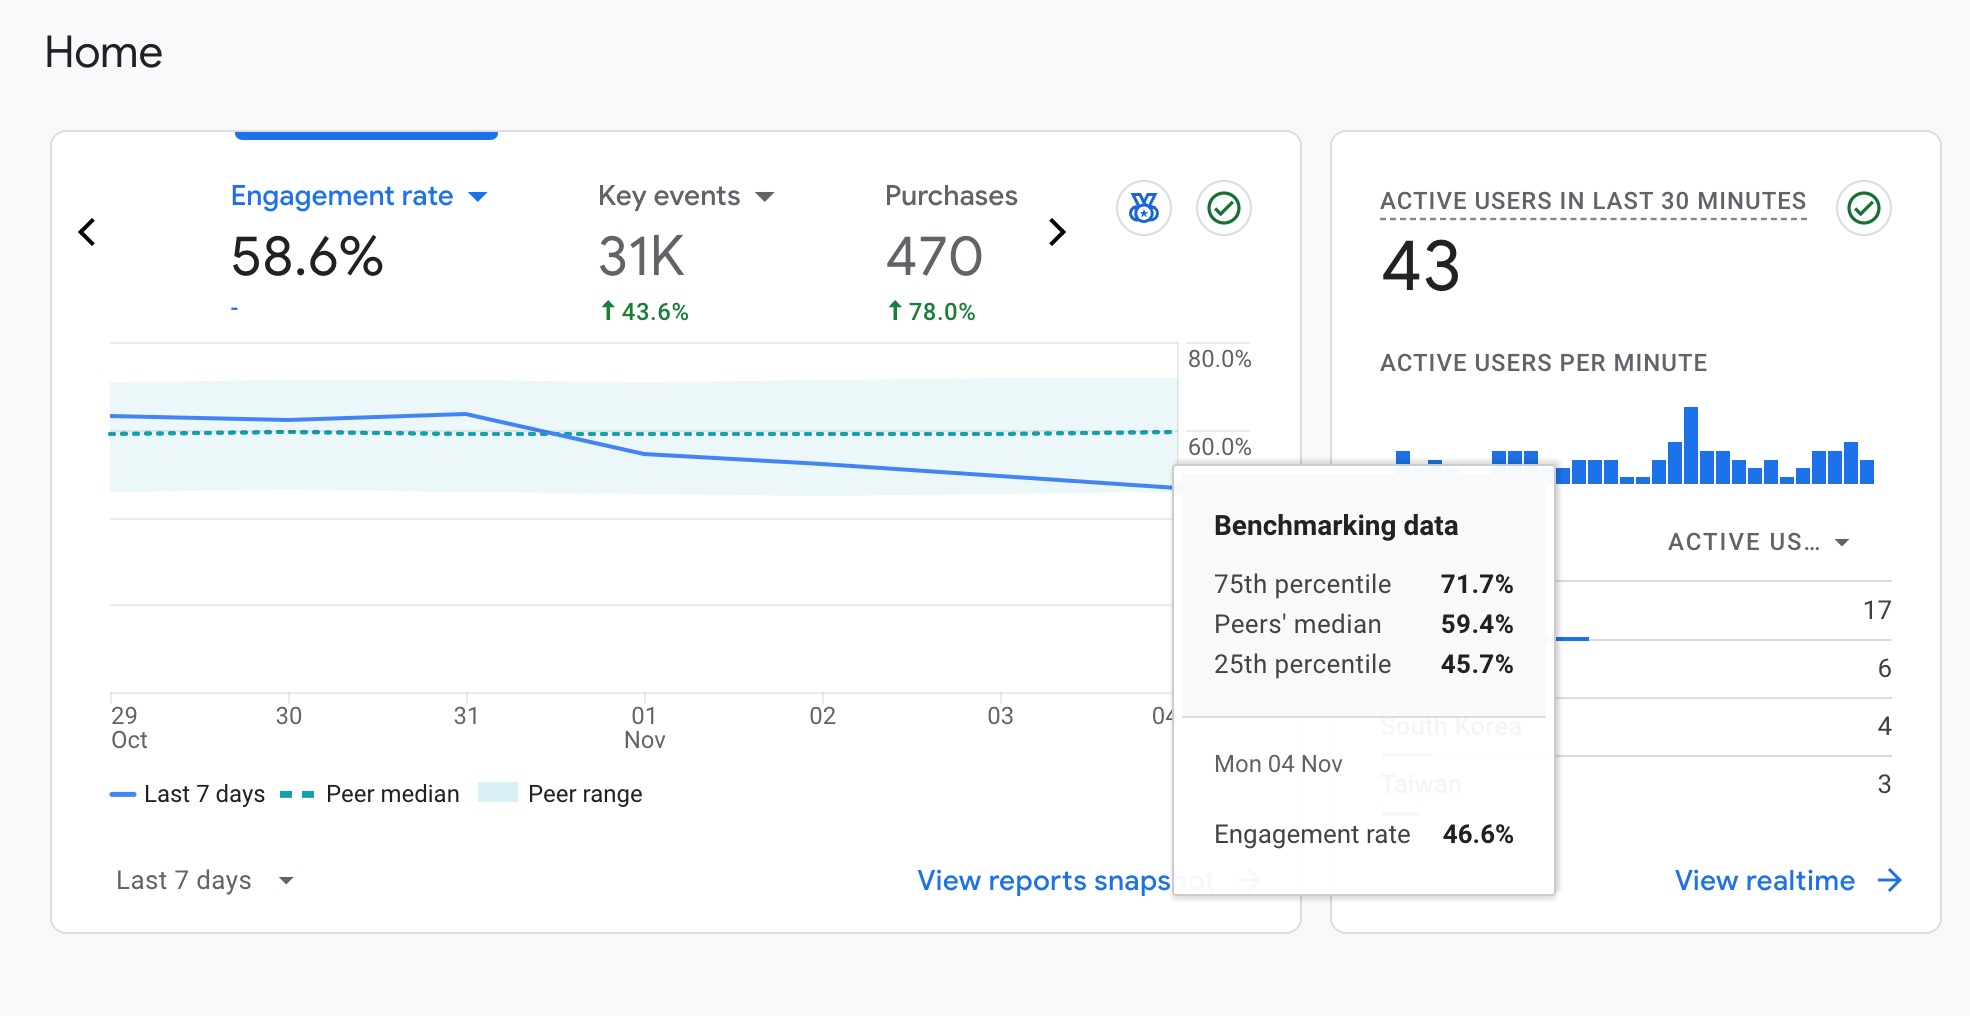
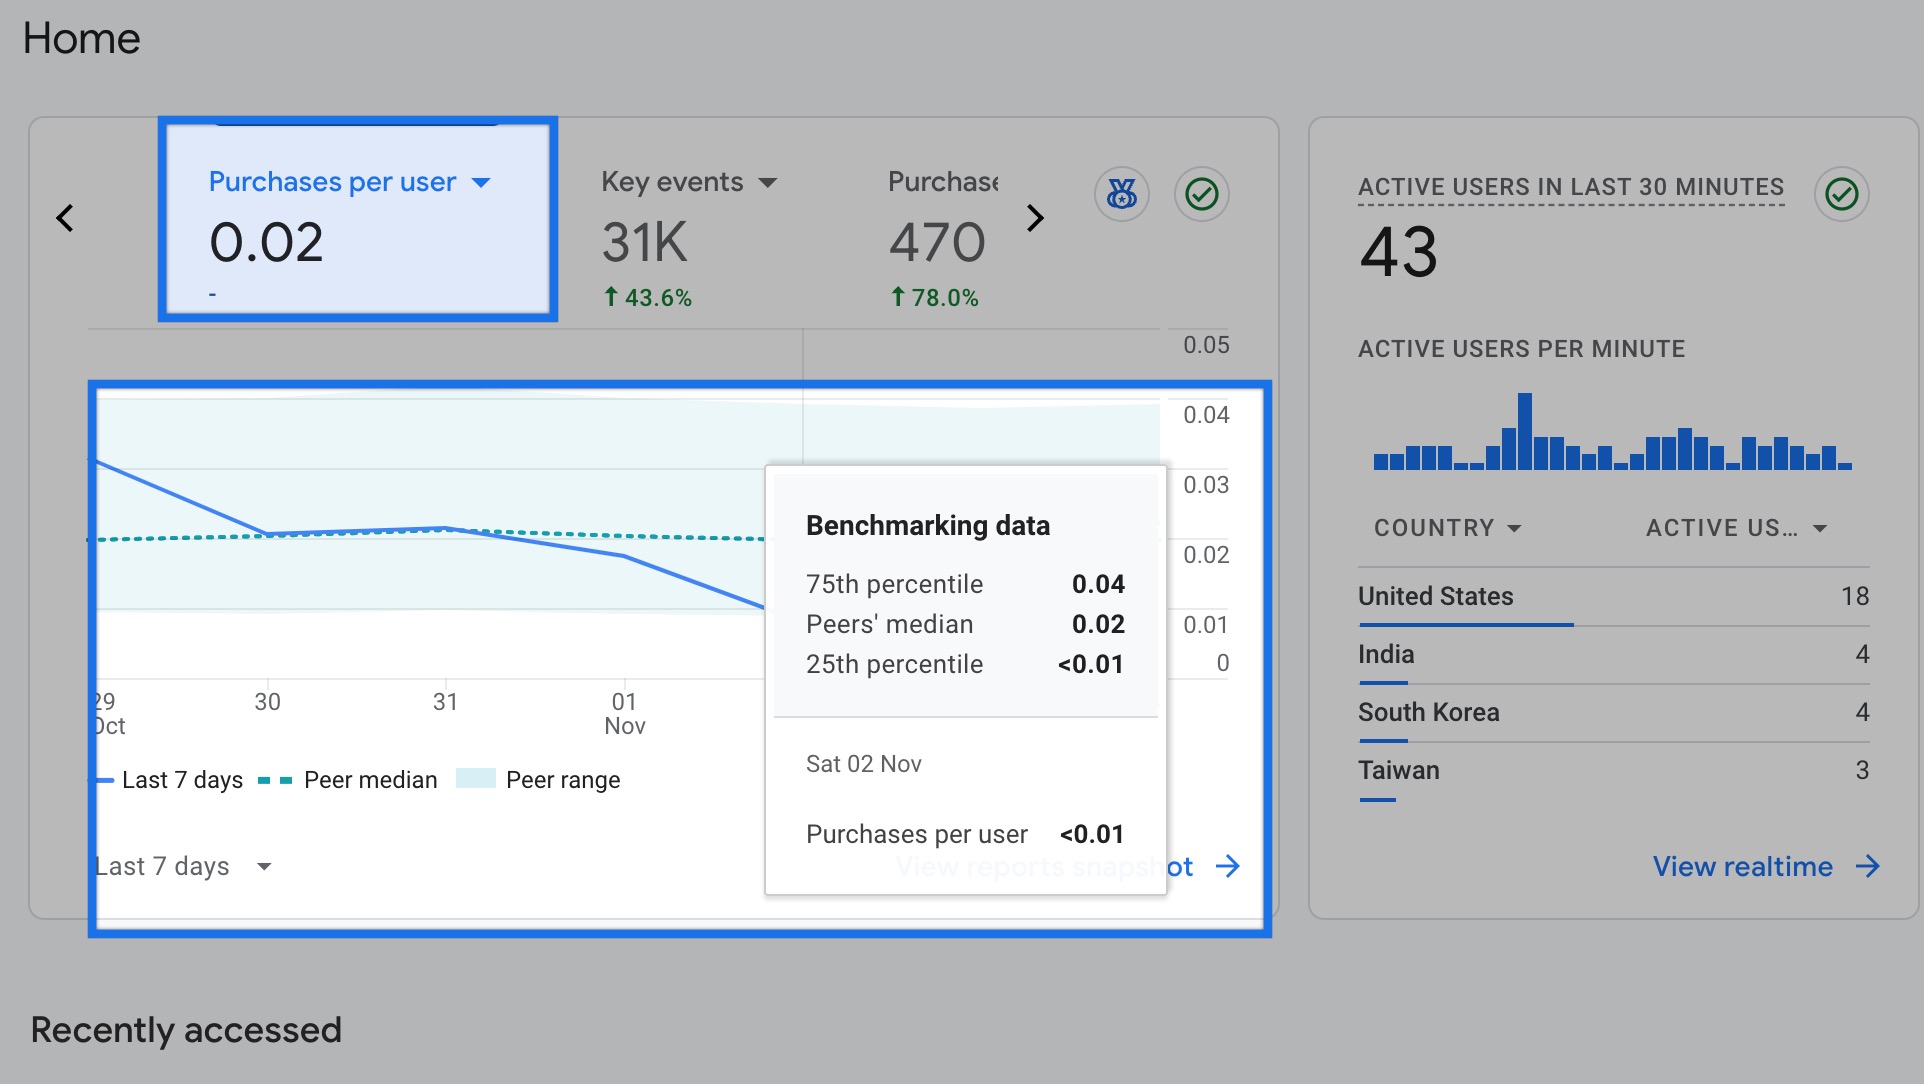
The percentile readings in GA4 benchmarking carry specific significance:
- 75th Percentile: Indicates top industry performance, showing what’s achievable
- Median (50th Percentile): Represents typical industry performance
- 25th Percentile: Signals potential areas needing improvement
GA4’s benchmarking interface presents data through an intuitive visualization system that makes complex comparisons accessible.
The interface features a dotted line representing the median performance within your peer group, providing a clear reference point for your own metrics.
This median line is accompanied by a shaded area showing the interquartile range – the middle 50% of performance data that excludes extreme outliers.
Your own performance appears as a solid line, making it easy to see where you stand in relation to industry standards.
Why Should You Use Benchmarking in GA4?
GA4’s benchmarking capabilities provide valuable insights that can transform your data analysis and decision-making process.
With actionable insights, this feature can let marketers and business owners:
- Make data-driven decisions based on industry standards
- Identify specific areas where they’re underperforming
- Set realistic, achievable improvement goals
- Track the effectiveness of their optimization efforts
- Stay competitive their your industry
Therefore, whether you’re looking to optimize your marketing spend, improve user engagement, or increase conversion rates, benchmarking in GA4 can provide some of the context needed.
Let’s have a look at what Google’s newly introduced feature offers:
30 Benchmarking Metrics to Use in GA4
One of the most compelling aspects of GA4’s benchmarking is its extensive metric coverage.
With access to over 30 different benchmark metrics spanning acquisition, engagement, retention, and monetization, you gain a holistic view of your performance within your industry.
This comprehensive data allows you to identify both strengths and areas needing improvement across all aspects of your website/business.
Peer Groups in Benchmarking in GA4
The peer group system is another powerful feature that sets GA4’s benchmarking apart.
Rather than comparing your performance against dissimilar businesses, you can analyze your metrics against truly relevant competitors.
The flexibility to switch between different industry verticals, or “Peer Groups,” is particularly valuable if your business spans multiple categories.
For instance, an online fashion retailer with a strong content marketing strategy might benefit from comparing their metrics against both ecommerce and publishing benchmarks.
Daily Updates
Daily benchmark updates ensure you’re always working with current, relevant data.
This frequent refresh rate allows you to spot trends quickly and respond to changes in your industry promptly.
Whether you’re analyzing seasonal patterns or measuring the impact of a new marketing campaign, you’ll have access to timely comparative data to inform your decisions.
Consider this practical example: A website’s analytics might show a 40% engagement rate, which in isolation could seem acceptable.
However, when benchmarking reveals the industry median is 55%, with top performers achieving 70%, it becomes clear there’s significant room for improvement.
This context can justify investing in enhanced user experience or content quality improvements that might otherwise have seemed unnecessary.
Analysis & Goal Setting
Additionally, benchmarking in GA4 helps in goal setting and strategy development.
Instead of arbitrary targets, you can set realistic, data-driven goals based on actual industry performance.
If your conversion rate is in the 25th percentile, you might set an initial goal to reach the industry median, with a long-term aim of joining the 75th percentile performers.
By comparing multiple metrics simultaneously, you can identify correlations and patterns that might not be apparent when looking at your data in isolation.
This comprehensive view enables more strategic decision-making and more effective resource allocation.
Frequently Asked Questions about Benchmarking in GA4
Here are the most common questions about Google Analytics’ new feature:
Is Benchmarking in GA4 available to all?
While GA4 benchmarking is widely available, access to this feature may depend on meeting certain criteria such as sufficient data volume.
The feature typically works by default in most GA4 accounts, provided they have sufficient data volume and have enabled the “Modeling contributions & business insights” setting.
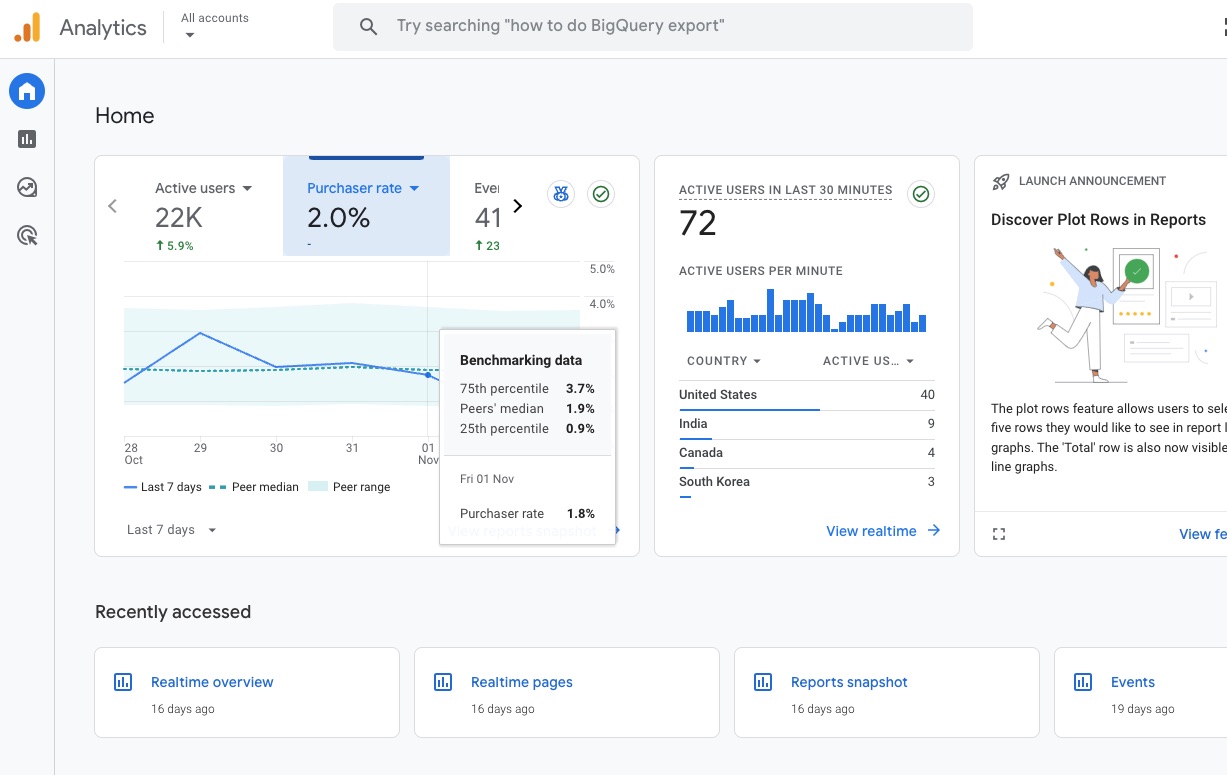
Where can I find benchmarking data in GA4?
To find benchmarking data in GA4:
- Go to Home in GA4
- Click on the metric selector
- Expand the Benchmarking category
- Select the benchmarking metric you want to analyze
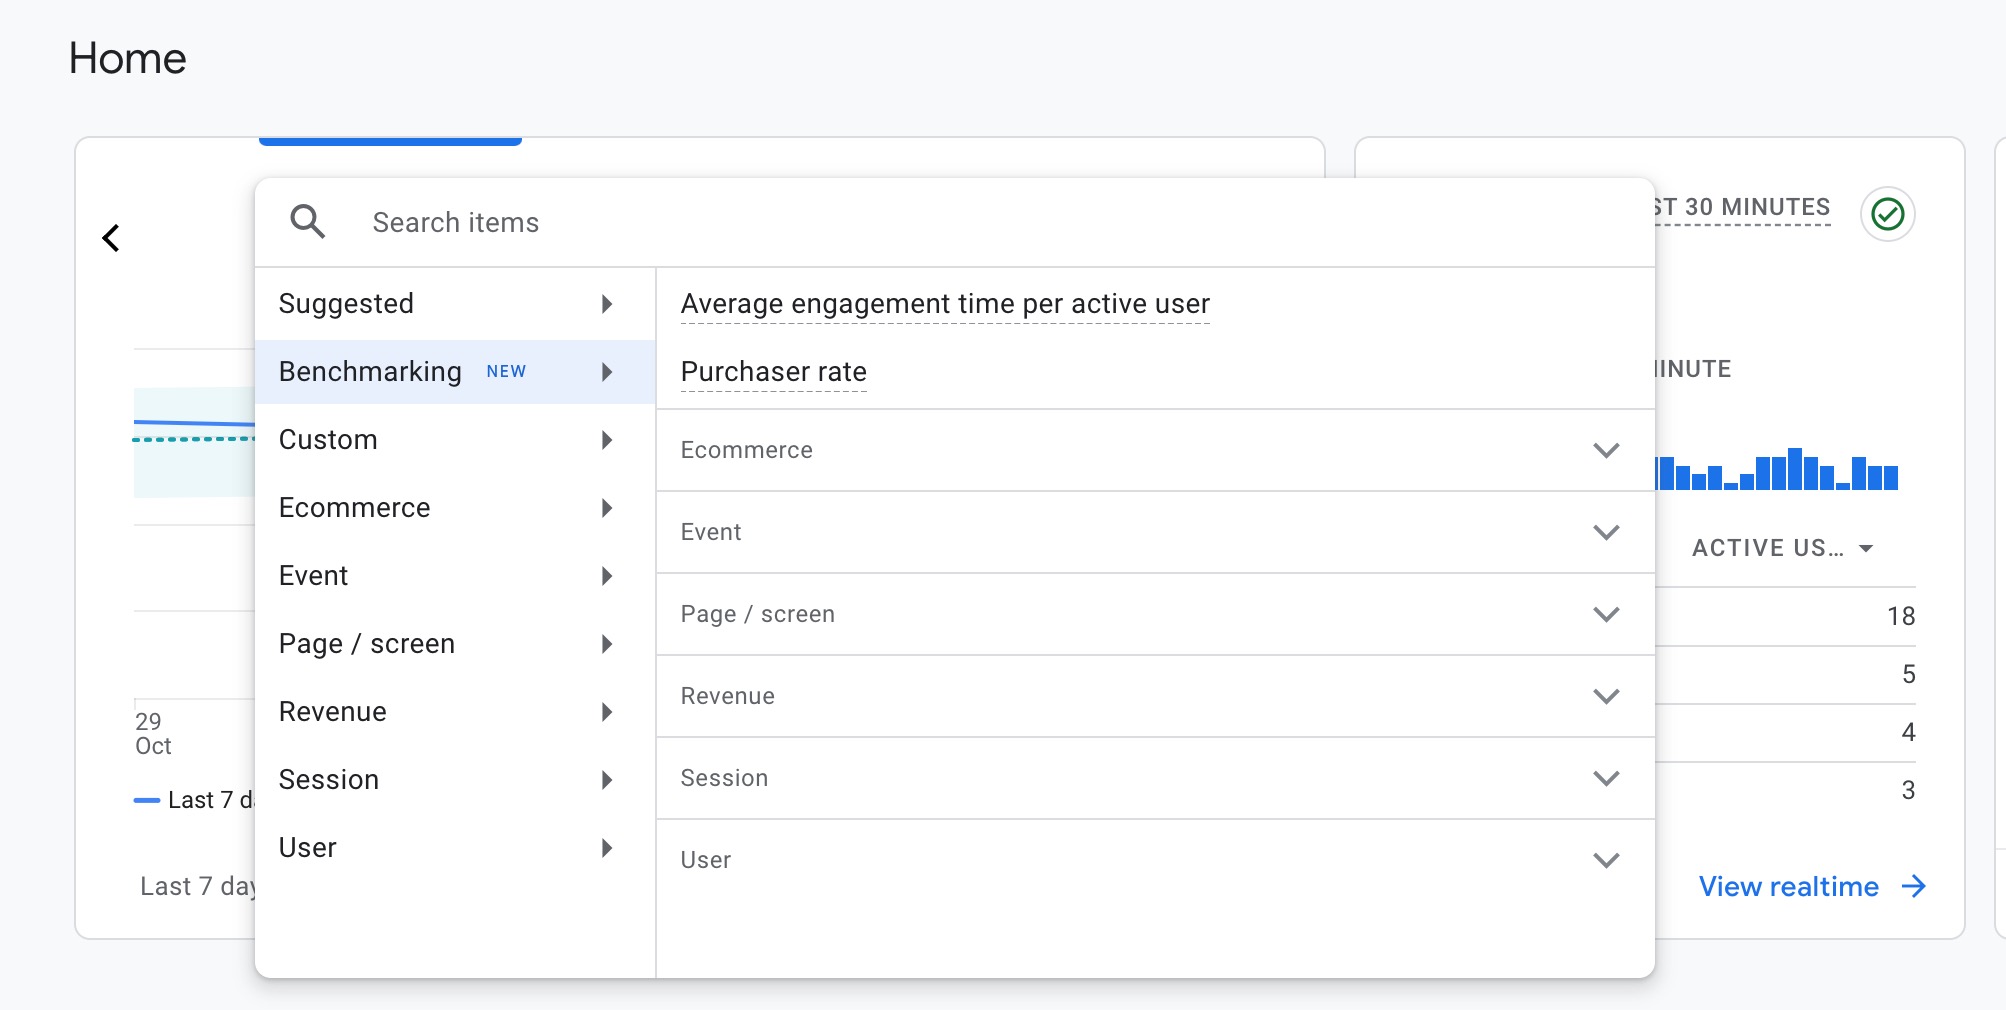
How to access engagement rate benchmarks in GA4?
To view engagement rate benchmarks:
- Navigate to the Home
- Click on the metric selector
- Expand the Benchmarking category
- Under the “Session” section, select “Engagement rate”
How often is benchmarking data updated in Google Analytics 4?
Benchmark data in GA4 is refreshed every 24 hours. This daily update cycle ensures you’re always working with current, relevant data to make informed decisions about your digital performance.
How many metrics are available for benchmarking in GA4?
GA4 provides access to over 30 benchmark metrics covering various aspects of digital performance, including acquisition, engagement, retention, and monetization metrics.
What do the different percentiles mean in GA4 benchmarking reports?
The percentiles in benchmarking reports indicate your performance relative to your peers:
- 75th percentile shows top industry performance
- 50th percentile (median) represents typical performance
- 25th percentile indicates below-average performance
Conclusion: Benchmarking in GA4
With its daily-updated metrics, comprehensive peer group comparisons, and over 30 key performance indicators, it provides unprecedented insights into how your business stacks up against industry standards.
Whether you’re running an ecommerce store, content website, or any other digital business, GA4’s benchmarking capabilities help you compare against relevant industry peers, identify areas for improvement, and set goals accordingly.
Explore more GA4-related content here: