
Performance Max (PMax) campaigns provide a wealth of data to refine your advertising strategy.
This guide explains the Key PMax Reports you need to monitor, how to access them, interpret their meaning, and use them to improve your campaign’s performance.
1. Asset Group Performance: Measuring Combination Effectiveness
Asset Group Performance reveals how different combinations of your advertising elements resonate with your audience. This metric provides clarity on which asset groups are successful and which may need adjustment.
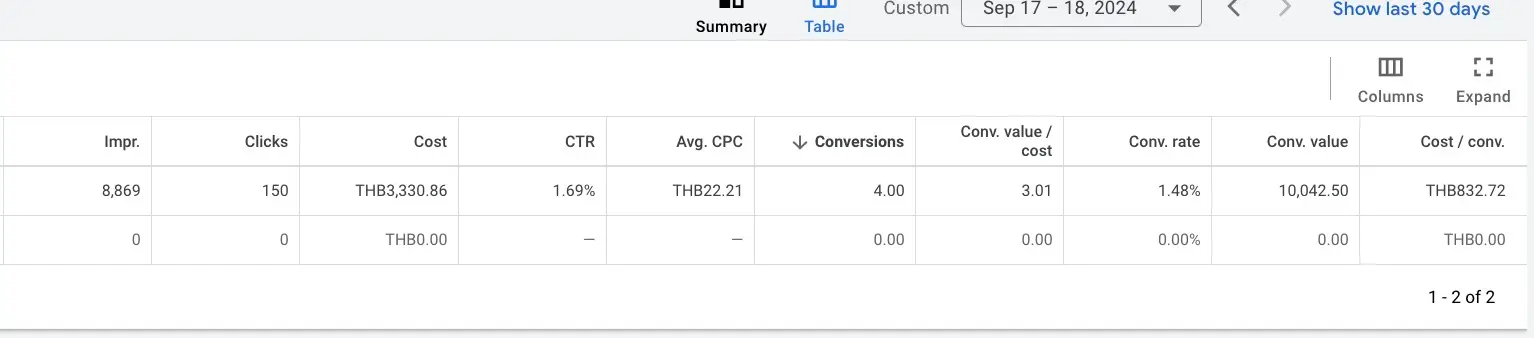
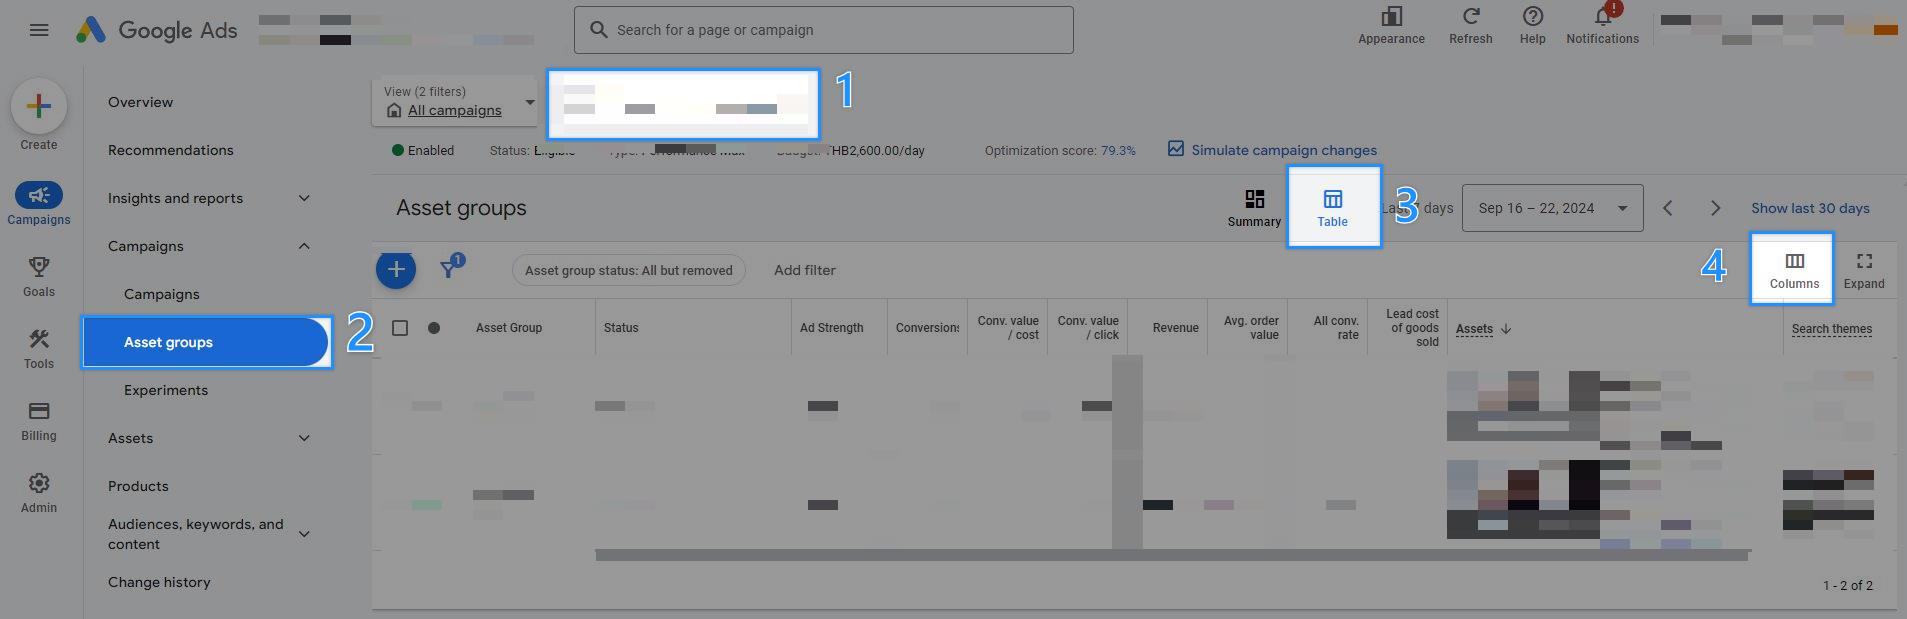
Accessing the Data: In your Performance Max campaign, select Asset Groups, then switch from the summary view to the table view. Then click on the columns to add performance metrics.
Key Performance Indicators:
Impression Count: The number of times your ads were displayed
Clicks: How often viewers interacted with your ads
Click-Through Rate (CTR): The percentage of impressions resulting in clicks
Average Cost Per Click (CPC): Your investment for each click
Cost: The overall investment in each asset group
Conversions: The number of valuable actions taken
Conv. value / cost: The investment required for each conversion
Conversion Value: The monetary impact of these conversions
Interpreting the Data: Consider this scenario for a boutique hotel:
- “Luxury Suite Package” - 200,000 impressions, 6,000 clicks, 60 bookings, $6,000 spent
- “Weekend Getaway Deal” - 200,000 impressions, 2,000 clicks, 40 bookings, $4,000 spent
While “Luxury Suite Package” shows a higher CTR (3% vs 1%) and more bookings, a complete analysis requires examining the revenue per booking and calculating the return on ad spend (ROAS) to
determine the true top performer.
Strategic Actions:
- Allocate more resources to high-performing asset groups
- Analyze successful elements of top performers (imagery, copy, offers) and apply these insights to underperforming groups
- Consider creating dedicated campaigns for exceptionally successful asset groups to gain more control over budget and bidding strategies
2. Listing Groups: Assessing Product Category Performance
For ecommerce businesses, Listing Groups provide crucial insights into how different product categories perform within your PMax campaign. As one of the key PMax reports, this report helps you understand which types of items drive your campaign’s success.
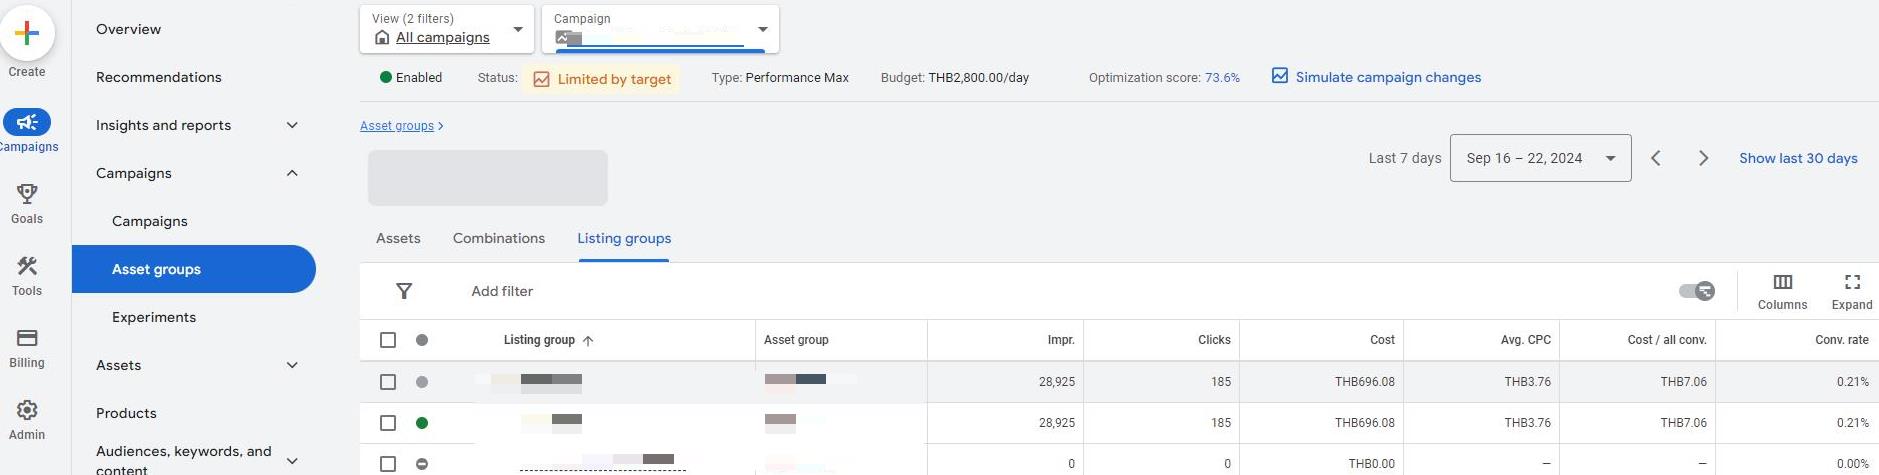
Locating the Data: Choose pmax campaign>click asset groups>navigate to the listing group section in your asset group.
Key Metrics to Monitor:
- Comparison of total campaign spend versus specific listing group spend
- Performance metrics (clicks, conversions, ROAS) for various product categories
Analyzing the Data: Example scenario for an outdoor gear retailer with a $20,000 PMax campaign investment:
- Camping Equipment: $10,000 spent, 1000 conversions, ROAS 5:1
- Hiking Gear: $6,000 spent, 400 conversions, ROAS 4:1
- Water Sports Accessories: $4,000 spent, 100 conversions, ROAS 2:1
This data indicates that Camping Equipment is the top performer, Hiking Gear is performing well, and Water Sports Accessories may require attention or strategic reassessment.
Note: If you need more detailed product performance analysis beyond Listing Groups, the Products report is available. This report provides insights into how individual products or product groups perform within your PMax campaign.
To access the Products report: Select the Products section in your Performance Max campaign. This report includes key metrics such as product visibility (impressions), click-through rate (CTR), ROAS, and conversion rates.
These data points help you identify which products are succeeding in your campaign and which ones might need improvement.
3. Asset Details and Combinations: Optimizing Ad Performance
Asset Details and Combinations provide insights into how individual assets and their groupings perform within your asset groups, helping you create more effective ads.
Accessing the Data:
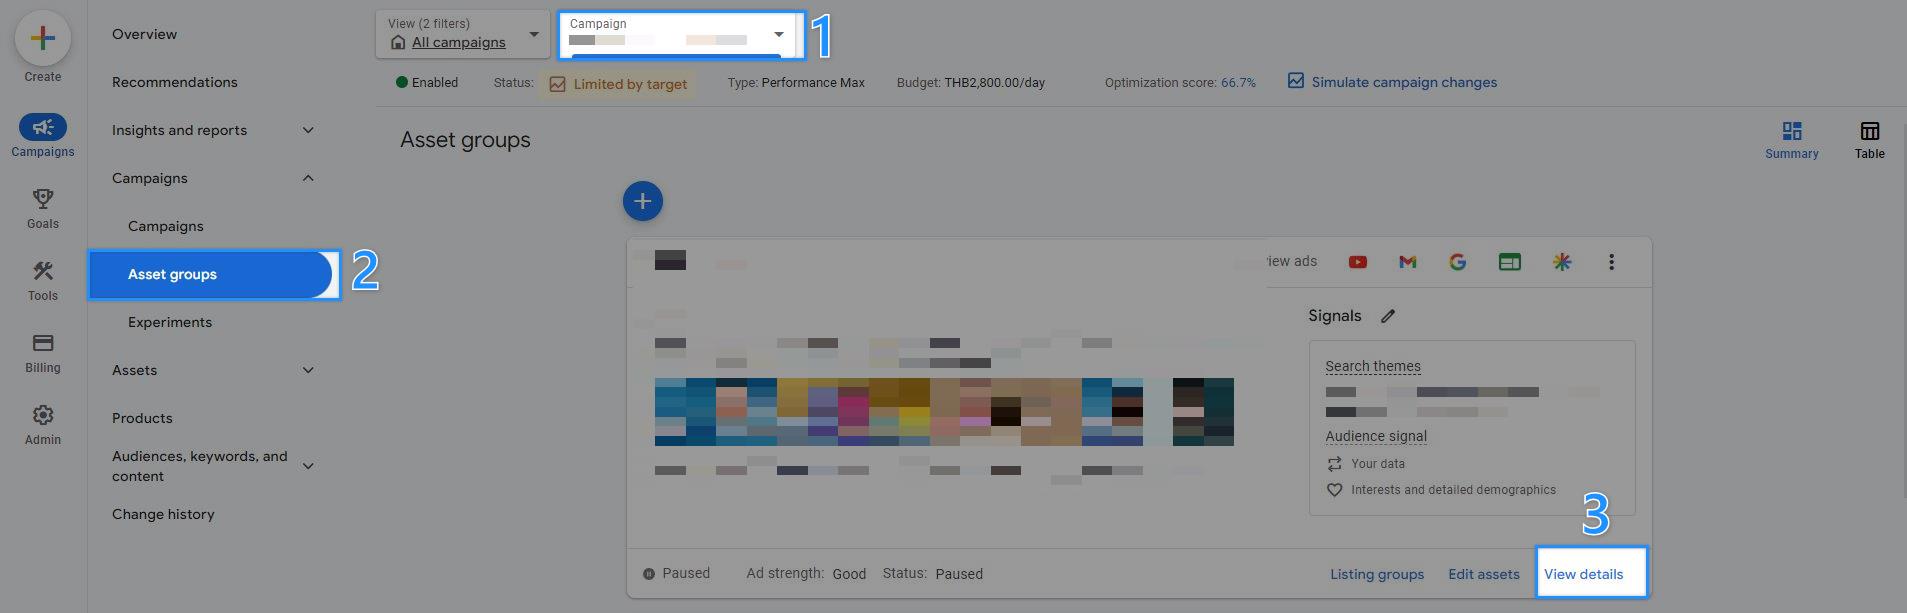
Navigate to Asset Groups > Summary view > “View details”
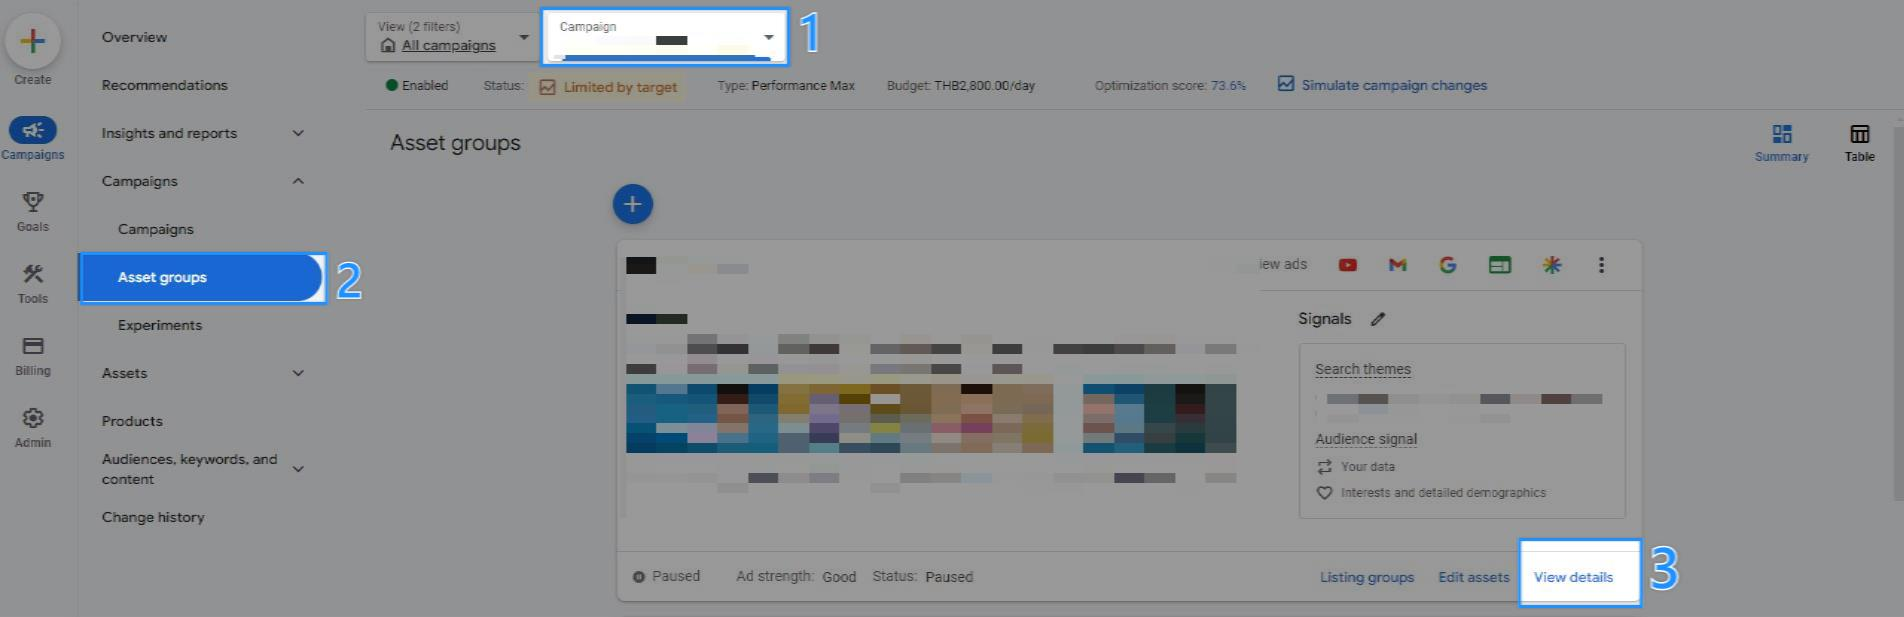
For combinations, switch to the “Combinations” tab
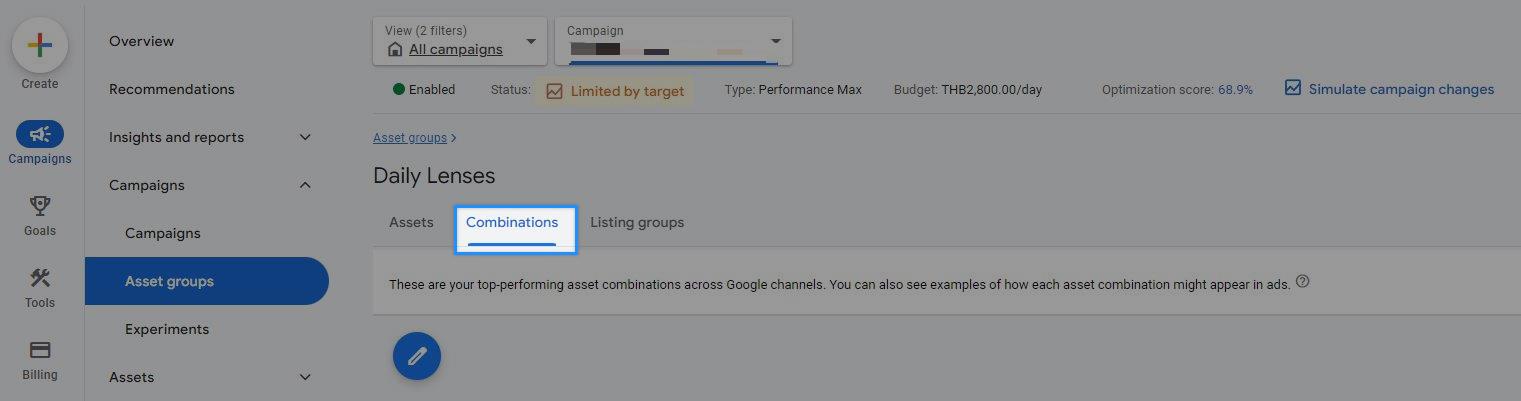
Key Information:
- The Combinations tab shows how your assets are being combined and displayed on Google search results.
- Combinations are sorted based on the number of impressions they receive.
- This view gives you a preview of how your ads actually look to users.
Key Metrics to Analyze:
- Individual asset performance (Low, Good, Best)
- Effective asset combinations
- Comparative performance across asset types (text, image, video)
Interpretation Example:
- Headline: “Limited Time Offer” (Best) vs “Exclusive Deal Inside” (Low)
- Image: Product demonstration (Good) vs Product packaging (Low)
- This data suggests that urgency-based headlines, product demonstrations, and thematically consistent imagery perform better.
4. Landing Pages Report: Evaluating Post-Click Performance
The Landing Pages Report shows how different pages on your website perform when users arrive from your PMax ads. This helps understand not just which ads are effective, but also which parts of your website convert well.
Accessing the Report: In the All Campaigns view, select “Insights & Reports,” then navigate to “Landing Pages”. You can click on “Add Filter” and then “Landing Page” to see a specific landing page.
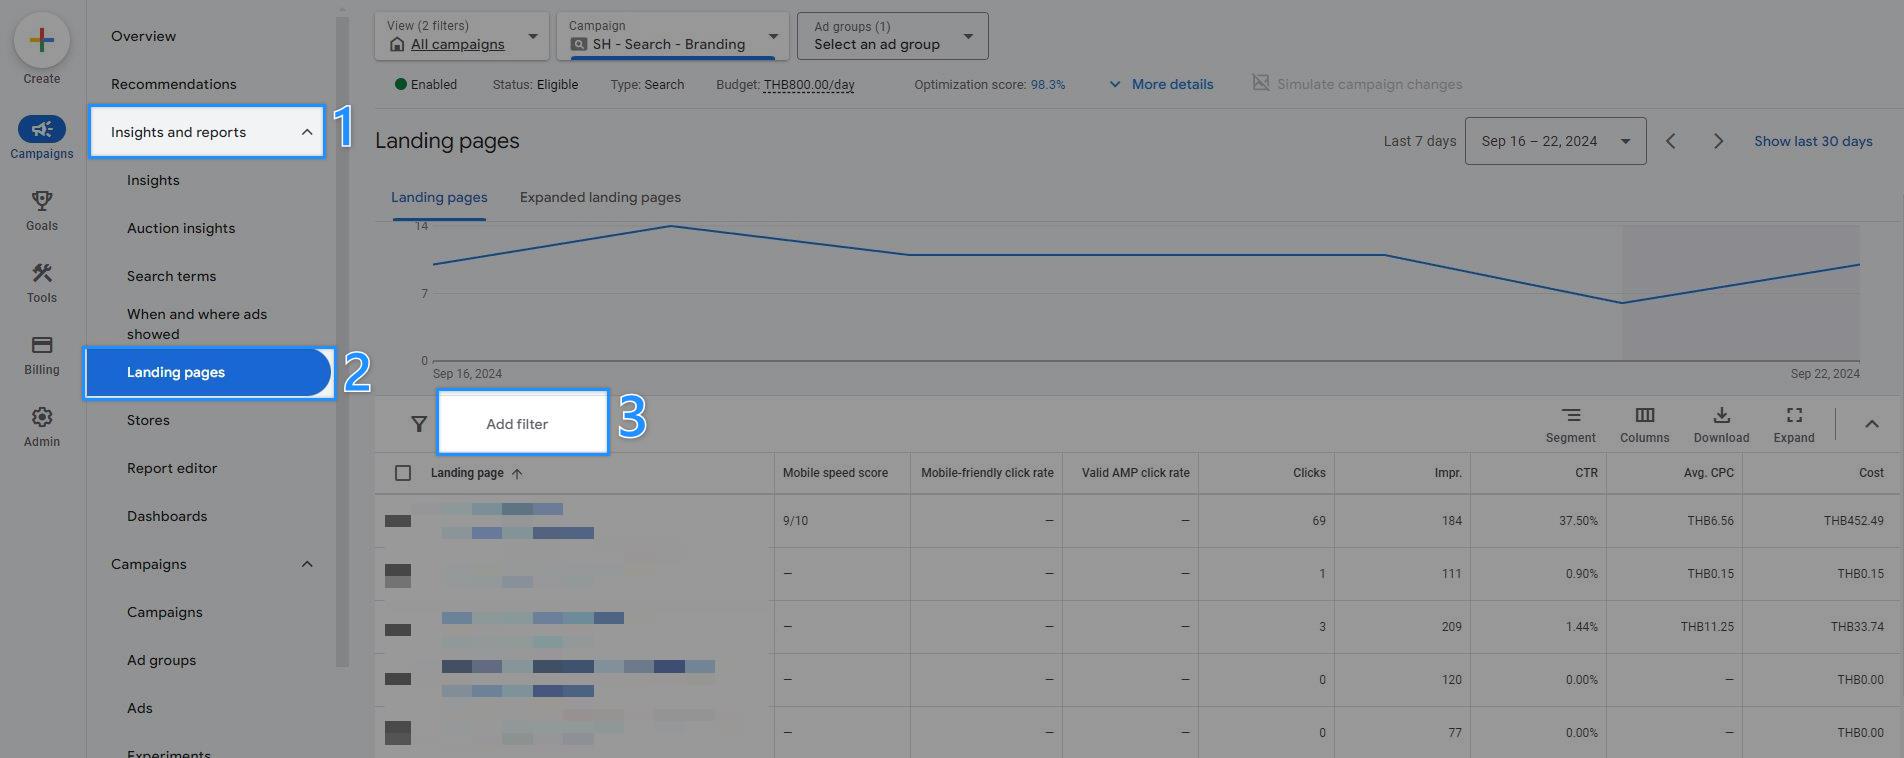
Key Metrics to Examine:
- Performance of different landing pages (mobile speed score, conversion rate, cost)
- Impact of final URL expansion or page feeds
- Comparison between product pages and category pages
Interpreting the Data: Consider this scenario:
- Product page A: 1,500 visits, 75 conversions, 5% conversion rate
- Category page B: 1,500 visits, 150 conversions, 10% conversion rate
Despite receiving equal traffic, the category page is converting at twice the rate of the product page.
Strategic Actions:
- Optimize underperforming landing pages
- Consider creating more content for high-performing page types
- Use these insights to inform your site structure and user journey
5. Video Views Report: Assessing Video Asset Performance
The Video Views Report provides insights into how your video assets perform within your PMax campaign. This is crucial for understanding the effectiveness of your video content and its impact on your campaign budget.
Accessing the Data: In the All Campaigns view, add the “Avg. CPV” and “Views” columns to your report.
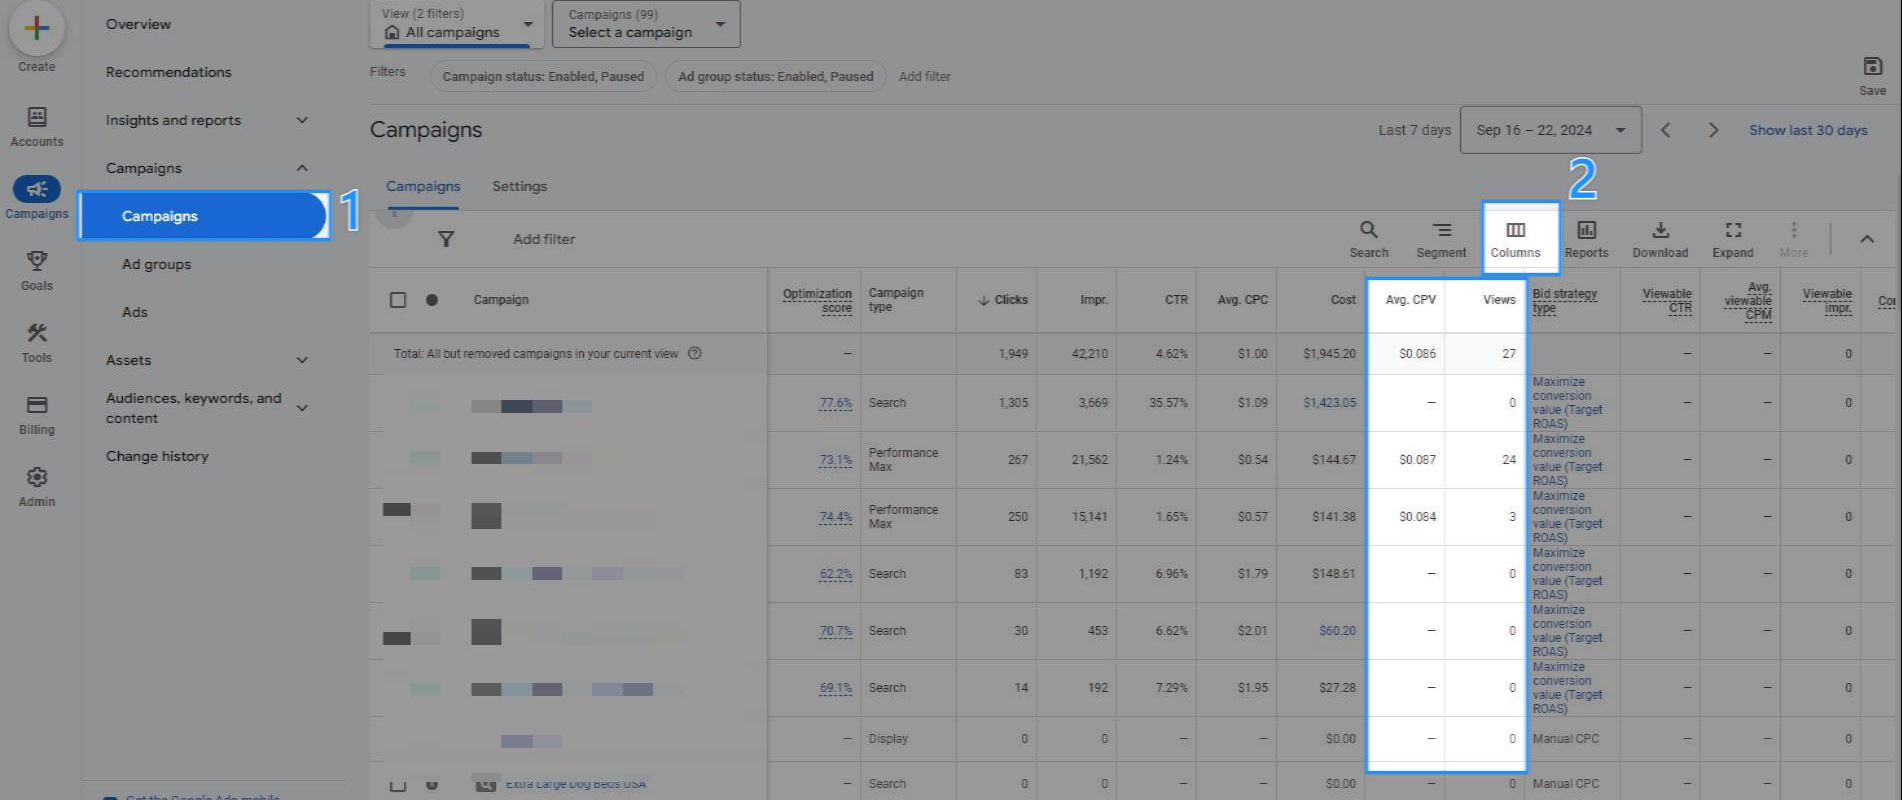
Key Metrics to Monitor:
- Number of video views
- Average Cost Per View (CPV)
- View rate (views divided by impressions)
- Total spend on video assets
Analyzing the Results: Consider this example of two video assets:
-
- Product demonstration: 15,000 views, $0.07 CPV
- Customer testimonial: 7,500 views, $0.12 CPV
To understand the budget impact of each video, calculate the total spend:
-
- Product demonstration: 15,000 * $0.07 = $1,050 total spend
- Customer testimonial: 7,500 * $0.12 = $900 total spend
While the product demonstration has more views at a lower CPV, it’s actually consuming more of the budget. This insight helps you understand how each video contributes to your overall campaign spend.
Recommended Actions:
- Calculate video spend by multiplying views by CPV for each asset
- Optimize video content based on performance and budget allocation
- Experiment with different video lengths and styles
- Consider creating more content similar to your best-performing videos in terms of view count and efficient budget use
By focusing on these metrics and calculations, you can better assess the true impact of your video assets on your PMax campaign performance and budget allocation.
6. Auction Insights: Understanding Competitive Positioning
Auction Insights provide a view of how your PMax campaign performs in relation to other advertisers competing for the same ad space. This helps you understand your competitive position in the market.
Accessing the Report: In your Performance Max campaign, select “Insights & reports,” then “Auction insights.” Use the “Add filter” option to refine your analysis.
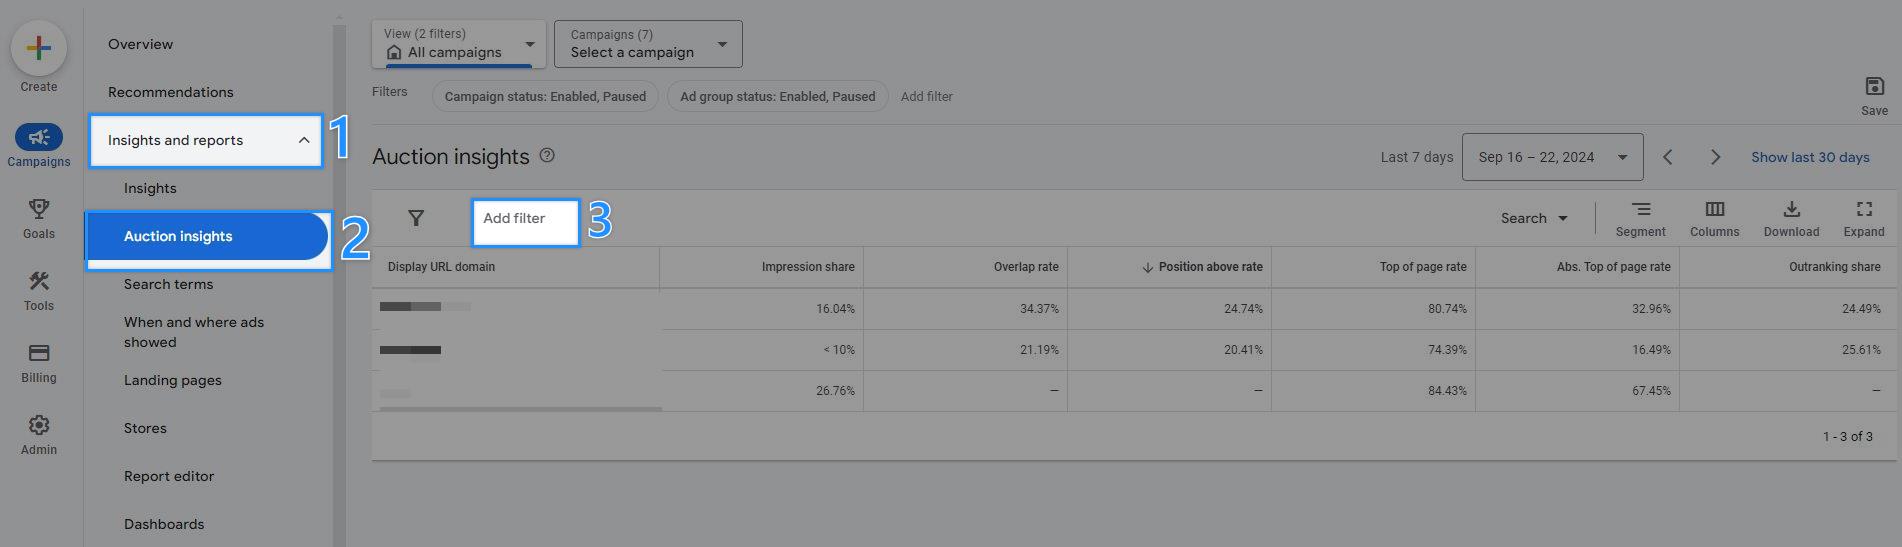
Key Metrics to Examine:
- Impression share: The percentage of impressions you received out of the total you were eligible to receive
- Overlap rate: How often another advertiser’s ad received an impression in the same auction that your ad also received an impression
- Position above rate: How often another advertiser’s ad in the same auction shows in a higher position than your own, when both of your ads were shown at the same time
- Outranking share: How often your ad ranked higher in the auction than another advertiser’s ad, or showed when theirs did not
- Top of page rate and Absolute top of page rate (for search ads): How often your ad appears at the top of the page or the very top of the page
Interpreting the Data: Consider this scenario:
- Your impression share is 45%
- Competitor A has a 55% overlap rate with you
- You have a 35% outranking share against Competitor A
This means you’re appearing in 45% of eligible auctions, you’re often competing directly with Competitor A, but they’re outperforming you more often than not.
Strategic Actions:
- Identify main competitors and analyze their strategies
- Adjust bids or budgets to improve impression share in valuable segments
- Use these insights to inform your overall competitive strategy
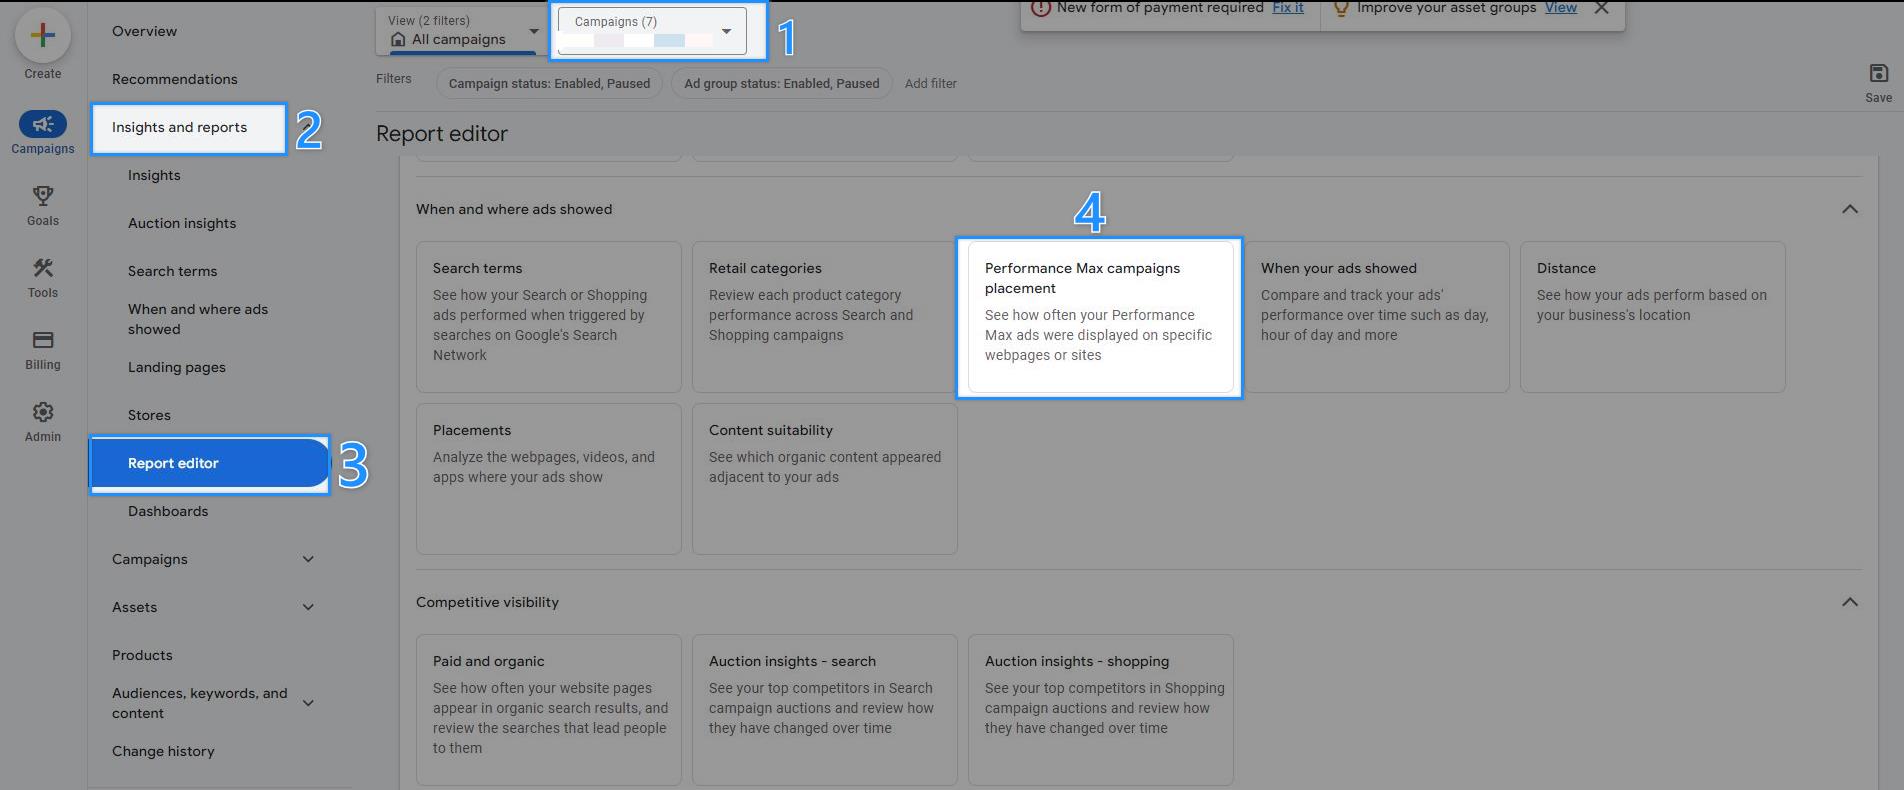
7. Performance Max Campaign Placement
The Performance Max Campaign Placement report provides insights into the platforms and placements where your ads are being served across Google’s extensive network, such as YouTube, Gmail, and
Discover. By reviewing this data, you can assess whether your ads are reaching the intended audience and identify any opportunities for strategic adjustments.
Accessing the Report
To view the Performance Max Campaign Placement report, first, select your Performance Max campaign. From there, navigate to the Insights & Reports section and click on the Report Editor. In the Report
Editor, choose Performance Max Campaign Placement. This will display the placement data for your campaign.
Key Metrics to Monitor
The primary metric to focus on is Impressions, which shows how often your ads were displayed across Google’s properties. This information is crucial in understanding the reach of your campaign across various platforms.
Using the Data
Although Performance Max campaigns are audience-based rather than placement-based, knowing where your ads appear can offer valuable audience insights. By identifying the placements that are receiving
the most impressions, you can refine your audience signals or adjust your creative assets to better match those environments.
Strategic Actions
- Analyze audience behavior: Use the placement data to identify which platforms yield the most impressions and audience engagement. This can help fine-tune your asset groups and audience signals.
- Content alignment: Ensure that your messaging and assets align with the platforms where your ads appear. For instance, if a significant number of impressions are coming from video-heavy platforms like YouTube, ensure your video assets are optimized.
- Refine targeting: If you find that your ads are frequently appearing on platforms or sites that don’t align with your brand or objectives, consider refining your audience signals or excluding certain placements.
By using the insights from the Performance Max Campaign Placement report, you can optimize your campaign’s reach and ensure your ads are being shown to the right audiences in the most relevant environments.
Key PMax Reports to Track: (FAQ)
My Performance Max campaign isn’t delivering the results I expected. How can I improve its performance?
- Start by reviewing your Asset Group Performance. Look for underperforming asset groups and update their creative assets.
- Refine your audience signals to better target your ideal customers.
- Adjust your bidding strategy or budget allocation.
- Analyze top-performing asset groups and apply those learnings to the underperforming ones.
I’m struggling to understand which products are driving results in my PMax campaign. How can I get more clarity?
- Use the Listing Groups report to assess product category performance. This report shows how different product categories perform within your PMax campaign.
- Regularly review performance metrics for different categories. Allocate more budget to high-performing ones, and consider removing consistently underperforming products.
- Test specific products in different asset groups to optimize performance.
My video assets aren’t getting enough views. What can I do to improve their performance?
- Check your Video Views Report to understand which videos are most effective.
- Create more engaging, relevant content that connects with your target audience.
- Try different video lengths and styles.
- Optimize based on view rates and cost per view metrics.
- Remember, sometimes a shorter, more impactful video can outperform longer ones.
I feel like I’m losing ground to my competitors. How can I assess and improve my competitive position?
- Use the Auction Insights report to understand your competitive landscape. This report helps you identify your main competitors, assess your impression share, and see your outranking share.
- Based on these insights, you can adjust your bidding strategy to improve your position.
- Refine your creative assets to stand out from competitors.
My ads are appearing on platforms that don’t seem relevant to my business. Can I control this?
- While you can’t directly control placements in PMax campaigns, you can influence them.
- Use the Performance Max Campaign Placement report to see where your ads are appearing.
- Refine your audience signals and adjust your creative assets to better match your target platforms.
- If certain placements consistently underperform, consider excluding them if possible.
I’m noticing high click-through rates but low conversion rates. What might be causing this?
- This issue often relates to landing page performance. Use the Landing Pages report to identify which pages are converting well and which have high bounce rates.
- Compare performance between product pages and category pages.
- Use these insights to optimize underperforming pages, improve your site structure, and enhance the user journey on your website.
My e-commerce Performance Max campaign isn’t as effective as my old Shopping campaigns. What am I missing?
- Ensure your product feed is up-to-date and optimized. Use high-quality images and compelling product descriptions.
- Use the Listing Groups report to understand which product categories are performing well and allocate budget accordingly.
- Make sure you’re using a diverse set of creative assets that showcase your products effectively across all of Google’s advertising networks.
I’m not sure if I’m allocating my budget effectively across different asset groups. How can I optimize this?
- Review your Asset Group Performance regularly. Look at metrics like impressions, clicks, conversions, and ROAS for each asset group.
- Allocate more budget to high-performing groups.
- Consider creating dedicated campaigns for exceptionally successful asset groups to gain more control over budget and bidding strategies.
My Performance Max campaign performance fluctuates a lot. How often should I be making adjustments?
- While it’s tempting to make frequent changes, give your campaigns time to learn and optimize.
- Review your PMax metrics at least weekly. Avoid making major changes more often than that unless you see significant performance issues.
- For larger accounts or during critical periods (like holidays or promotions), you might want to monitor more frequently and be prepared to make quicker adjustments.
I’m worried that I’m losing control over my advertising with Performance Max. How can I maintain some level of influence over my campaigns?
- While Performance Max does automate many aspects of campaign management, you still have several ways to control your campaigns.
- Focus on creating high-quality, diverse assets for your asset groups.
- Refine your audience signals to guide the algorithm towards your ideal customers.
- Use conversion tracking effectively to ensure the campaign optimizes for the right goals.
Bonus Content: Here are some useful content to learn more about Pmax and Google Ads Campaigns