
The world’s biggest ecommerce markets processed over $10 trillion in sales in 2025. These top ecommerce markets connect hundreds of millions of buyers and sellers through different approaches to online retail.
Key Takeaways:
- Market Scale: China leads global e-commerce with $1.47 trillion in revenue, followed by the U.S. at $1.2 trillion and Japan at $169.4 billion
- Platform Types: Etsy serves 97% home-based sellers, while Walmart combines 11,003 stores with online sales
- Regional Leaders: MercadoLibre serves Latin America with 52 million payment users, while Coupang holds 22.5% of South Korea’s market
- Global Leaders: Amazon dominates the West with 37.6% U.S. market share, while Alibaba reigns in China with 939 million active users
- Growth Areas: Cross-border trade is rising fast, with platforms like Shopee reaching 295 million users across Southeast Asia
Let’s explore the unique features and market positions of these largest e-commerce marketplaces, and what sets them apart.
Key Features of Top Ecommerce Marketplaces
Each major marketplace stands out with different characteristics. Here’s a quick look at what makes each platform unique:
| Marketplace | Notable Feature |
| Amazon | 60% of sales from independent sellers |
| eBay | 31% of sellers from US, 29% from UK |
| Etsy | 97% run businesses from home |
| Walmart | 34 fulfillment centers in US |
| Temu | 40% of US orders under $20 |
| Alibaba | Controls Taobao and Tmall platforms |
| MercadoLibre | 42% growth year-over-year |
| Shopee | Operates in 49 countries |
| Allegro | 60,000 active merchants |
| Wayfair | 79.9% repeat customer rate |
Biggest Ecommerce Markets in the World
Online shopping has changed retail across the globe, with major marketplaces generating billions in sales and connecting millions of buyers and sellers. Different markets have produced different winners - from mass-market giants to niche specialists.

Bonus: Get the latest ecommerce market statistics and downloadable reports at StatsUp. Free access to updated global market data and insights.
Amazon might lead in the West, but Alibaba rules China, while regional players like MercadoLibre and Coupang hold strong positions in their local markets.
Here’s a detailed look at each major marketplace:
Amazon
Amazon has grown from an online bookstore into the world’s largest ecommerce marketplace, serving over 300 million active users worldwide in 2025. The platform connects businesses of all sizes with a massive customer base through its established marketplace system.
Amazon Market Snapshot
Amazon’s Q3 2024 performance shows net sales of $158.9 billion and net income of $15.3 billion. Amazon Prime serves over 200 million members globally, with a 99% two-year renewal rate in the US.
Notably, 60% of Amazon’s sales come from independent sellers, highlighting the platform’s value for third-party merchants.
Key Market Statistics
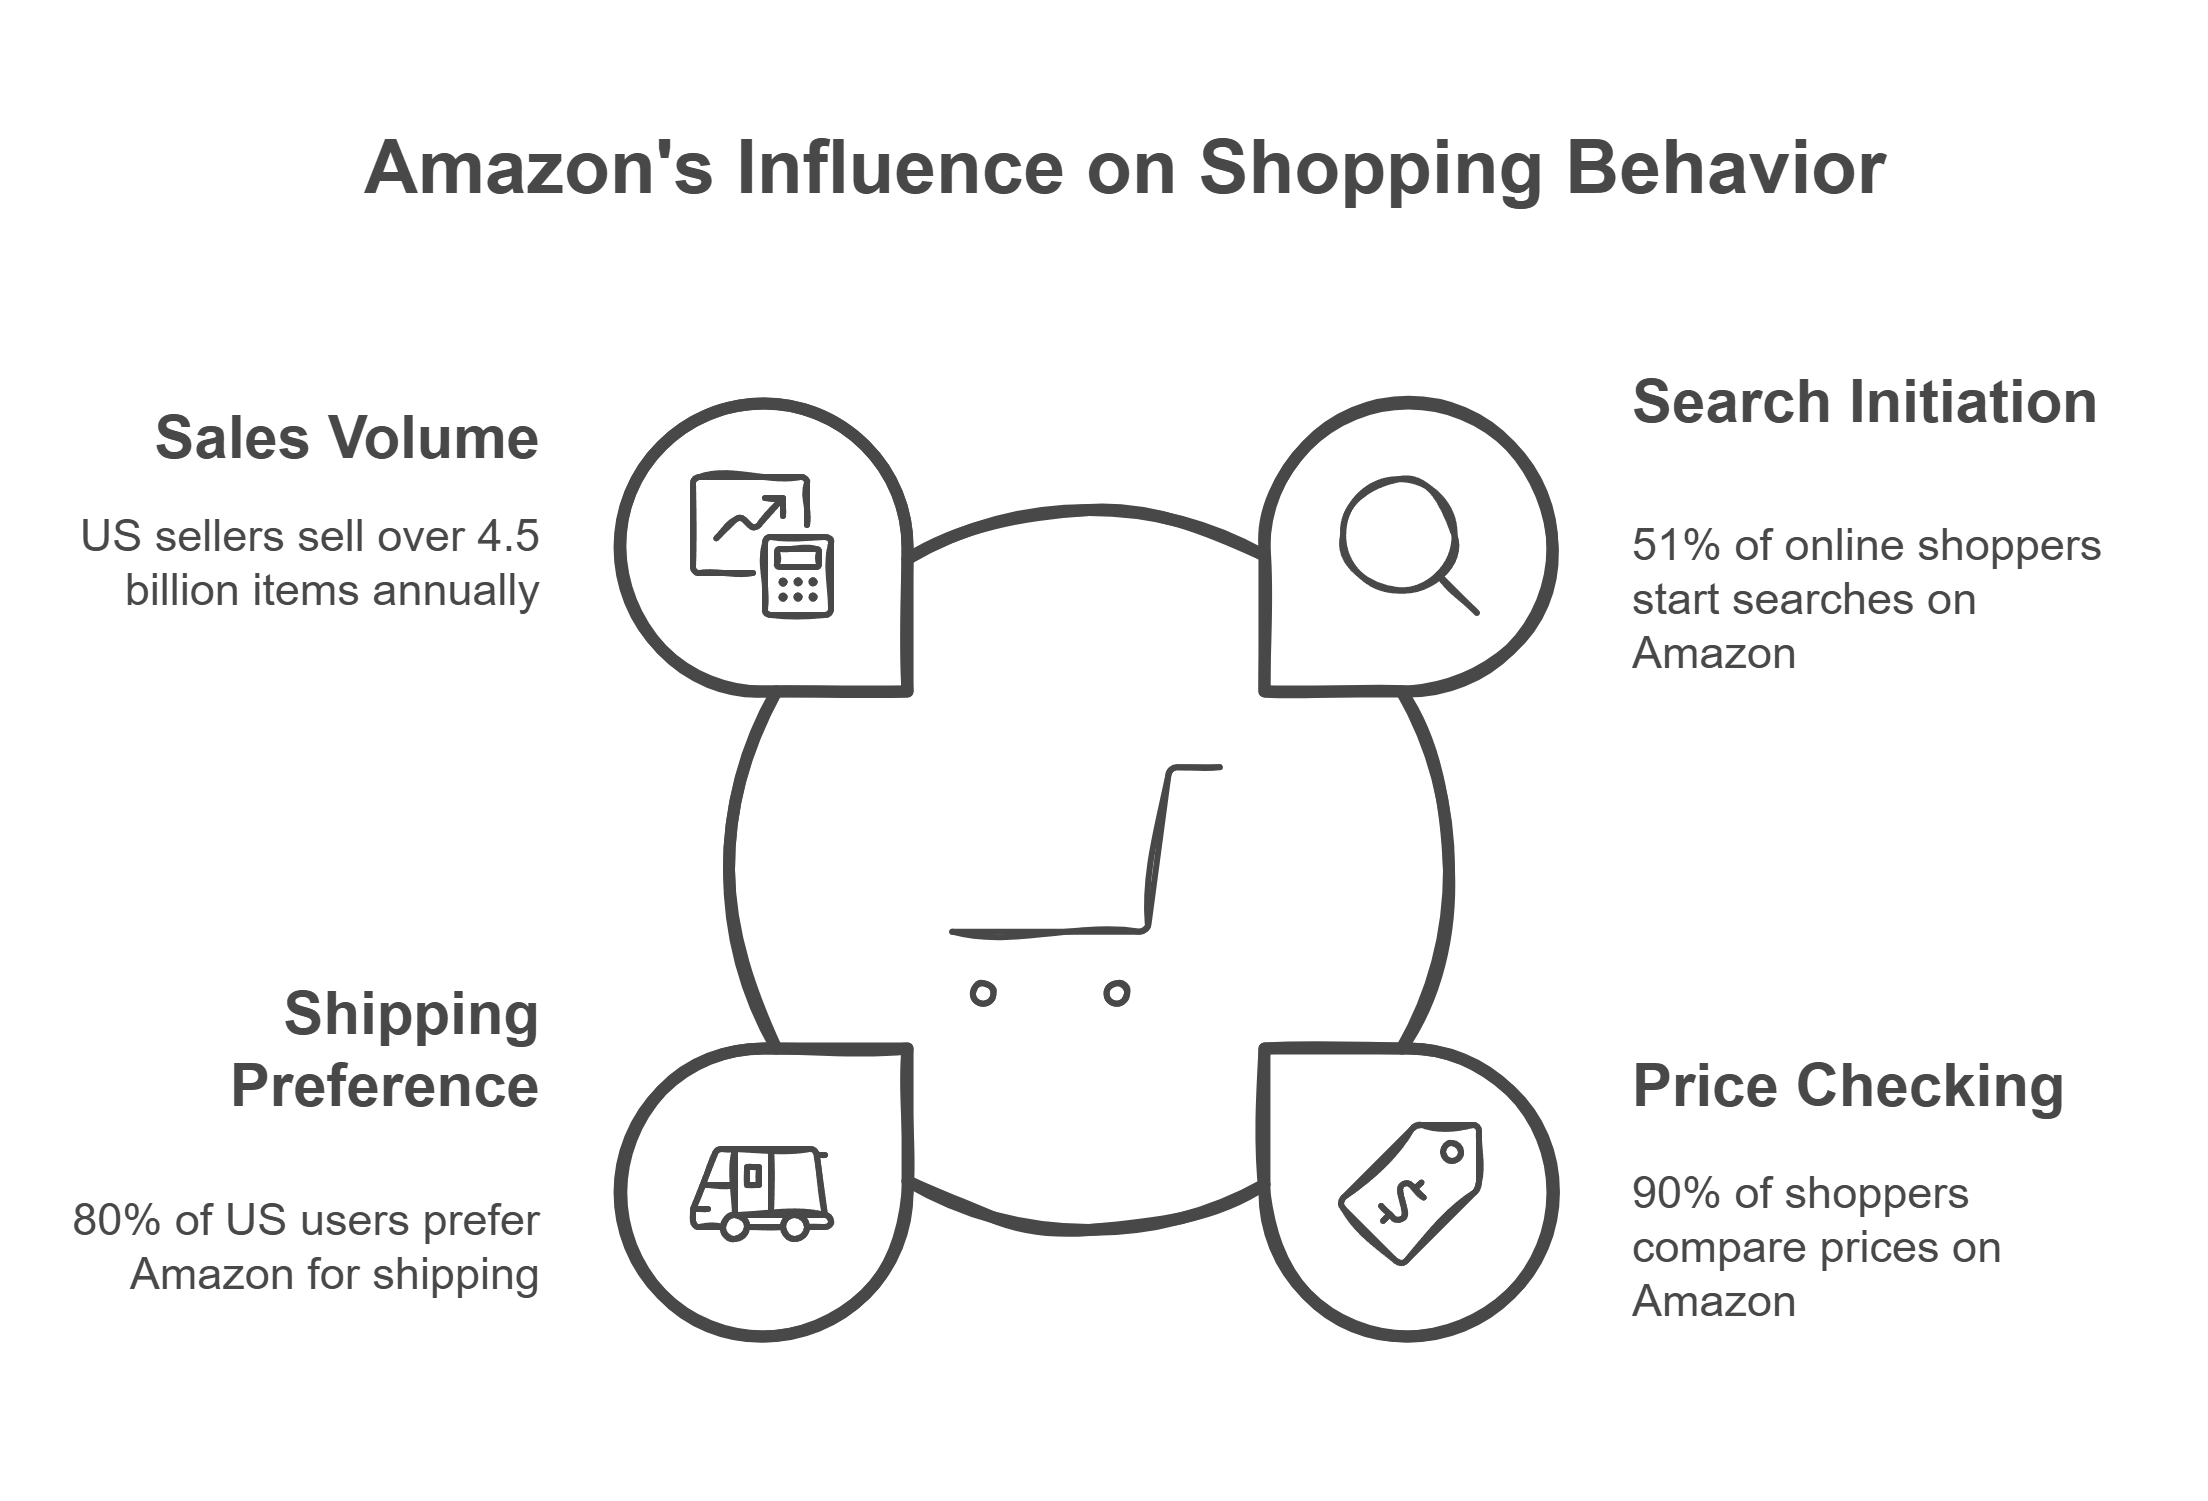
The platform’s impact on shopping behavior is clear:
- 51% of online shoppers start their product searches on Amazon
- 90% of shoppers check prices on Amazon before buying
- 80% of US users choose Amazon for fast, free shipping
- Over 4.5 billion items are sold by US sellers annually
Bonus: Explore the latest Amazon statistics here: users and audience, revenue, and many other downloadable statistics, key insights and facts!
Revenue Potential
Real seller performance data shows:
- 30% of sellers earn monthly sales above $5,000
- 57% achieve profit margins greater than 10%
- 22% of sellers reach profitability within three months
- Over 10,000 independent sellers passed $1M in sales in 2023
Investment and Time Commitment
Most successful sellers (64%) started with $5,000 or less. Time investment is manageable - 50% of sellers spend less than 10 hours per week running their Amazon business, especially those using FBA services.
Amazon Cost Structure
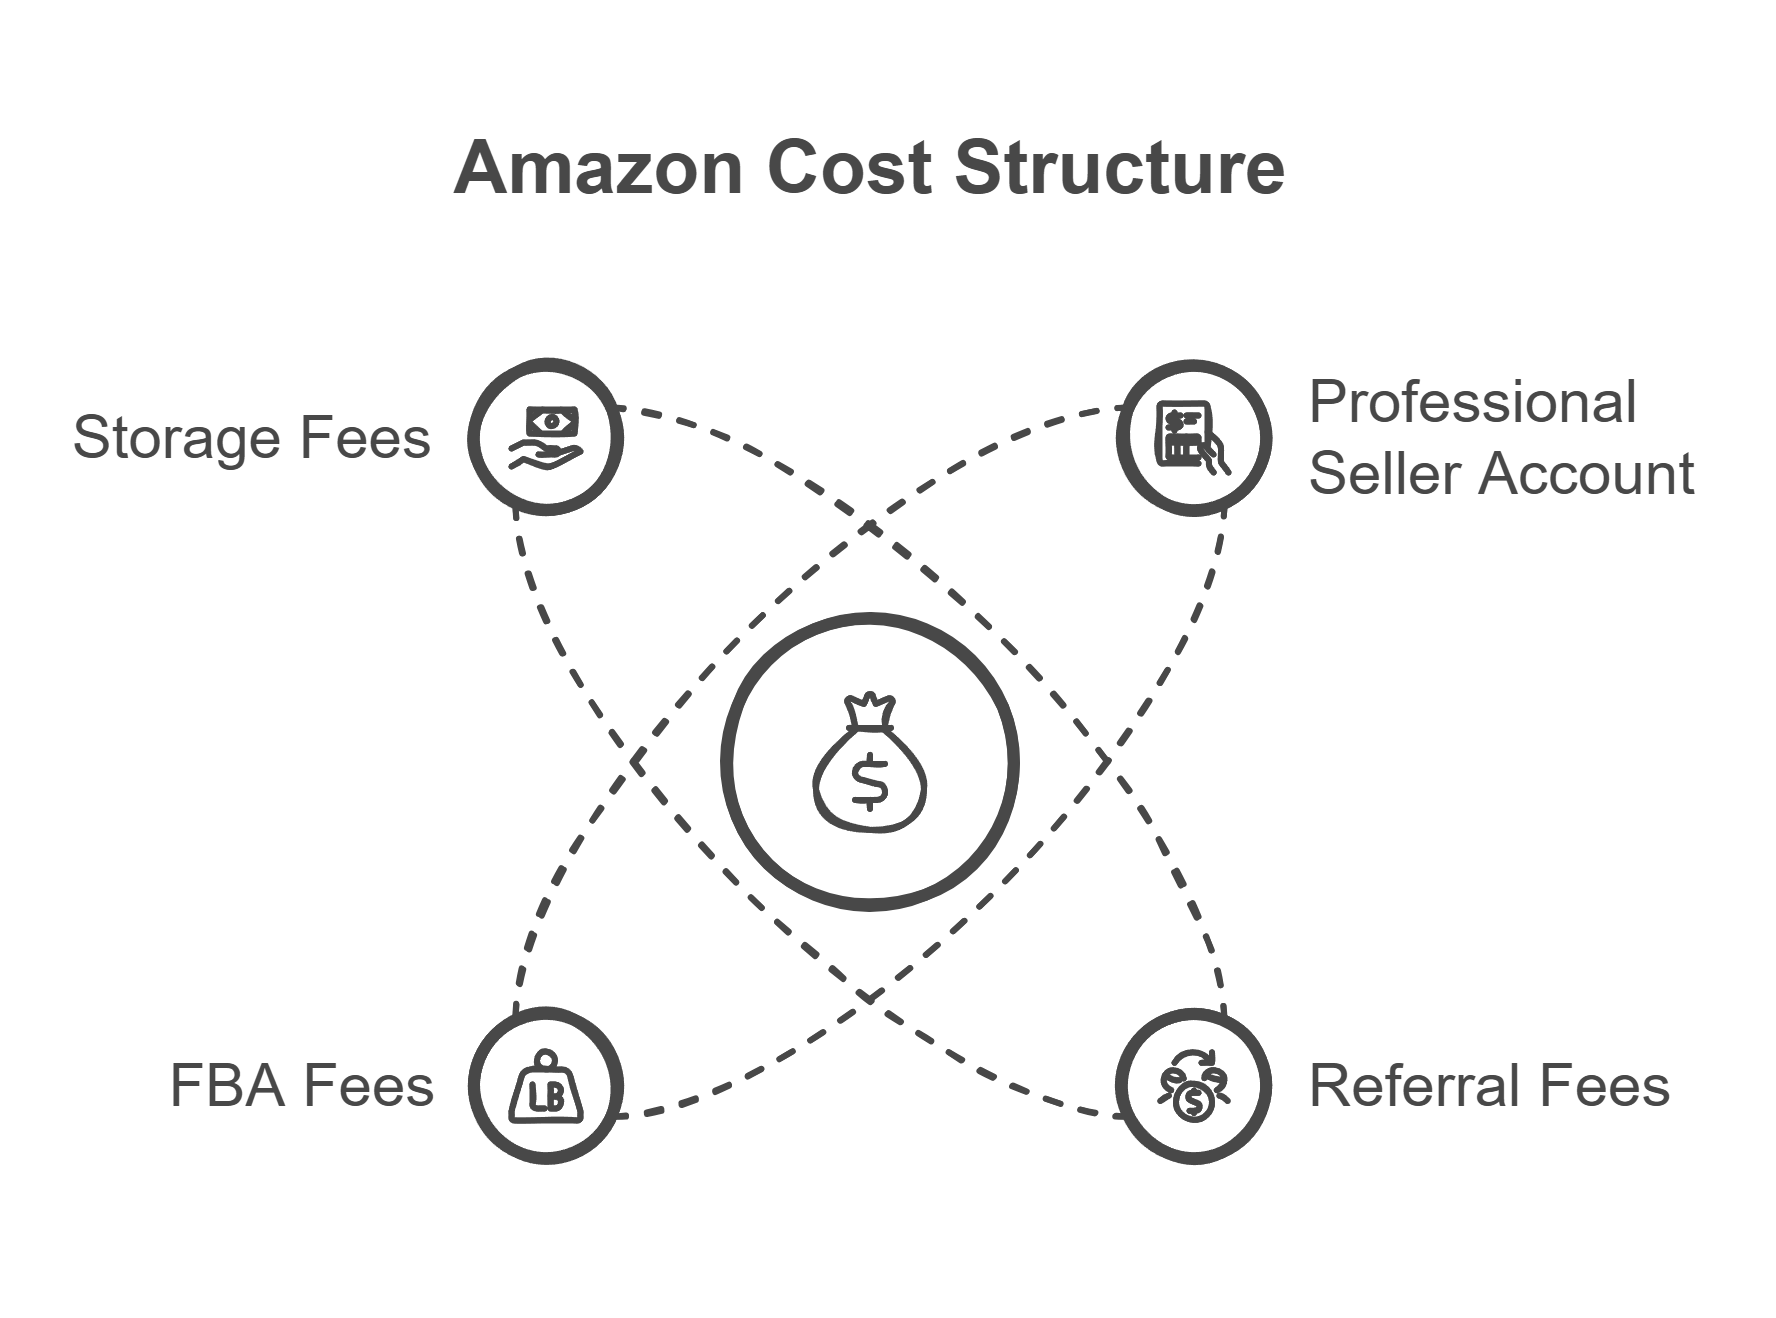
Key expenses include:
- Professional seller account: $39.99/month
- Referral fees: 15% for most categories
- FBA fees: Based on product size and weight
- Storage fees: $0.87 per cubic foot (January-September)
Who Succeeds on Amazon
Successful Amazon sellers keep profit margins above 10% and offer unique or niche products. Fast customer service is essential - sellers need to answer messages within 24 hours to stay in good standing.
Good inventory management helps avoid stockouts and extra storage fees. Many sellers use Amazon’s FBA service to cut shipping costs up to 70% and reach Prime customers.
eBay
eBay has evolved from an auction-focused platform into a major global marketplace with over 132 million active buyers in 2024. The platform connects individual sellers and businesses with buyers through both auction and fixed-price formats.
eBay Market Snapshot
eBay’s Q2 2024 performance shows revenue of $2.6 billion and gross merchandise volume of $18.4 billion. With approximately 18 million active sellers and 2 billion live listings, eBay maintains a 3.5% market share in the US.
The platform averages 650 million monthly visits with users spending an average of 10.5 minutes per visit.
Bonus: Discover the latest statistics on Ebay’s performance now!
Key Market Statistics
Important metrics that shape eBay’s marketplace:
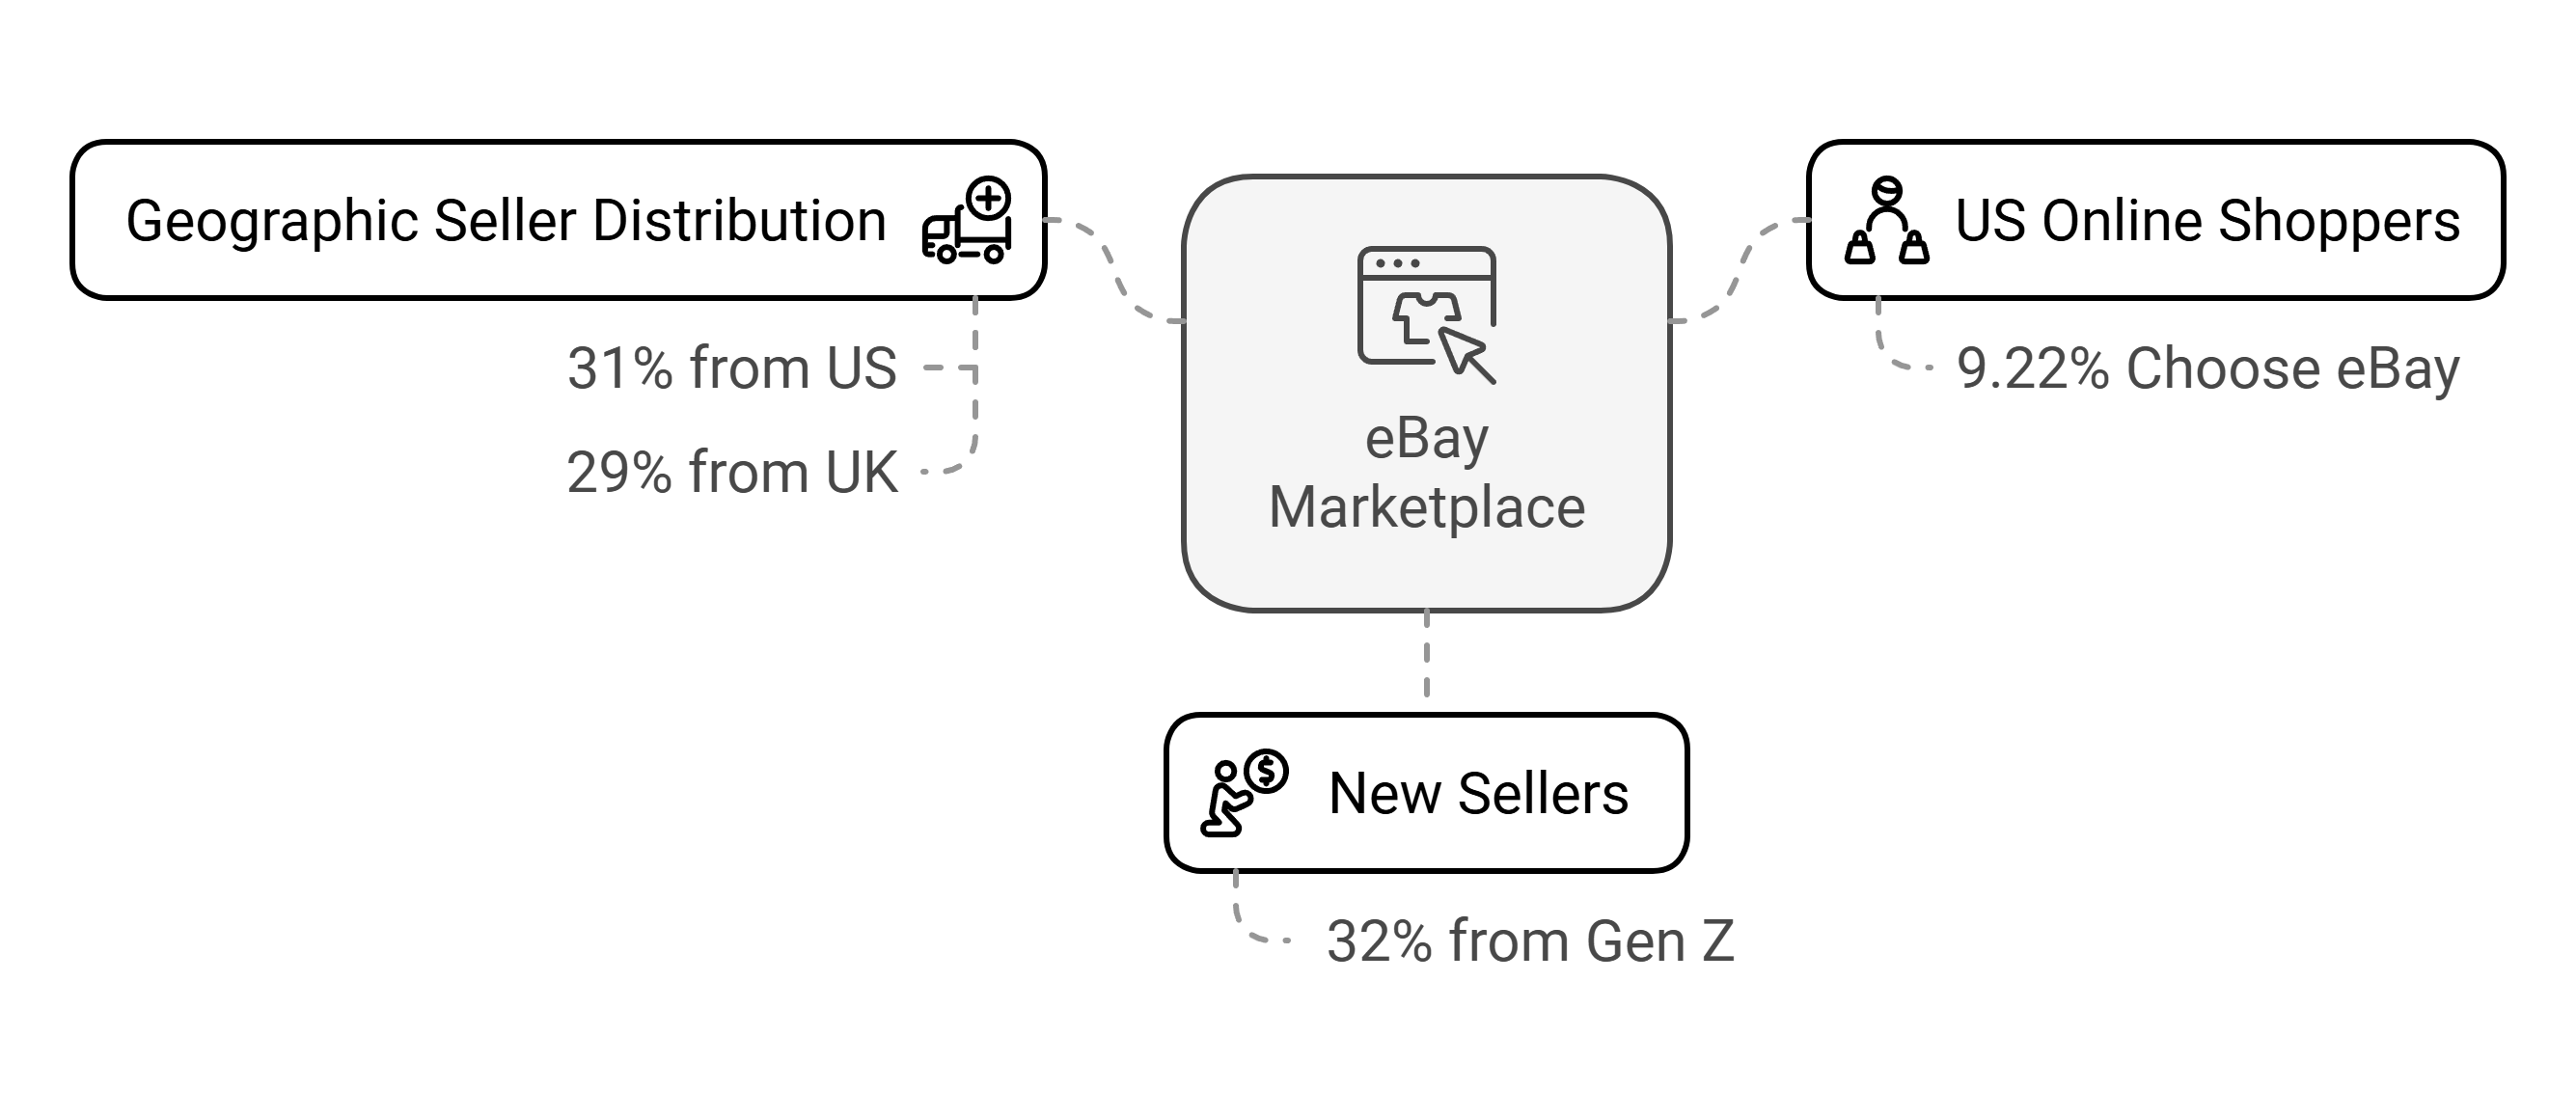
- 9.22% of US online shoppers choose eBay, making it the second most popular shopping site
- 32% of new sellers are from Gen Z, showing strong appeal to younger entrepreneurs
- 31% of sellers are from the US, followed by 29% from the UK
- Platform hosts over 28 million high-value buyers
- Enthusiast buyers spend approximately $3,000 annually
eBay Revenue Potential
eBay offers diverse earning opportunities across its marketplace. Most sellers generate monthly revenues between $1,000 and $25,000, selling everything from everyday items to rare collectibles.
The platform’s flexibility allows sellers to list both new and used items successfully.
For unique or rare items, the auction format often drives higher prices through competitive bidding. The platform’s international reach lets sellers tap into global markets, expanding their potential customer base beyond local boundaries.
Ebay Cost Structure
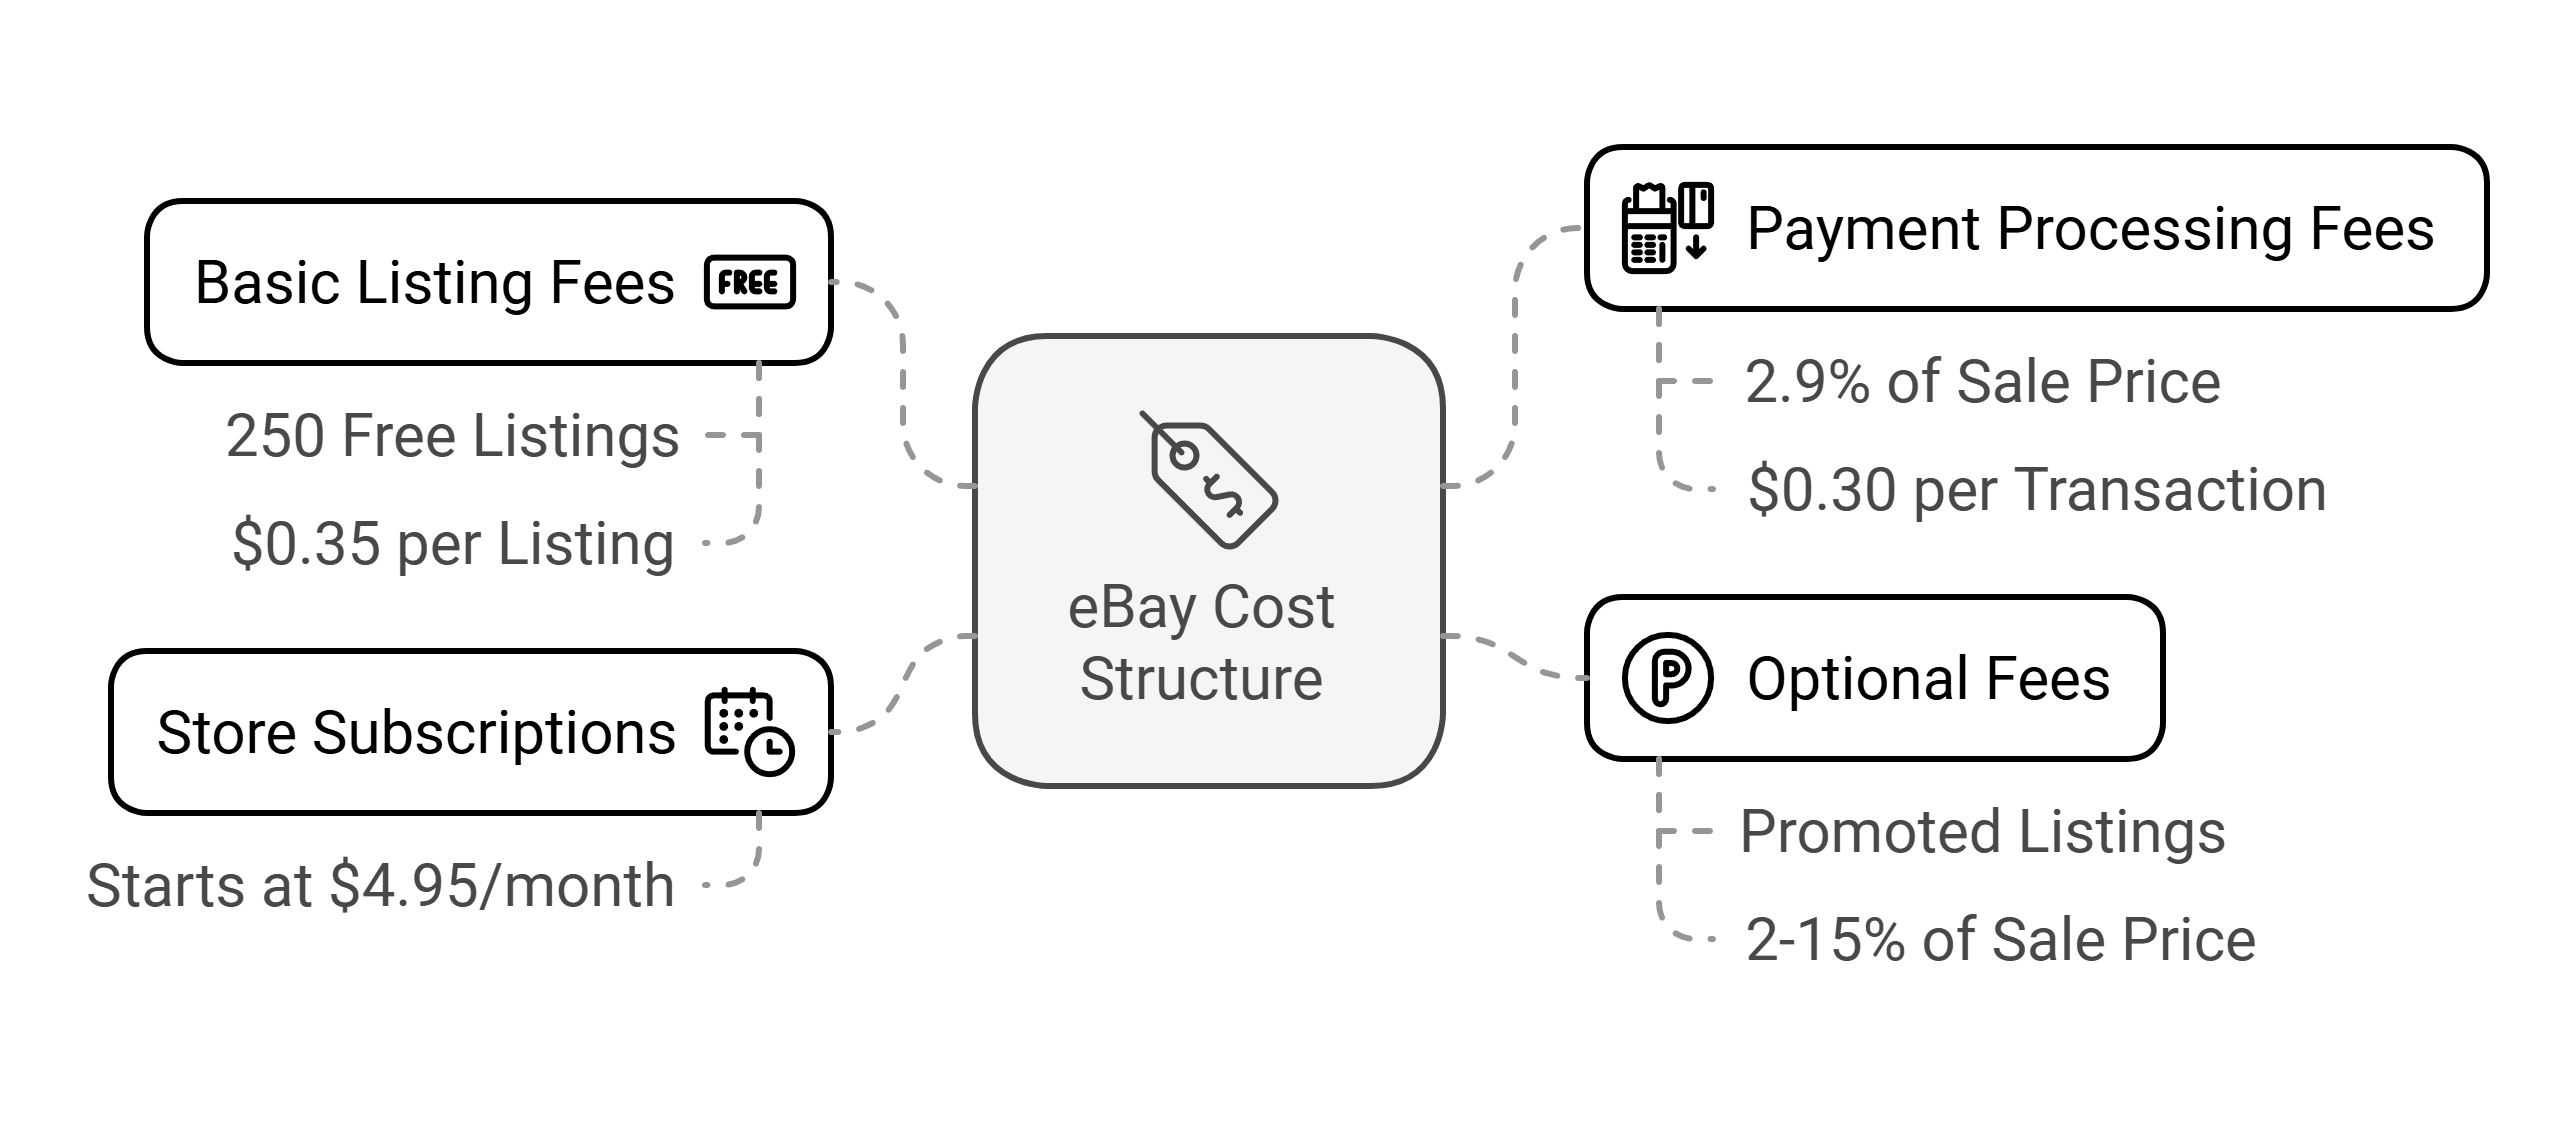
Key fees include:
- Basic listing: 250 free listings monthly, then $0.35 per listing
- Payment processing: 2.9% + $0.30 per transaction
- Optional fees: Promoted listings (2-15% of sale price)
- Store subscriptions start at $4.95/month
Who Succeeds on eBay
Sellers need to price items competitively while maintaining enough margin to cover fees.
The platform works particularly well for those selling unique or niche products, as it attracts collectors and enthusiasts.
Customer service matters - quick responses and clear communication help build a strong seller reputation. Many successful sellers mix both auction and fixed-price formats to maximize their reach and profitability.
Etsy
Etsy has established itself as the leading marketplace for handmade, vintage, and unique items, serving over 91.5 million active buyers in 2024. The platform specializes in connecting creative entrepreneurs with buyers seeking distinctive products.
Etsy Market Snapshot
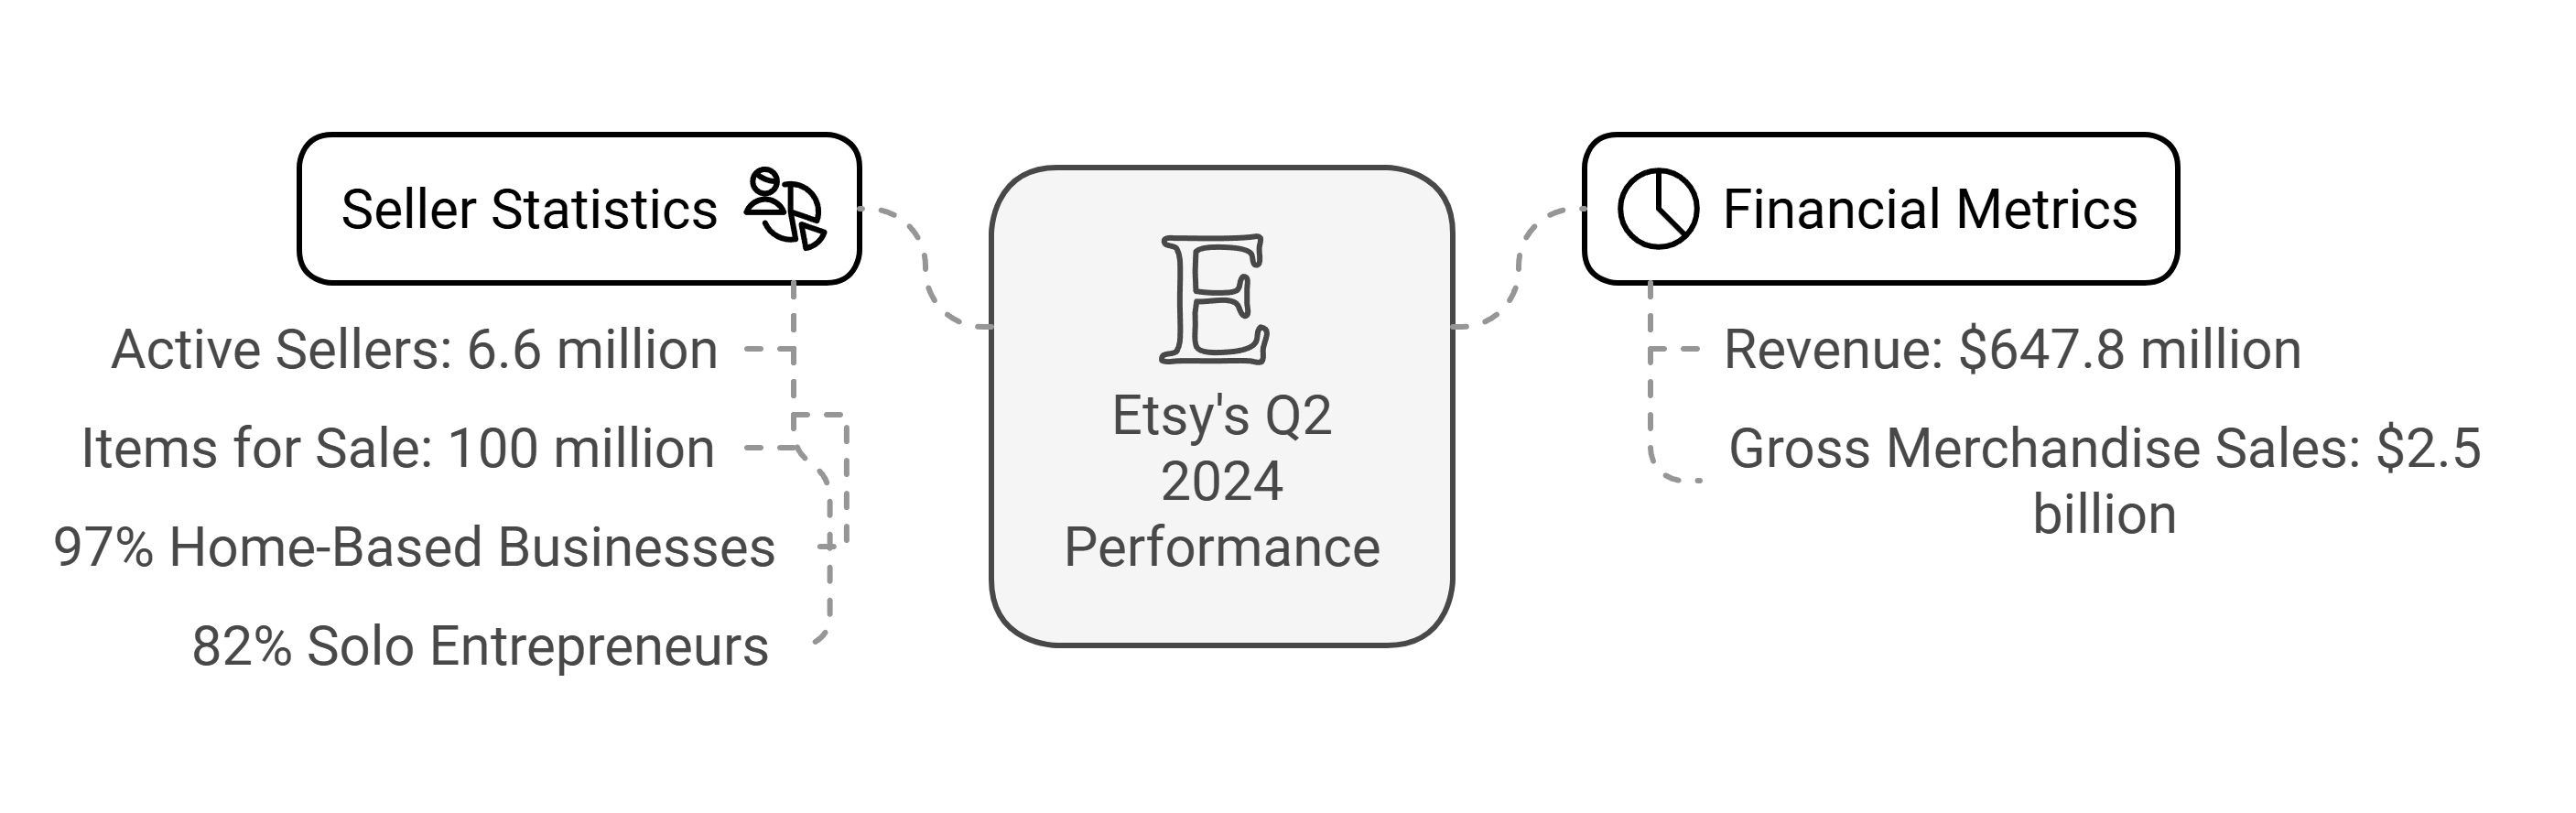
Etsy’s Q2 2024 performance reveals revenue of $647.8 million and gross merchandise sales of $2.5 billion. The platform hosts over 6.6 million active sellers and features more than 100 million items for sale.
Notably, 97% of Etsy sellers run their businesses from home, with 82% operating as solo entrepreneurs.
Key Market Statistics
The platform’s unique position is reflected in its data:
- Home & Living is the most popular category, representing 35% of sales
- 80% of sellers are women
- 30% of visitors are aged 25-34
- 54% of sellers use multiple sales channels
- International sales make up 47% of total transactions
Bonus: Explore the most important Etsy Statistics and compare their performance!
Etsy’s Buyer Demographics and Behavior
The platform attracts a distinct shopping audience. Almost half of Etsy visitors are aged 18-34, making it particularly effective for products targeting young adults and young parents. While the majority of buyers are female, the male user base has shown significant growth.
The platform maintains strong buyer retention, with 6.9 million habitual buyers as of Q2 2024 and 37 million repeat buyers recorded in Q4 2023.
Market Reach and Growth
Etsy’s global presence is substantial, with the US being the primary market, followed by the UK contributing 12.7% of total sales. The platform attracts over 400 million monthly visitors, with an average visit duration exceeding 5 minutes. In
Q2 2024 alone, Etsy acquired 5.6 million new buyers, showing continued market expansion.
Etsy’s Cost Structure
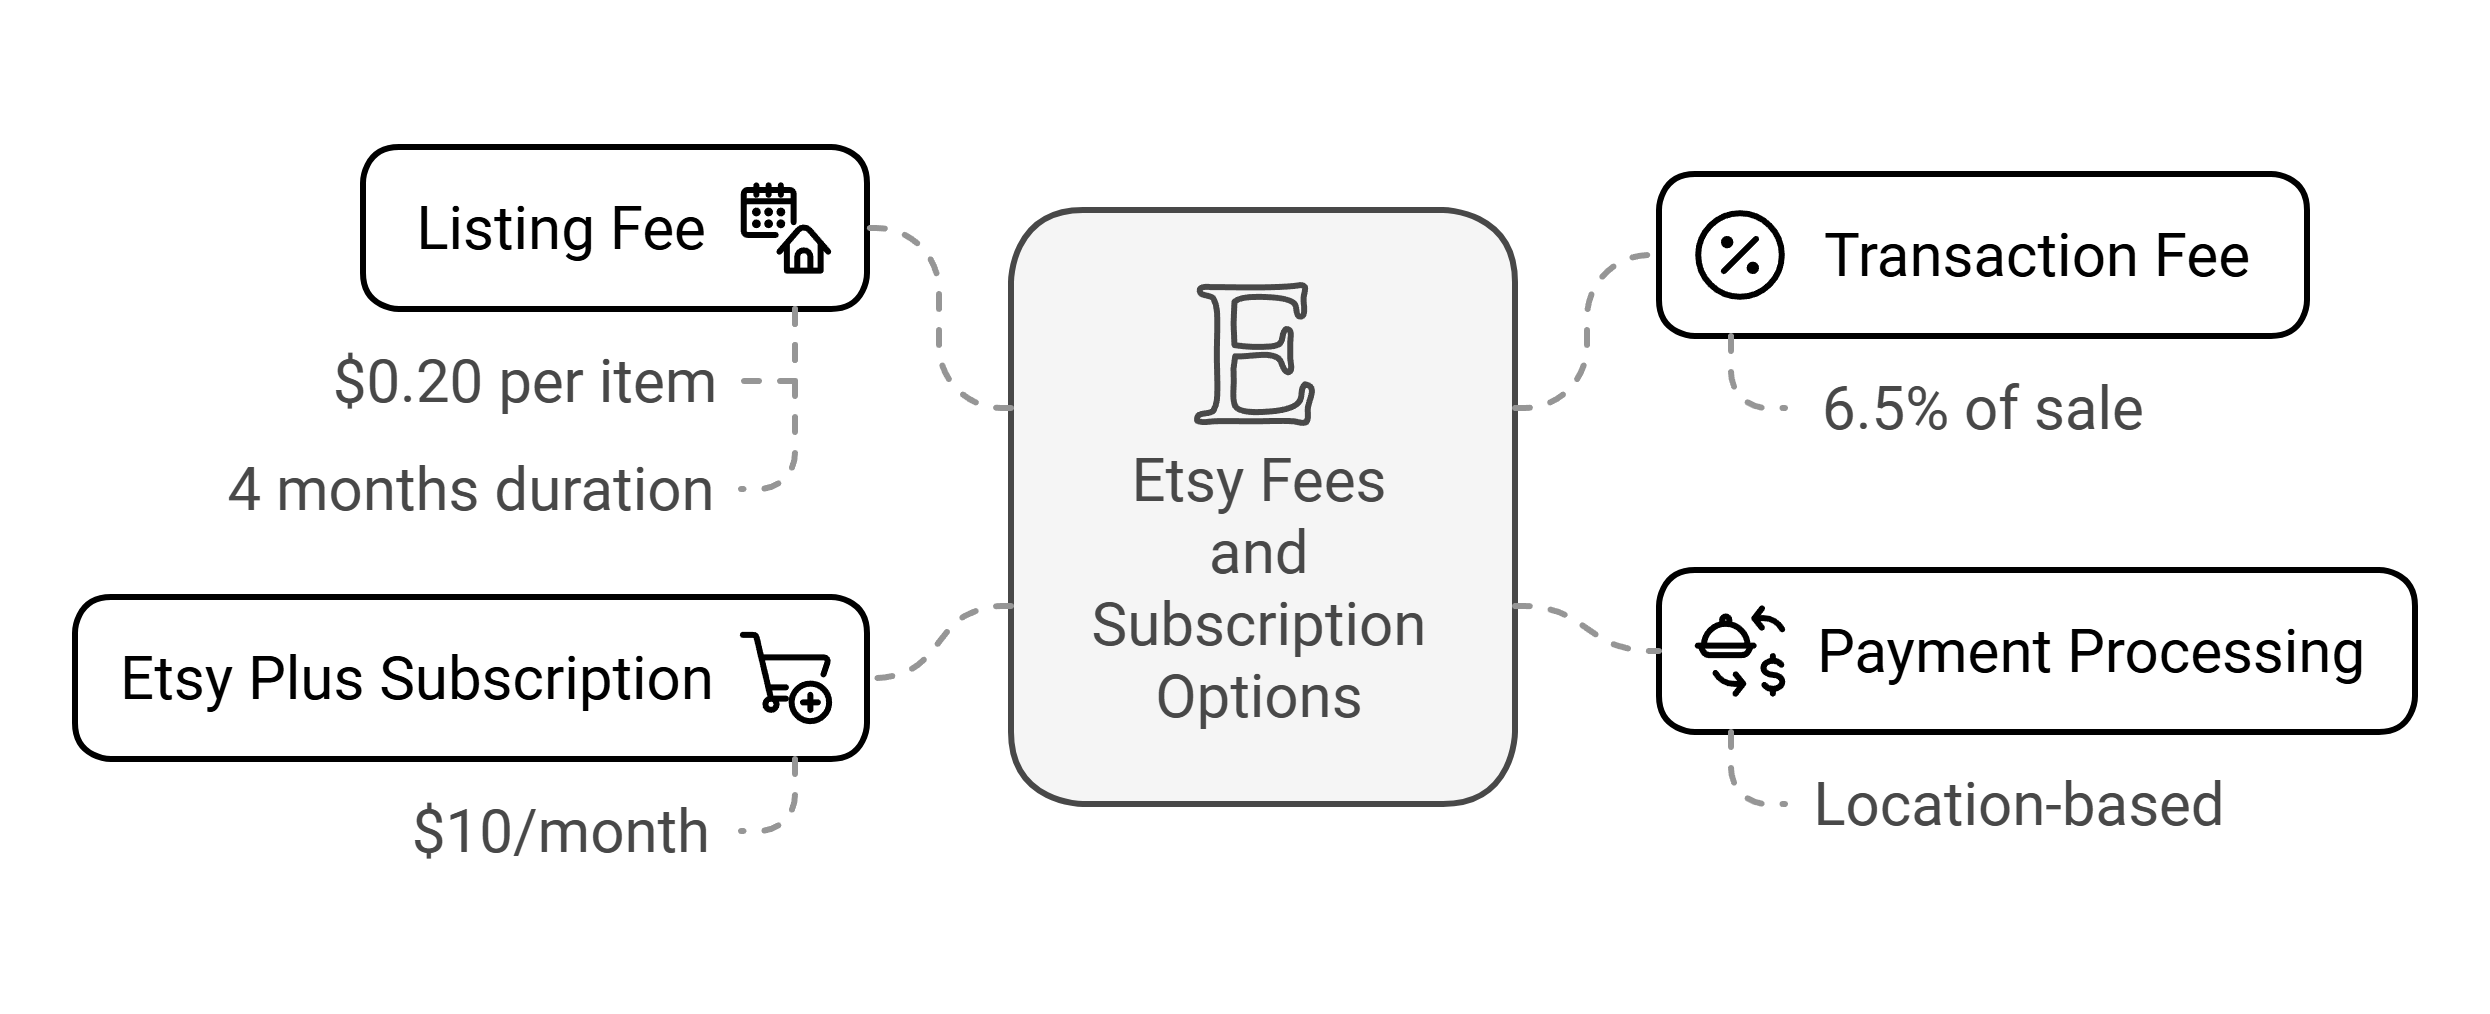
Sellers should consider these primary fees:
- Listing fee: $0.20 per item for 4 months
- Transaction fee: 6.5% of each sale
- Payment processing: Varies by location
- Optional Etsy Plus subscription: $10/month
- Advertising fees: Optional, with rates varying by campaign type
Who Succeeds on Etsy
Successful Etsy sellers create unique, high-quality products. The platform suits designers who make original items or sell vintage collections. Good photos, clear product details, and quick customer service help shops succeed.
Sellers also need to keep steady stock levels and use SEO keywords to show up better in Etsy searches.
Walmart
Walmart has transformed from a traditional retail giant into a major ecommerce player, operating 11,003 stores worldwide while building a strong online presence. The platform connects retailers with a vast customer base through both physical and digital channels.
Walmart Market Snapshot
Walmart’s fiscal year 2024 shows impressive performance with $648 billion in annual revenue and global net sales of $642.6 billion, marking a 6% increase from the previous year.
The marketplace achieved 21% global ecommerce growth and 22% US ecommerce growth in Q2 2024, demonstrating strong digital expansion.
Key Market Statistics
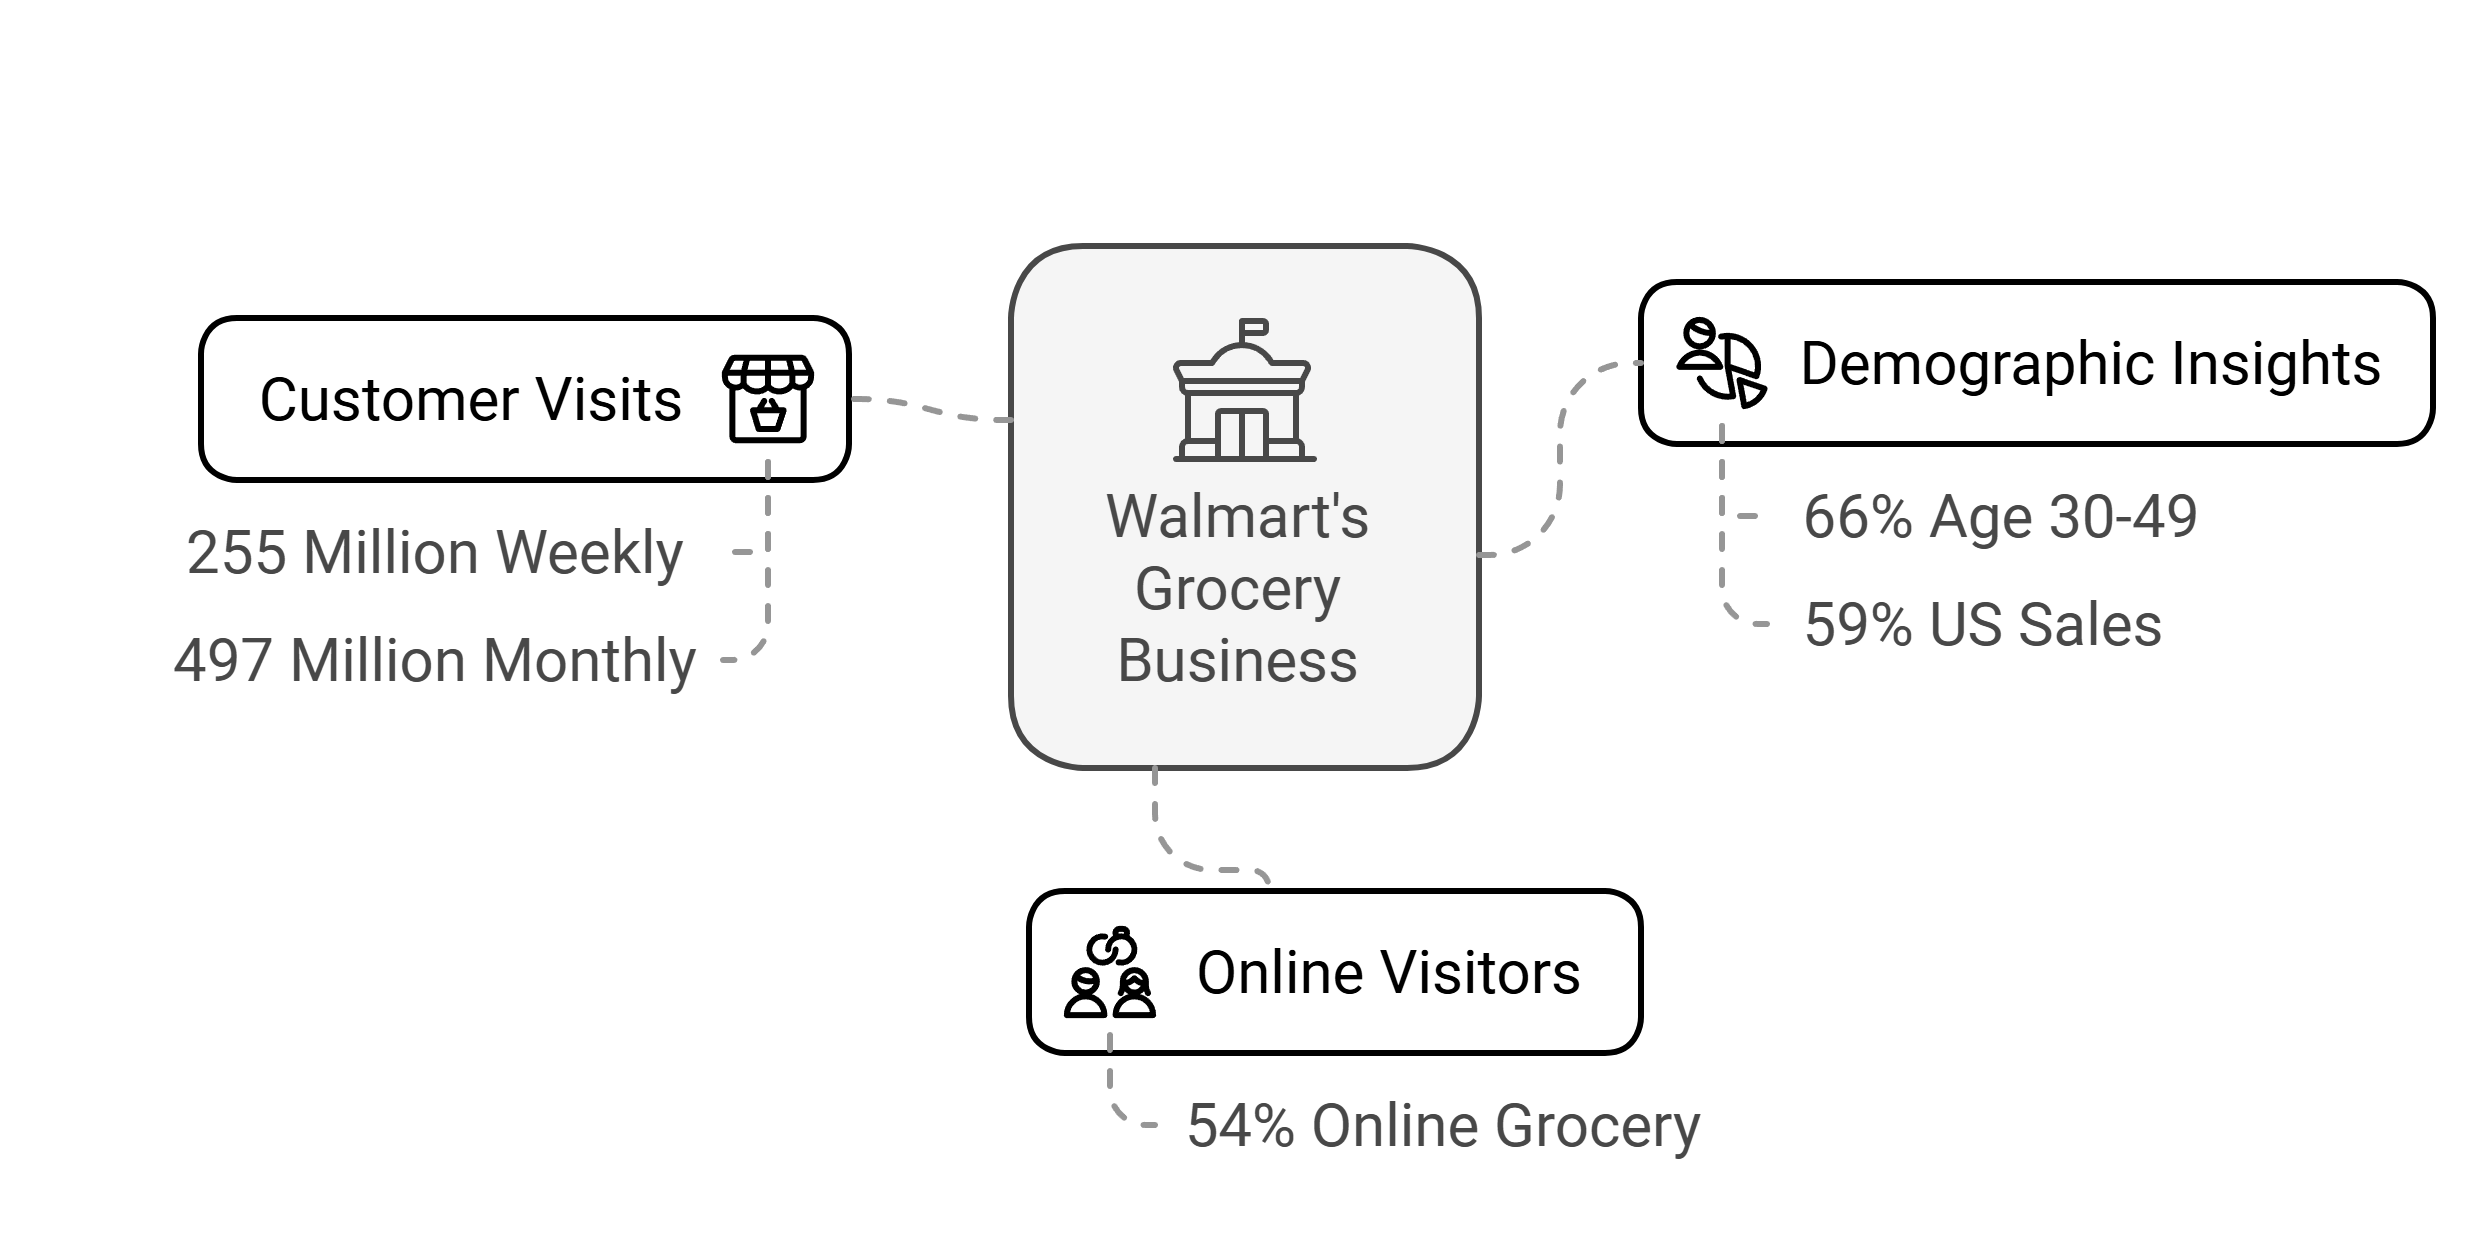
Current market data reveals Walmart’s significant reach:
- 255 million weekly customer visits
- 497 million monthly online visitors
- 66% of shoppers aged 30-49 buy groceries at Walmart
- 54% of US customers use Walmart for online grocery
- 59% of US sales come from grocery items
Bonus: Here are the latest Walmart statistics!
Walmart’s Digital Growth
Walmart continues to expand its ecommerce capabilities with 34 fulfillment centers in the US and 100 international ecommerce-focused distribution centers.
The platform’s digital infrastructure supports both first-party and third-party sellers, with Walmart Fulfillment Services (WFS) offering comprehensive logistics solutions.
Walmart’s Cost Structure
Walmart Marketplace offers a straightforward fee structure:
- No monthly subscription fees
- Category-based referral fees ranging from 6% to 20%
- Optional fulfillment fees through WFS
- Competitive shipping rates through Walmart’s logistics network
Who Succeeds on Walmart
Successful Walmart sellers deliver orders reliably and meet high performance standards. Sellers must have good inventory systems and meet Walmart’s quality rules. They need to ship and deliver 95% of orders on time and keep cancellations under 1.5%.
The platform works well for established brands, especially those using Walmart’s two-day shipping to boost sales.
Temu

Temu has rapidly emerged as a significant ecommerce marketplace since its launch, reaching 167 million monthly active users in 2024. The platform connects users with merchants who ship products directly from China to customers worldwide.
Temu Market Snapshot
Temu’s growth has been remarkable, achieving $1 billion in monthly gross merchandise volume by June 2023. The platform attracts over 540 million visitors monthly and has secured its position as the third most popular shopping app in the
US, following Amazon and Walmart. The platform saw over 52 million app downloads worldwide in May 2024.
Bonus: Explore Key Temu Stats now!
Key Market Statistics
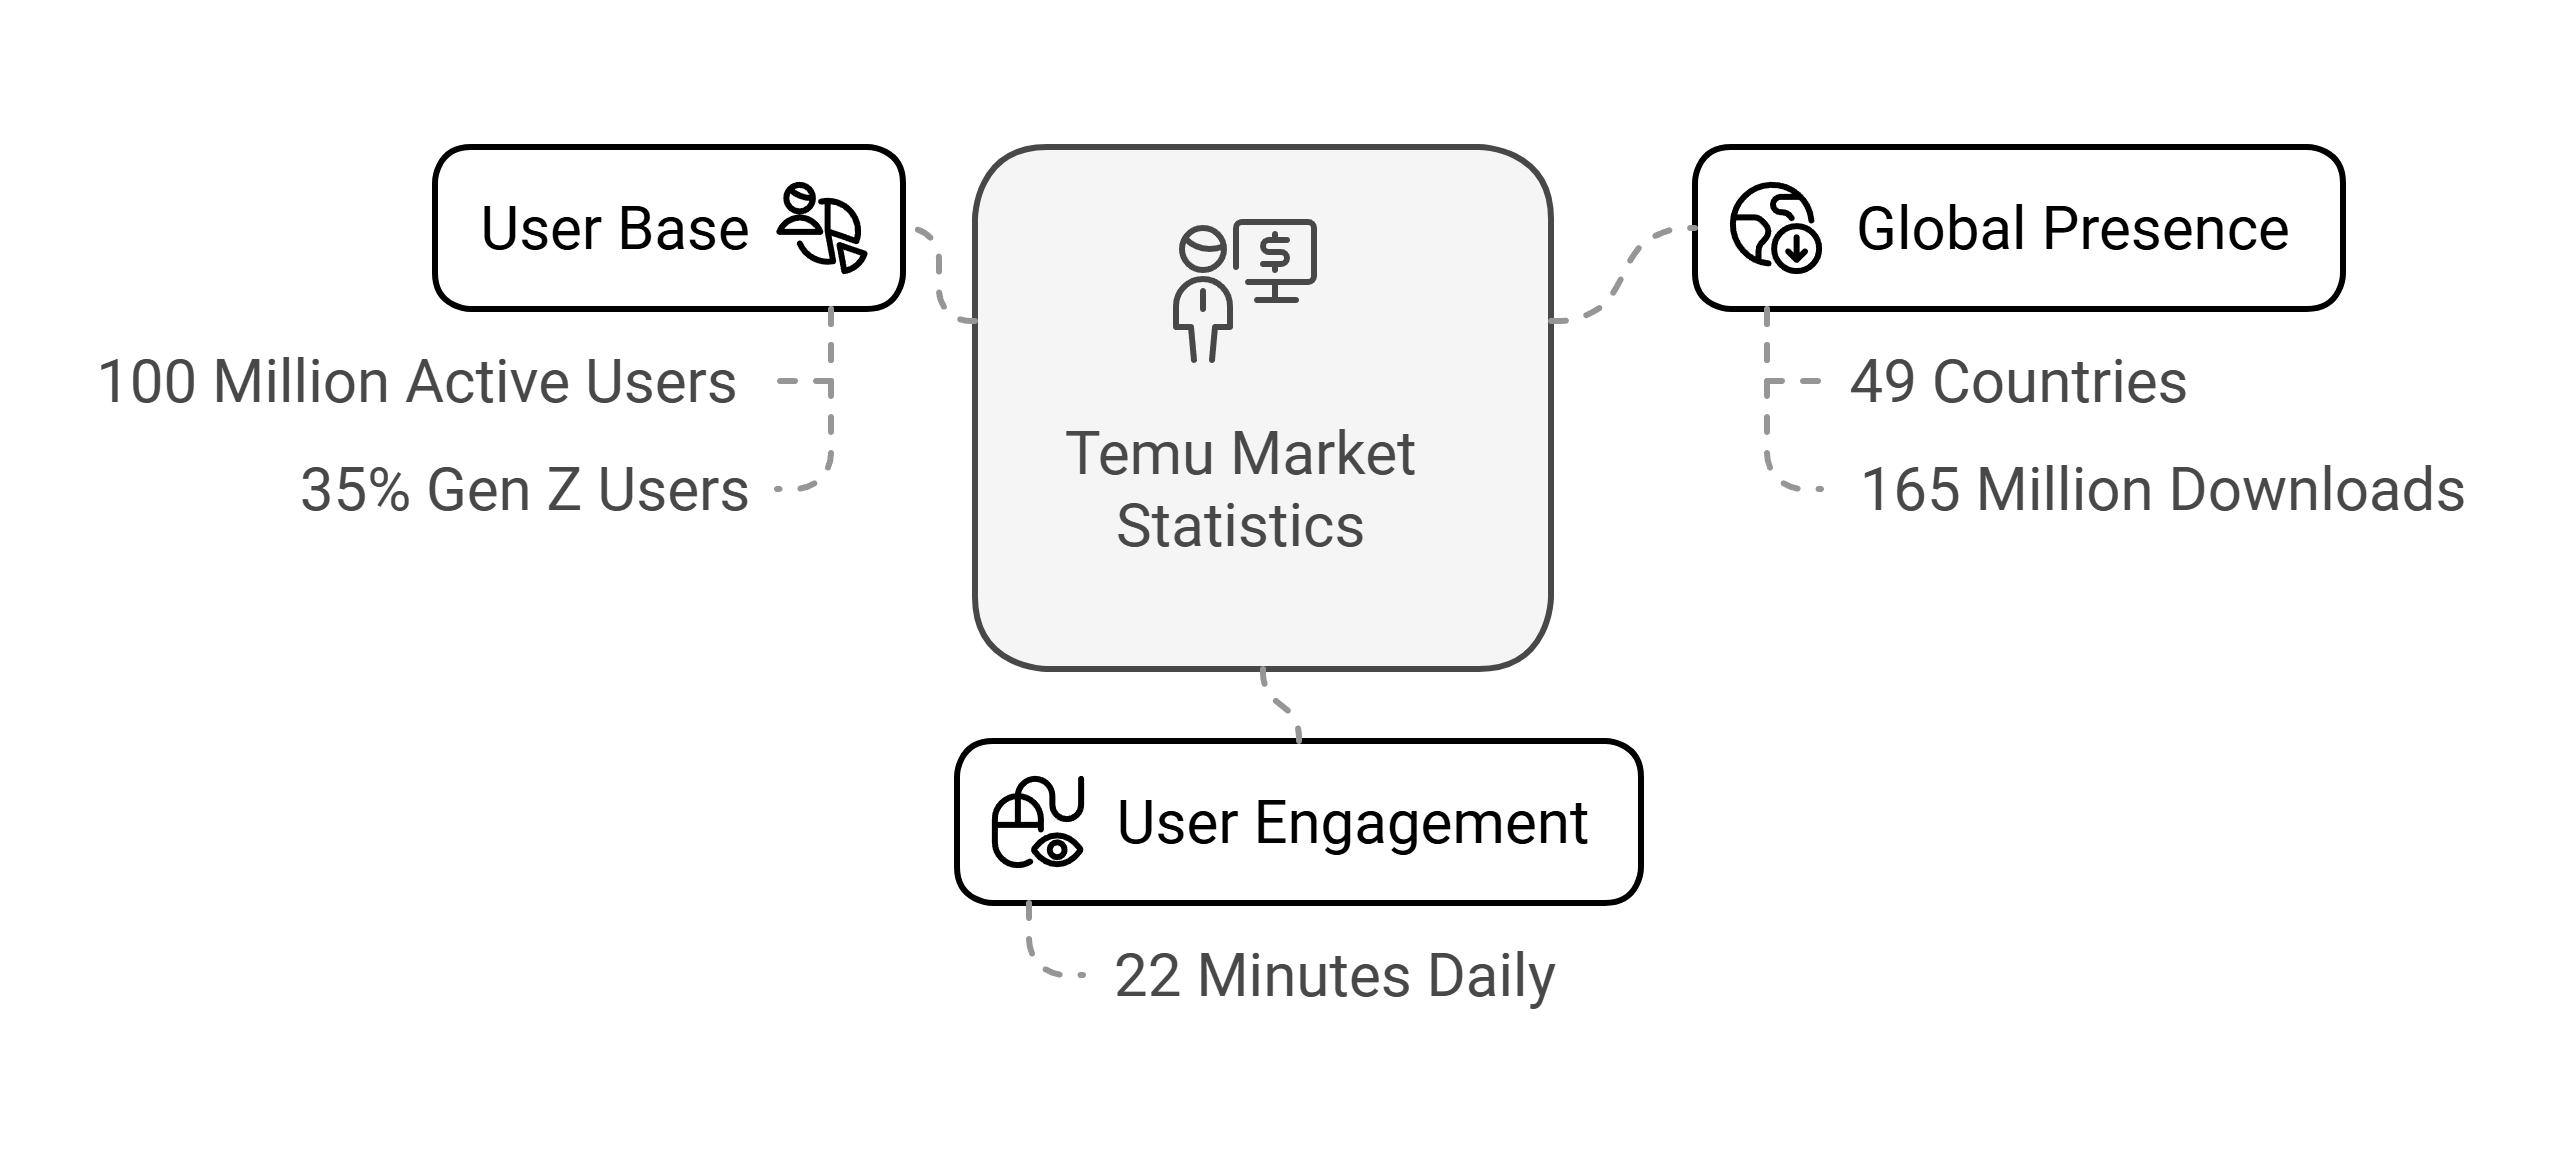
The platform’s reach is reflected in its data:
- 100 million active users in the US
- Over 165 million downloads worldwide
- 22 minutes average daily time spent per user
- 35% of users are Gen Z
- Platform operates in 49 countries
Temu’s Buyer Demographics and Behavior
Temu attracts a diverse shopping audience, with 20.69% of visitors aged 35-44. Customer spending patterns show that 40% of US shoppers spend $20 or less per transaction. The platform maintains a 7-day retention rate of 18.5% among
US consumers, with the Americas representing 42% of its global market share.
Temu’s Cost Structure and Operations
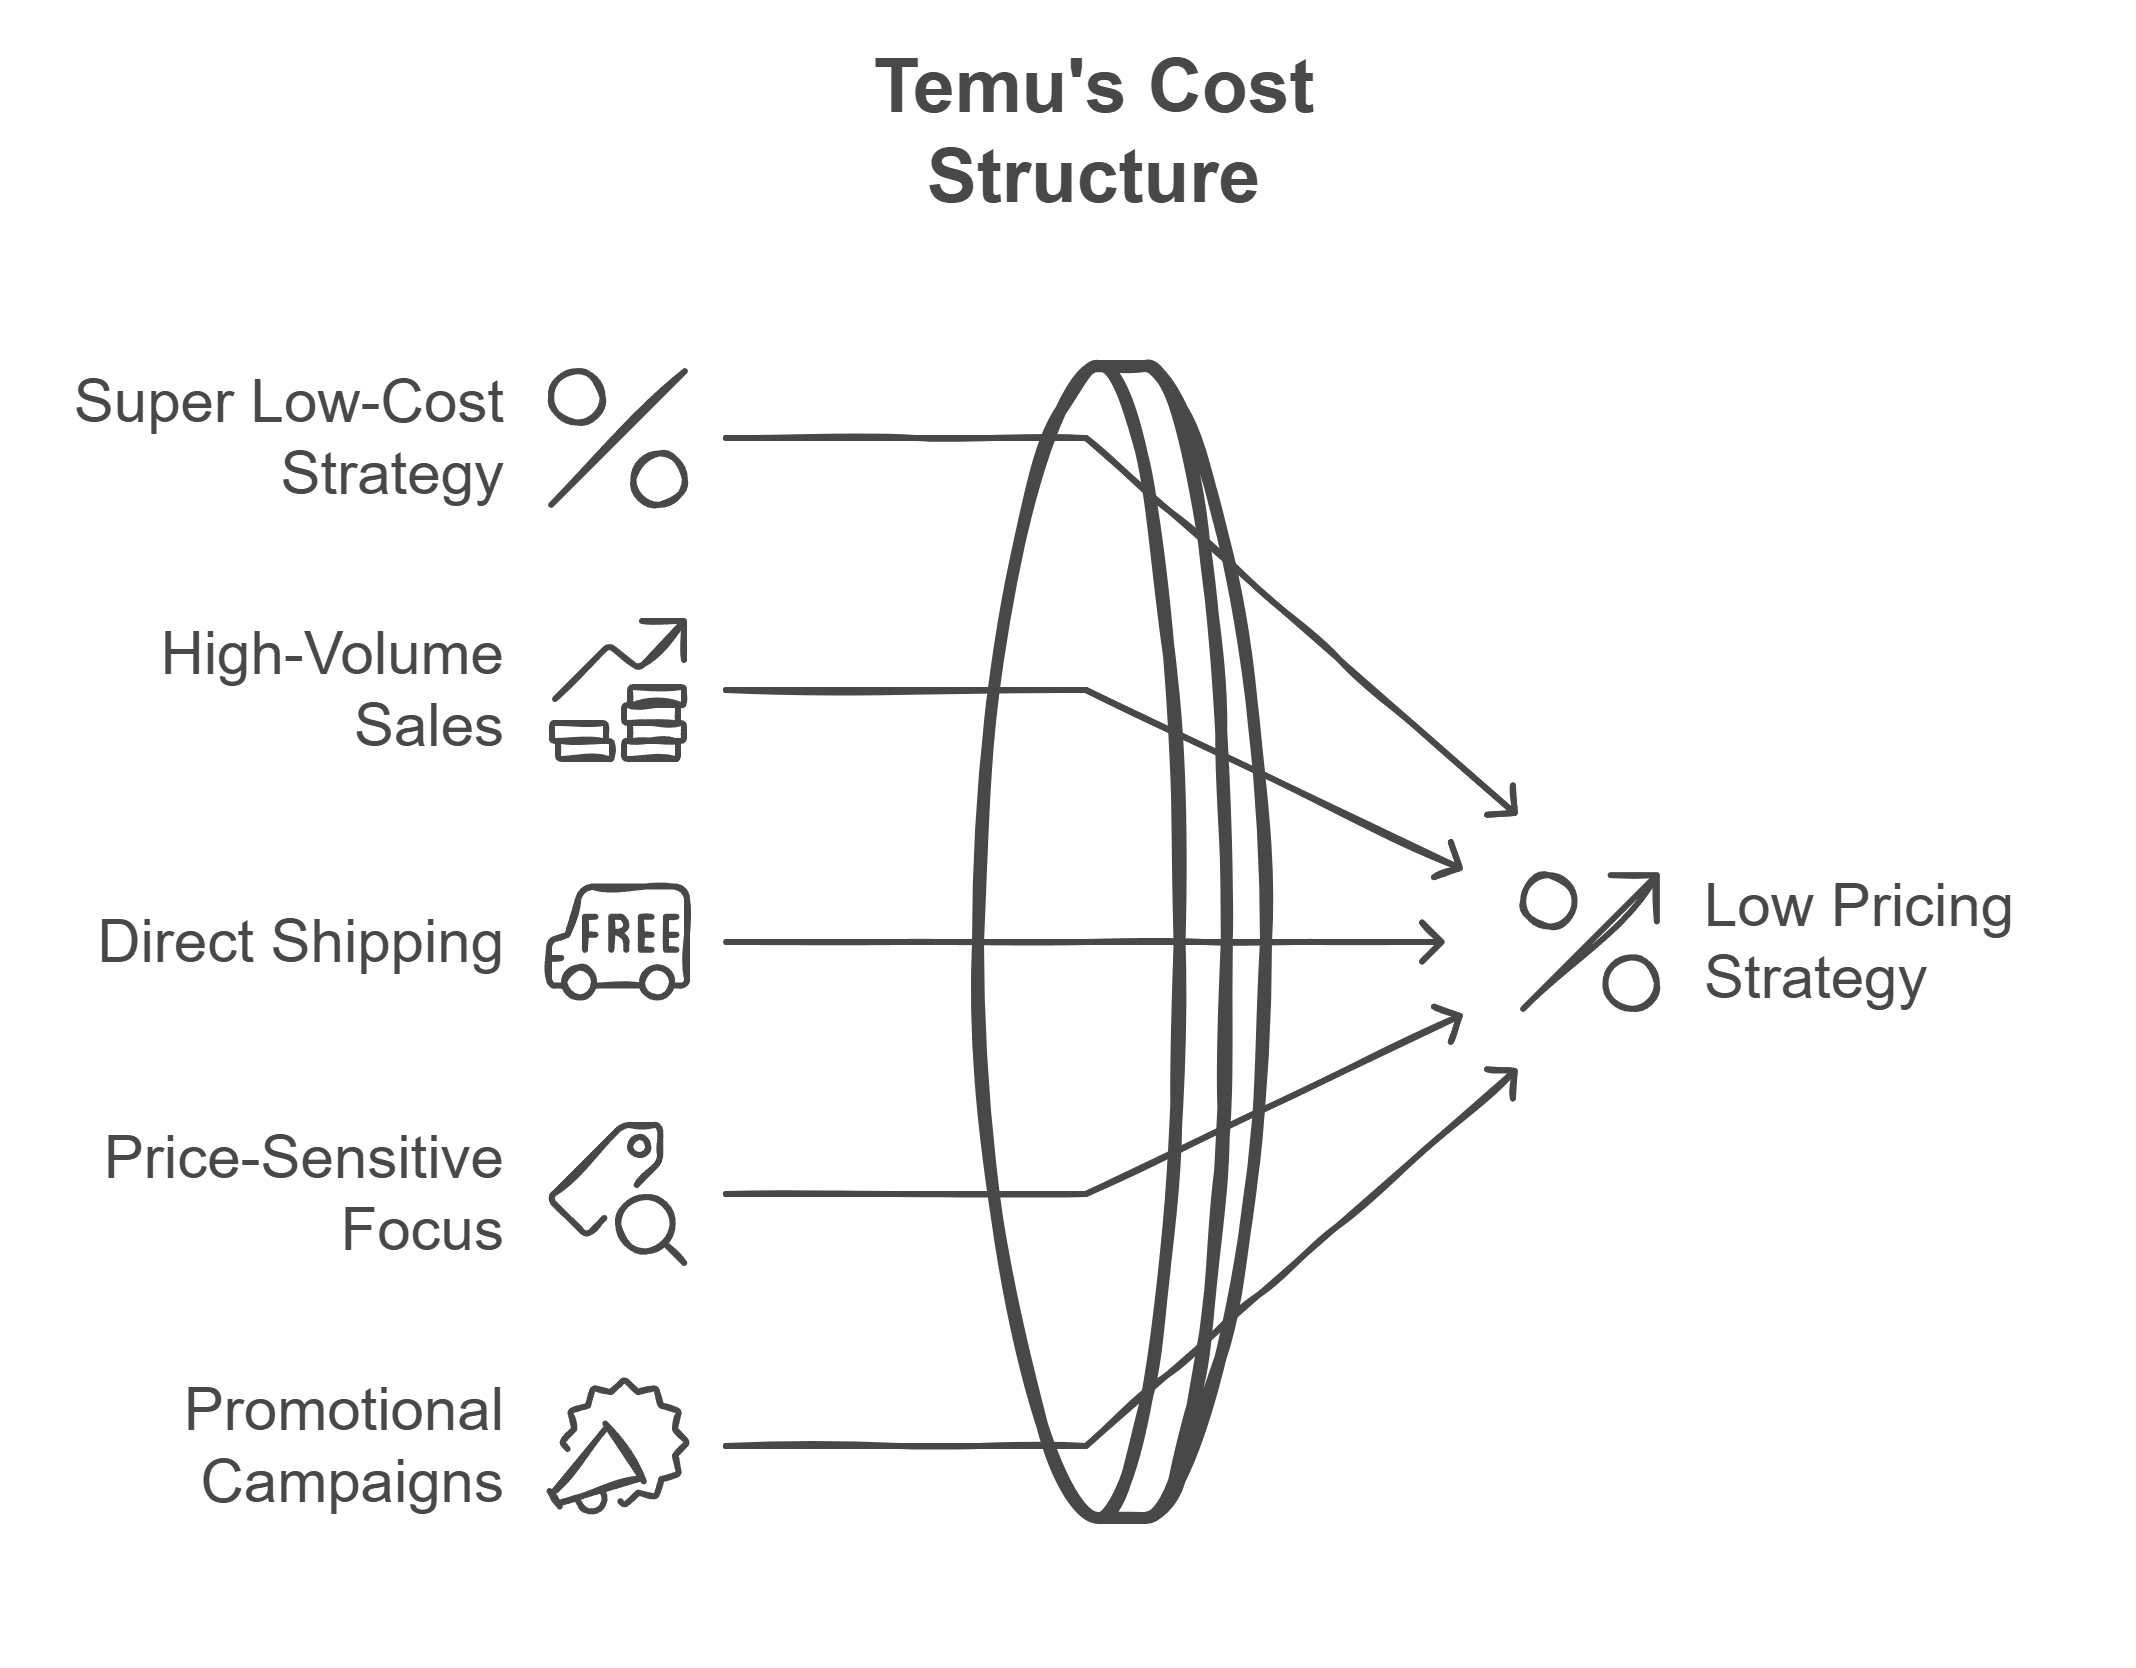
Temu operates on a direct-from-manufacturer model that enables low pricing:
- Super low-cost pricing strategy
- High-volume sales with low margins
- Direct shipping from Chinese manufacturers
- Focus on price-sensitive consumers
- Regular promotional campaigns and discounts
Who Succeeds on Temu
Temu works best for sellers who can profit from low prices and high sales volumes. The platform fits manufacturers who can price items cheaply and handle many orders.
But sellers should note that Temu’s low-price focus isn’t right for premium products, and its discount-store image might affect their brand reputation.
Alibaba

Alibaba has evolved from a B2B wholesaler into China’s largest ecommerce ecosystem, combining B2B, B2C, and C2C platforms. The company serves as a vital bridge between Chinese manufacturers and global markets through its multiple commerce platforms.
Alibaba Market Snapshot
In fiscal year 2024, Alibaba Group recorded revenues of 941.17 billion yuan ($130.35 billion). Chinese-based ecommerce remains the company’s core business, generating 582.73 billion yuan in revenue, while international commerce retail contributed 49.9 billion yuan.
The platform serves 903 billion annual active buyers.
Key Market Platforms
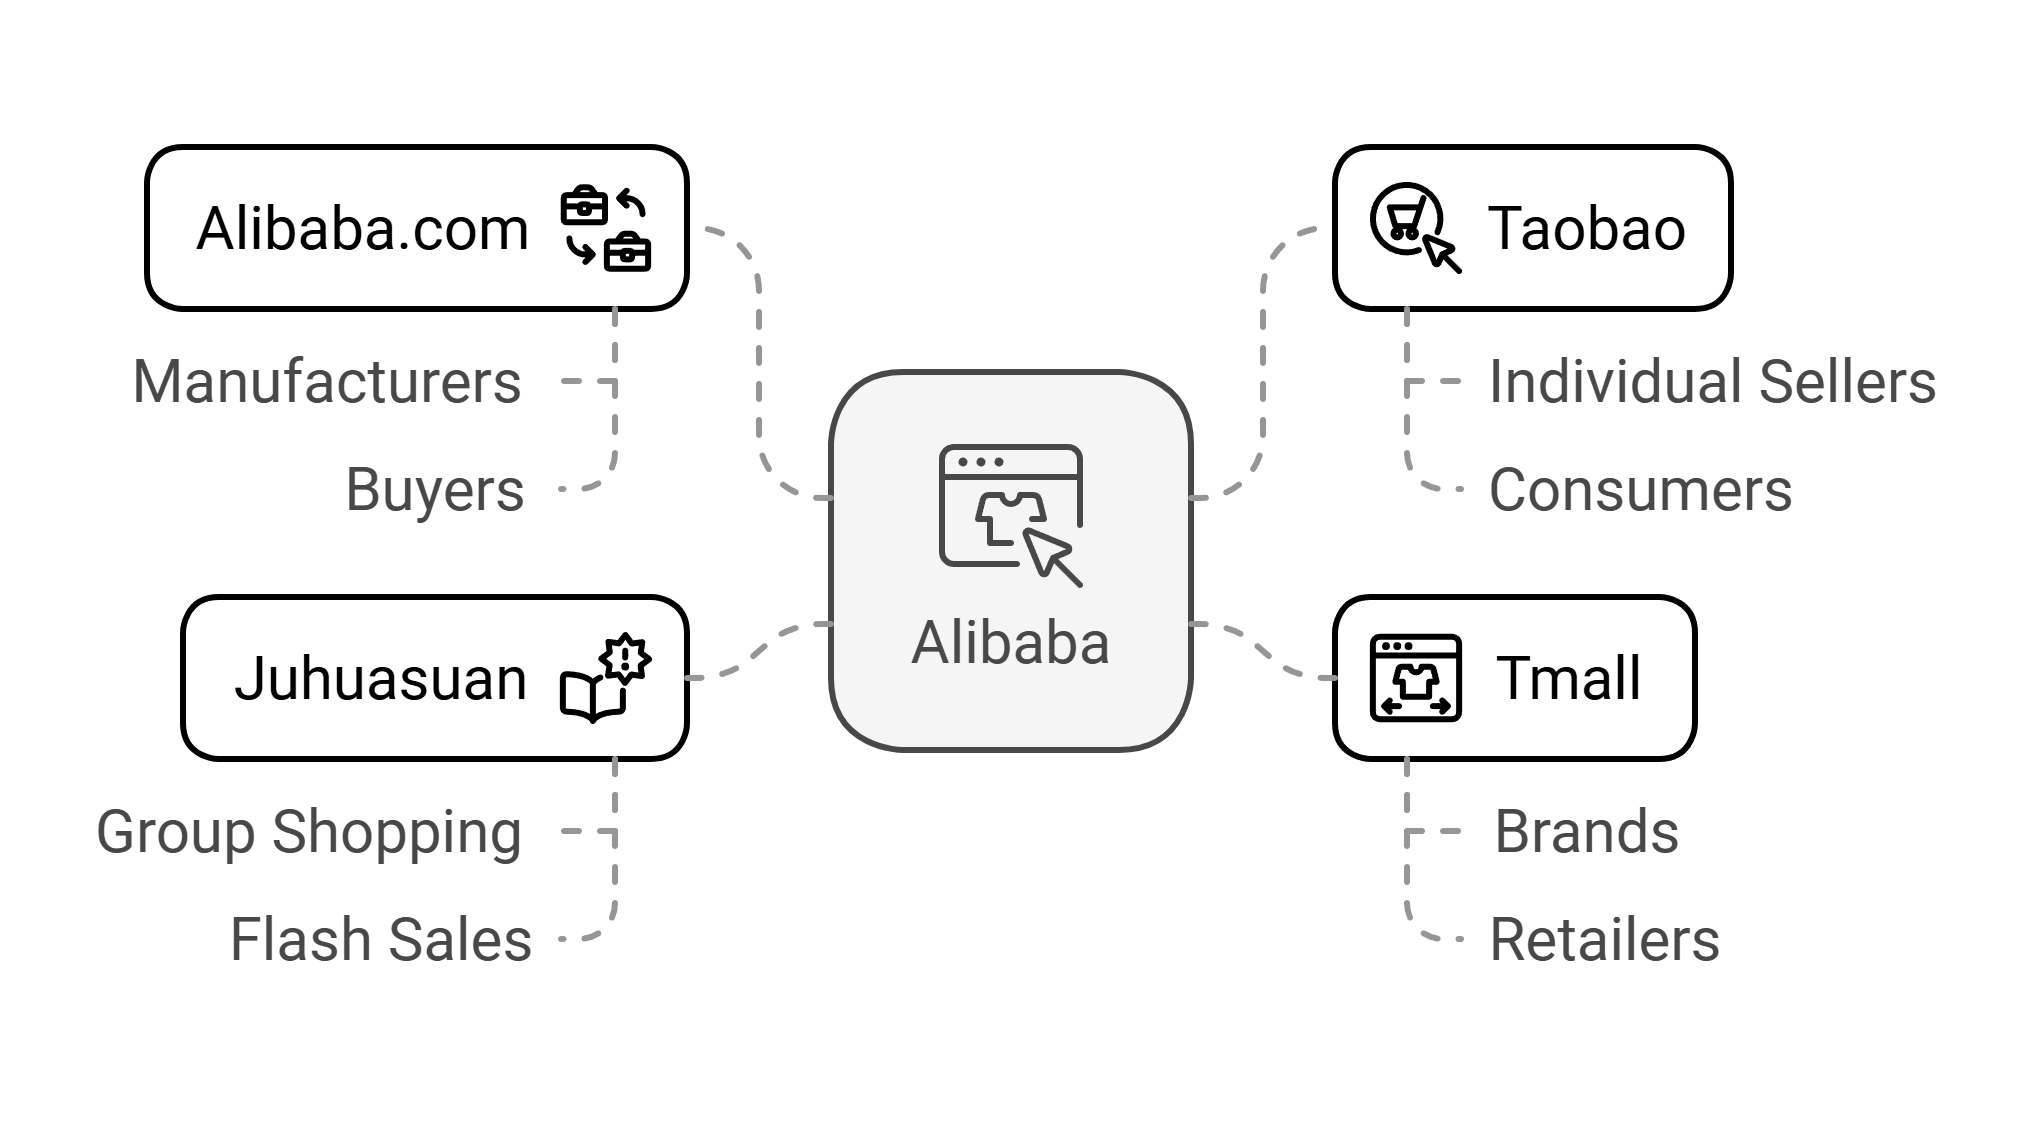
Alibaba operates through multiple specialized marketplaces:
- Alibaba.com: B2B platform connecting manufacturers with buyers
- Taobao: C2C marketplace for individual sellers
- Tmall: B2C platform focused on brands and retail
- Juhuasuan: Group shopping and flash sales website
International retail platforms serving over 300 million overseas consumers
Alibaba Revenue Structure
Alibaba makes most of its money (65%) from Chinese retail ecommerce. It earns from online ads, marketing services, and promoted listings. It also collects seller commissions and storefront fees.
The company now offers cloud computing and entertainment services for extra income.
Operational Challenges
The marketplace faces several key challenges:
- Increasing customer acquisition costs (477 yuan per customer)
- Growing competition from social commerce platforms
- Regulatory scrutiny in domestic market
- International trust concerns in some markets
- Anti-monopoly regulations in China
Who Succeeds on Alibaba
Alibaba suits businesses that can sell well in both Chinese and global markets. The platform is best for manufacturers and brands that deliver quality products while handling big orders.
Sellers must know Chinese business customs and manage international shipping well. Having verified supplier status and good service helps build customer trust.
MercadoLibre
MercadoLibre has established itself as Latin America’s leading ecommerce and fintech ecosystem since its founding in 1999. The platform serves multiple markets across the region with a comprehensive suite of commerce and financial solutions.
MercadoLibre Market Snapshot
MercadoLibre’s Q2 2024 performance showcases strong growth with revenue reaching $5.1 billion, up 42% year-over-year. The platform achieved $12.6 billion in Gross Merchandise Volume (GMV) and $46.3 billion in Total Payment Volume (TPV).
Net income rose 103% to $531 million, with a 10.5% margin.
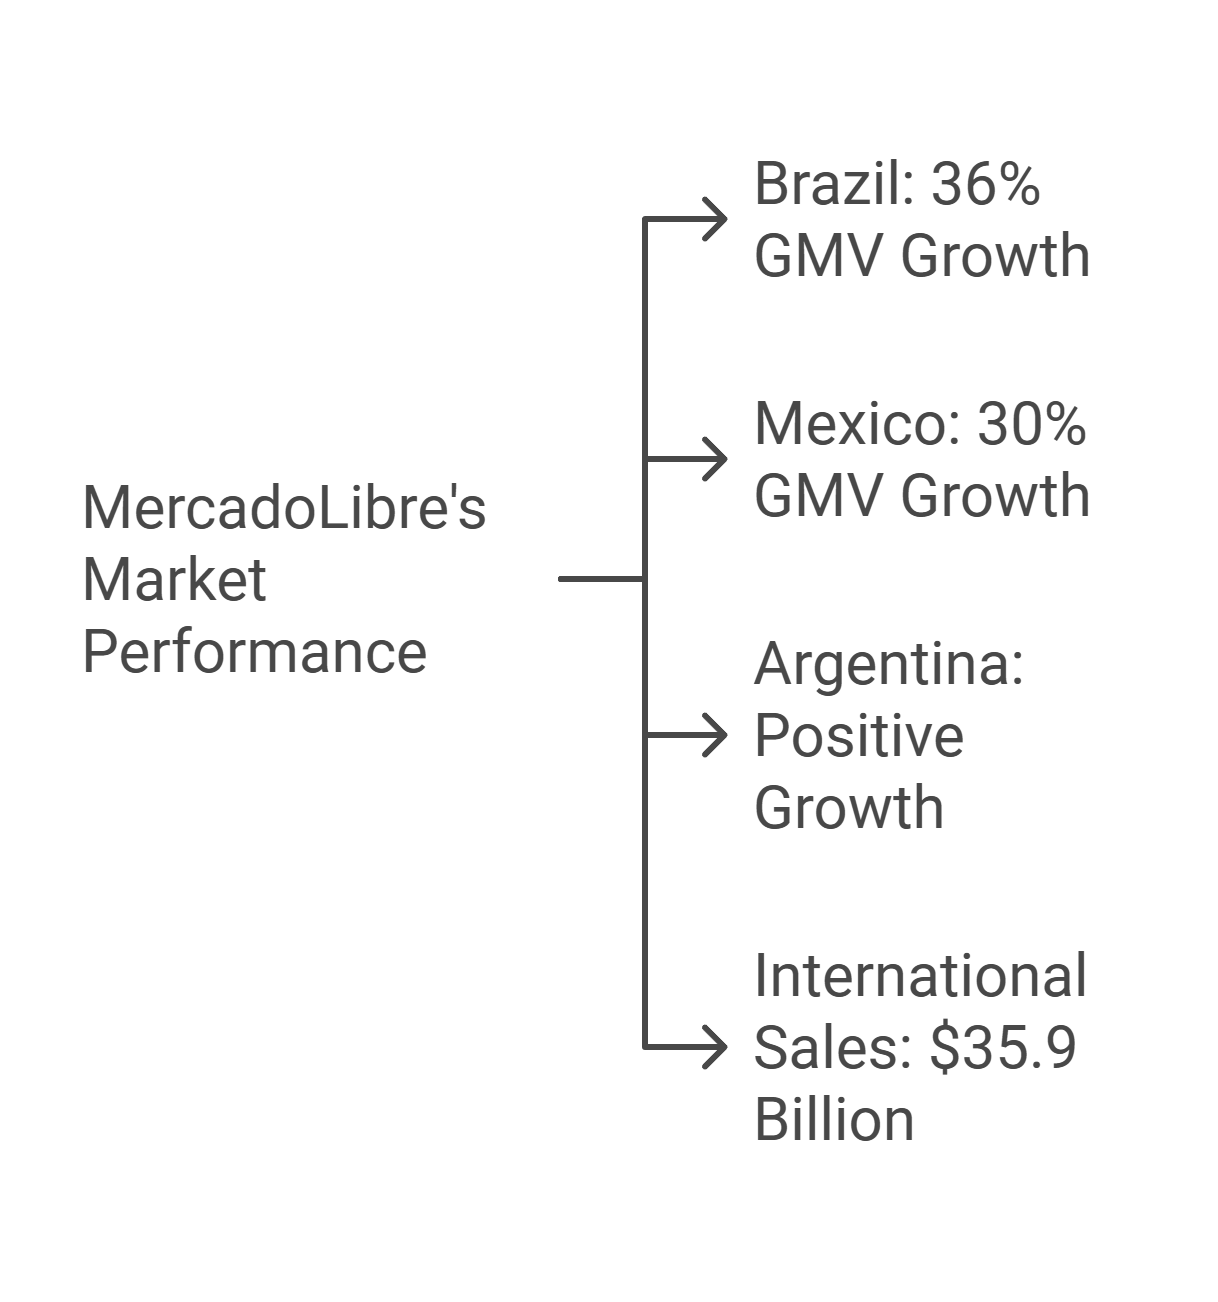
Regional Performance
The platform shows distinct market strengths:
- Brazil: FX-neutral GMV growth of 36% year-over-year
- Mexico: 30% GMV growth with significant infrastructure investment
- Argentina: Returning to positive growth in items sold
- International sales reaching $35.9 billion in Q3 2024
MercadoLibre Growth
MercadoLibre has expanded its shipping network with 34 US fulfillment centers and 100 international centers. The company opened a new center in Texas to serve Mexican buyers. It has also added 4% more free shipping options and made deliveries faster in Brazil and Colombia.
Fintech Integration
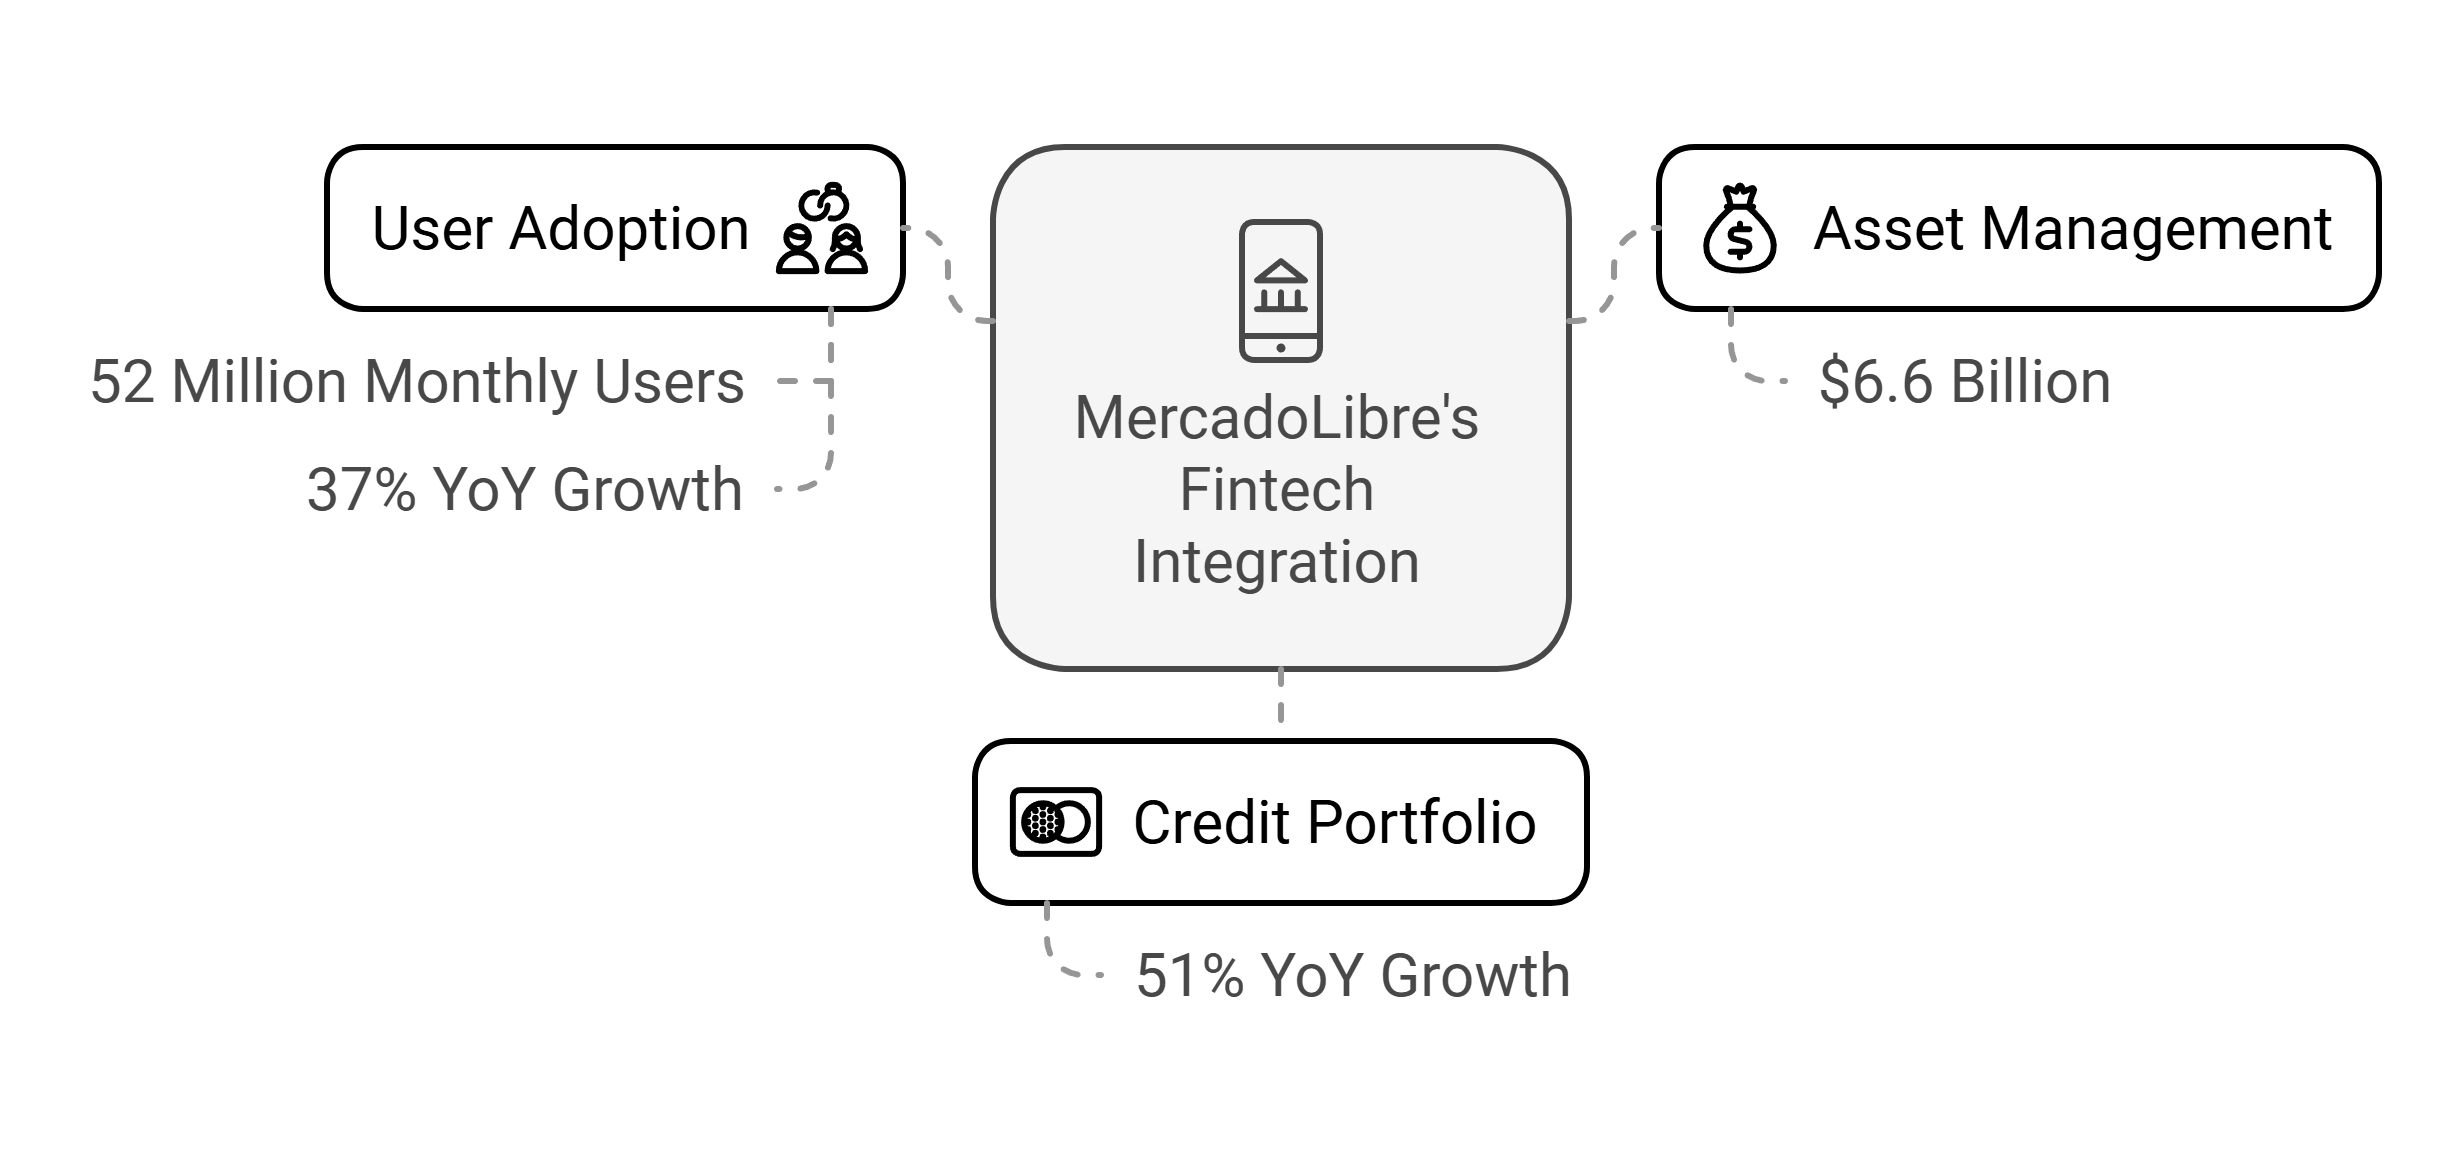
The platform’s financial services show strong adoption:
- 52 million monthly active fintech users
- 37% year-over-year growth in fintech users
- $6.6 billion in assets under management
- Credit portfolio growth of 51% year-over-year
Who Succeeds on MercadoLibre
MercadoLibre suits sellers who understand Latin American markets. The platform works best for businesses that manage inventory well and ship orders quickly through MercadoLibre’s delivery network.
Sellers need to know local buying habits, price products competitively, and provide good customer service. Using both the platform’s shopping and payment tools helps sellers reach more customers across Latin America.
Shopee
Shopee has evolved from a customer-to-customer platform into Southeast Asia’s leading B2C marketplace, with significant presence across Asia and Latin America.
Since its launch in 2015, the platform has transformed regional ecommerce through innovative features and competitive pricing.
ShopeeMarket Snapshot
Shopee’s 2023 performance demonstrates strong growth with revenue reaching $9 billion, a 20.6% increase year-over-year. The platform achieved $78.5 billion in gross merchandise volume and processed 8.2 billion orders.
With 295 million active users, Shopee commands 45% of Southeast Asia’s ecommerce market.
Regional Presence
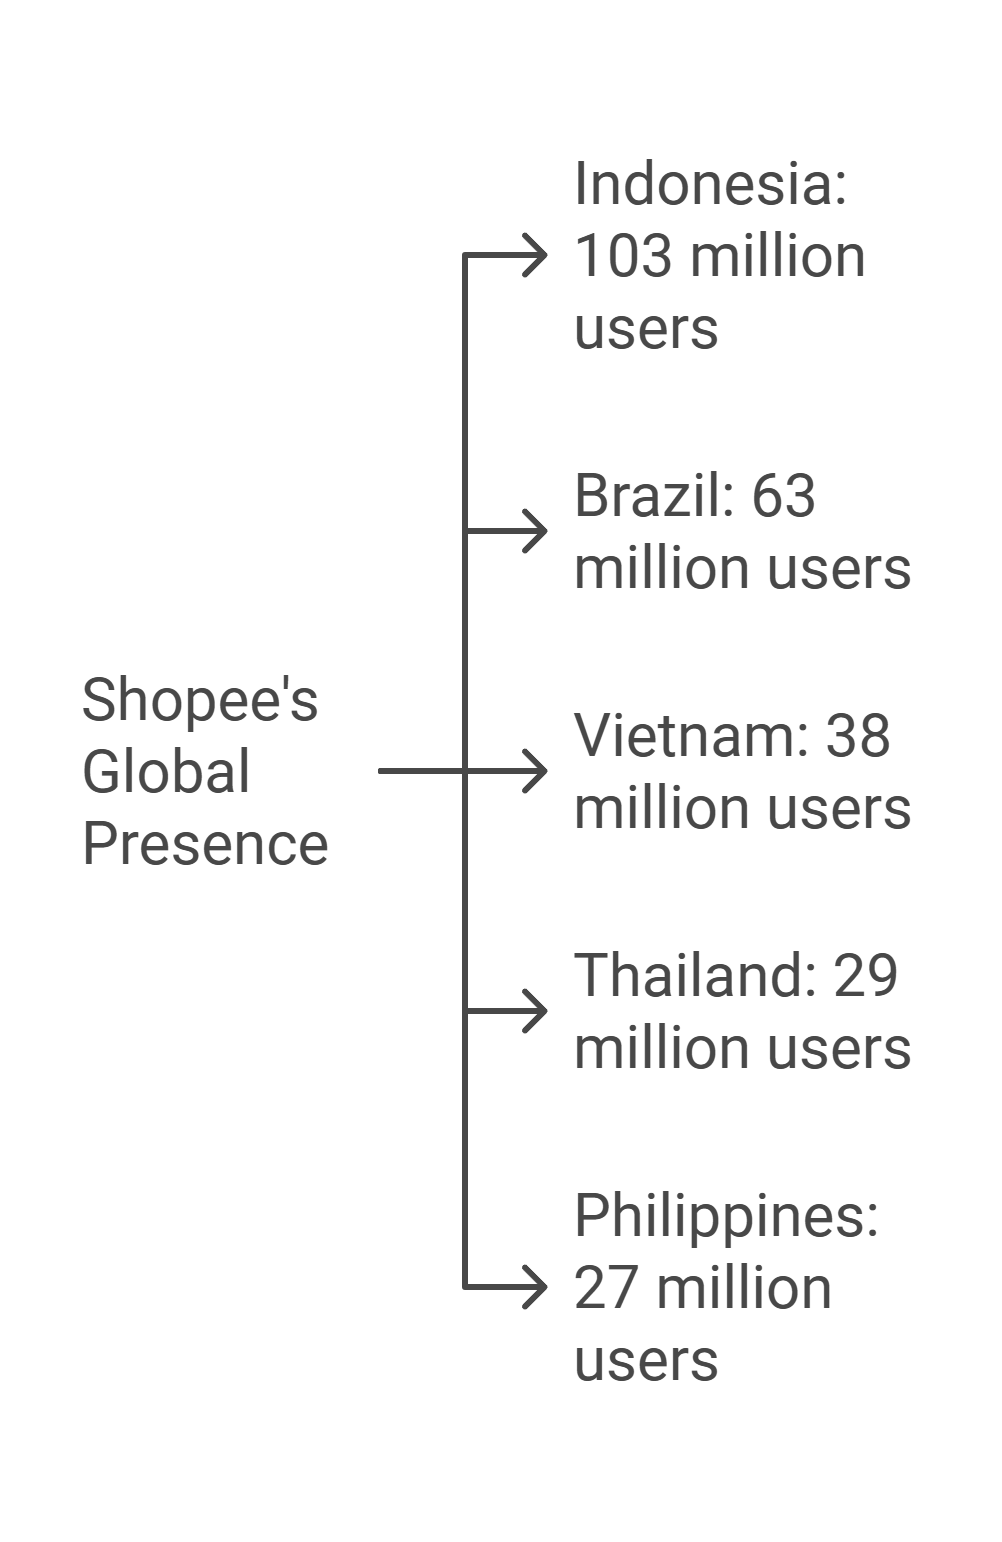
Shopee’s user base spans multiple markets:
- Indonesia: 103 million users (largest market)
- Brazil: 63 million users
- Vietnam: 38 million users
- Thailand: 29 million users
- Philippines: 27 million users
Shopee Platform Features
Shopee offers two distinct ways for sellers to reach customers:
1) Shopee Marketplace:
- Open to all sellers including part-time and resellers
- Commission rates 4.32-7.56% with Cashback Program
- Commission rates 7.56-10.8% without Cashback Program
- Access to free promotional tools and campaign participation
- Standard shipping and logistics support
2) Shopee Mall:
- Exclusive space for authorized brand owners and distributors
- Higher commission rates of 8.64-14.04% with Cashback Program
- Higher commission rates of 11.88-17.28% without Cashback Program
- Premium promotional tools and exclusive campaigns
- Enhanced visibility and brand presence
Who Succeeds on Shopee
Successful Shopee sellers use the platform’s game-like features and promotional tools well. The platform works best for sellers who join Shopee’s cashback program and price items competitively.
Sellers need to know what local customers want and use Shopee’s marketing tools, like live streams and interactive features. Regular participation in Shopee’s sales events and campaigns helps increase sales.
Allegro
Allegro stands as the dominant force in Polish e-commerce, transforming from its inception in 1999 into the country’s largest marketplace platform.
With over 14.9 million active buyers in Poland and a steadily expanding international presence, Allegro has successfully maintained its market leadership despite growing competition from global players.
Allegro Market Position and Performance
Allegro’s sales grew well in Q3 2024, reaching PLN 14.7 billion in GMV - up 10.8% from last year. This was much higher than Poland’s overall retail growth of 2.1%, showing Allegro is winning more market share.
The company earns money through seller fees (12.51% of sales) and ads, which grew 30% from last year. This mix of income sources keeps the business profitable.
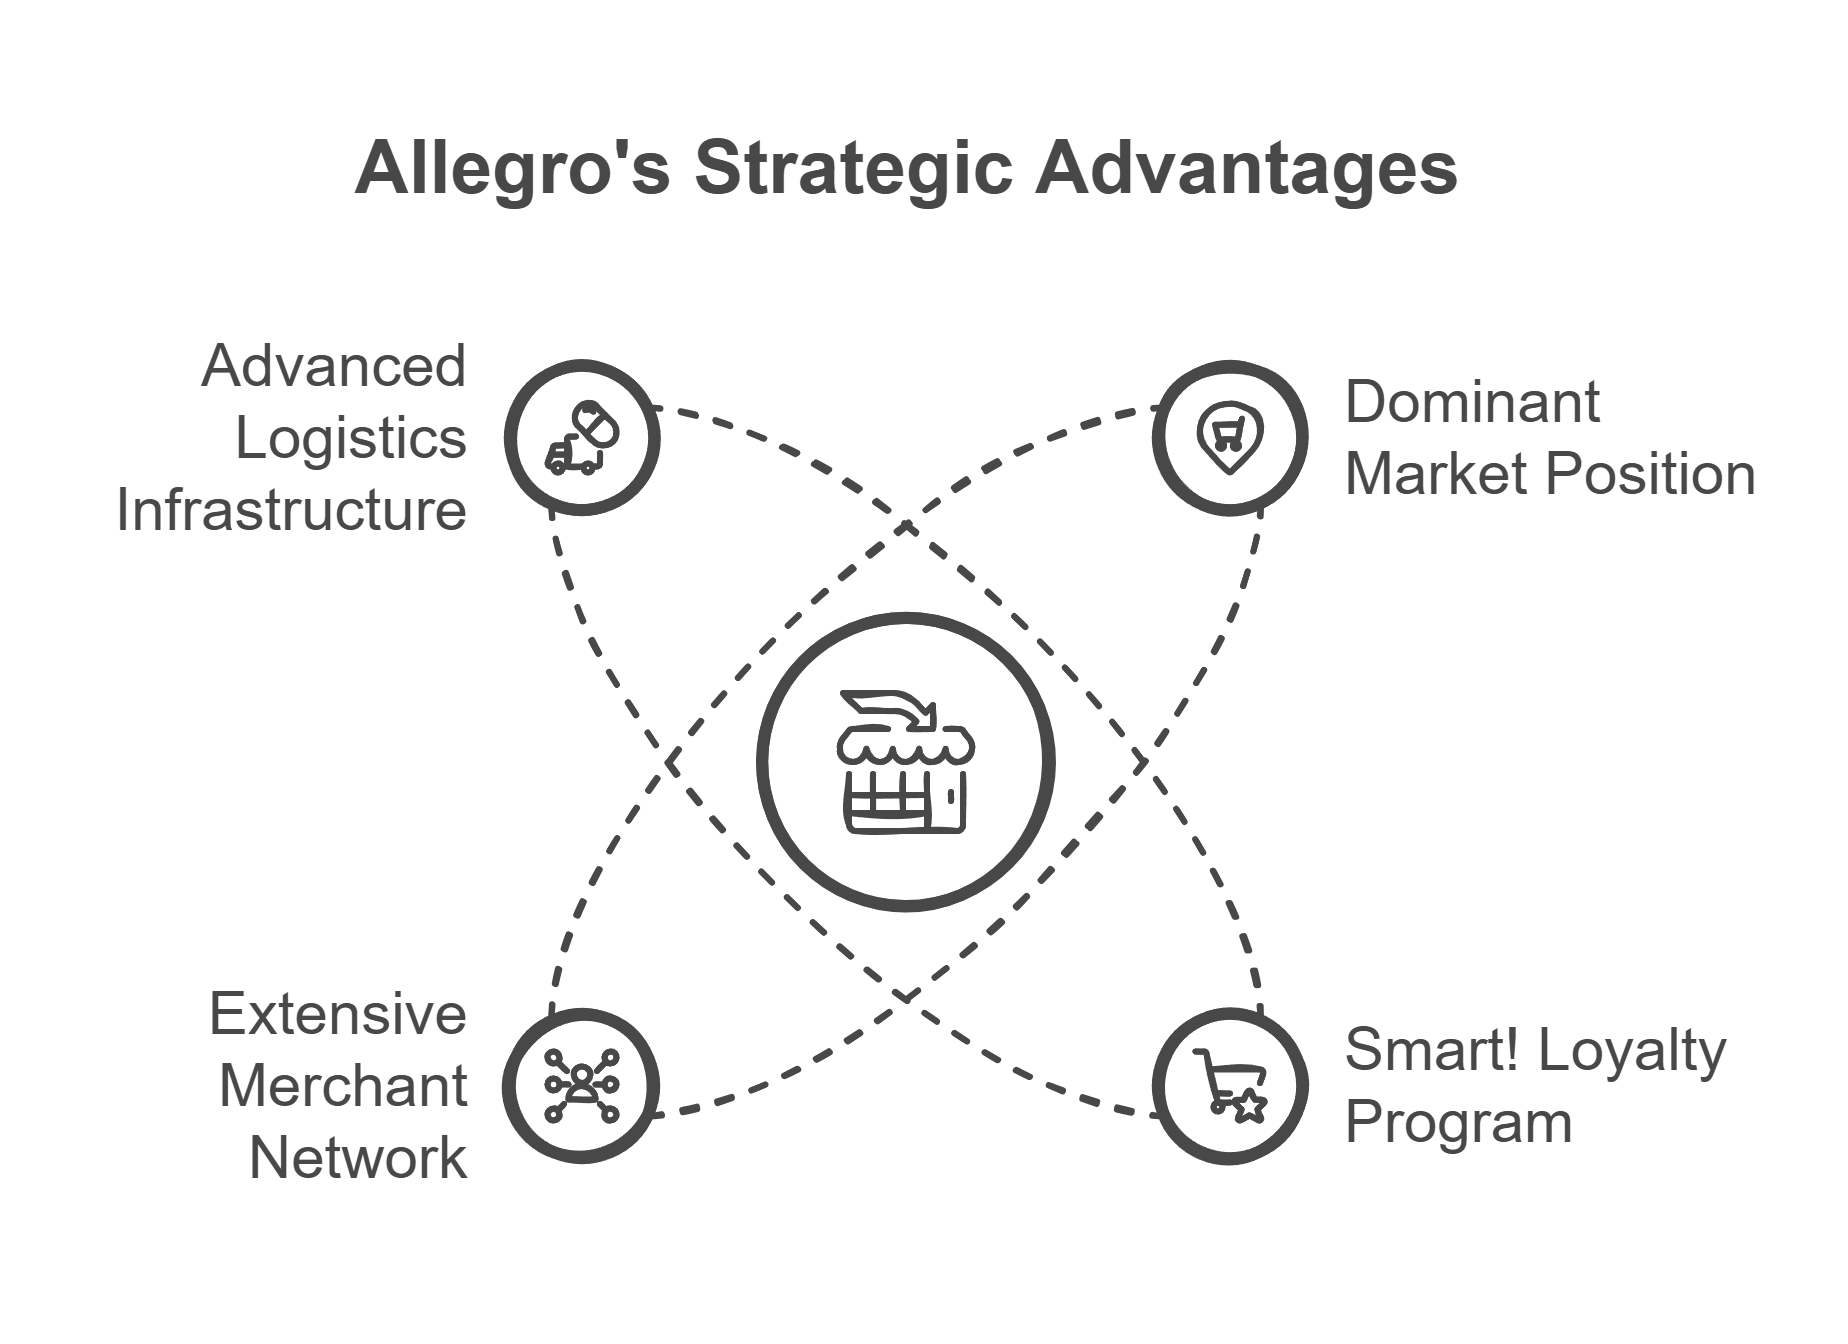
Key Strengths and Market Advantages
- Dominant Market Position: Allegro maintains 87% brand association with e-commerce in Poland
- Smart! Loyalty Program: Drives customer retention with free delivery and returns
- Extensive Merchant Network: Over 60,000 active merchants across markets
- Advanced Logistics Infrastructure: Over 10,000 lockers in the Allegro Delivery network
International Expansion
Allegro has embarked on an ambitious international expansion strategy, successfully launching operations in:
- Czechia (allegro.cz)
- Slovakia (allegro.sk)
- Hungary (allegro.hu)
This expansion has already attracted over 2.8 million active buyers internationally, with 2 million being new to the Allegro ecosystem.
Allegro Cost Structure
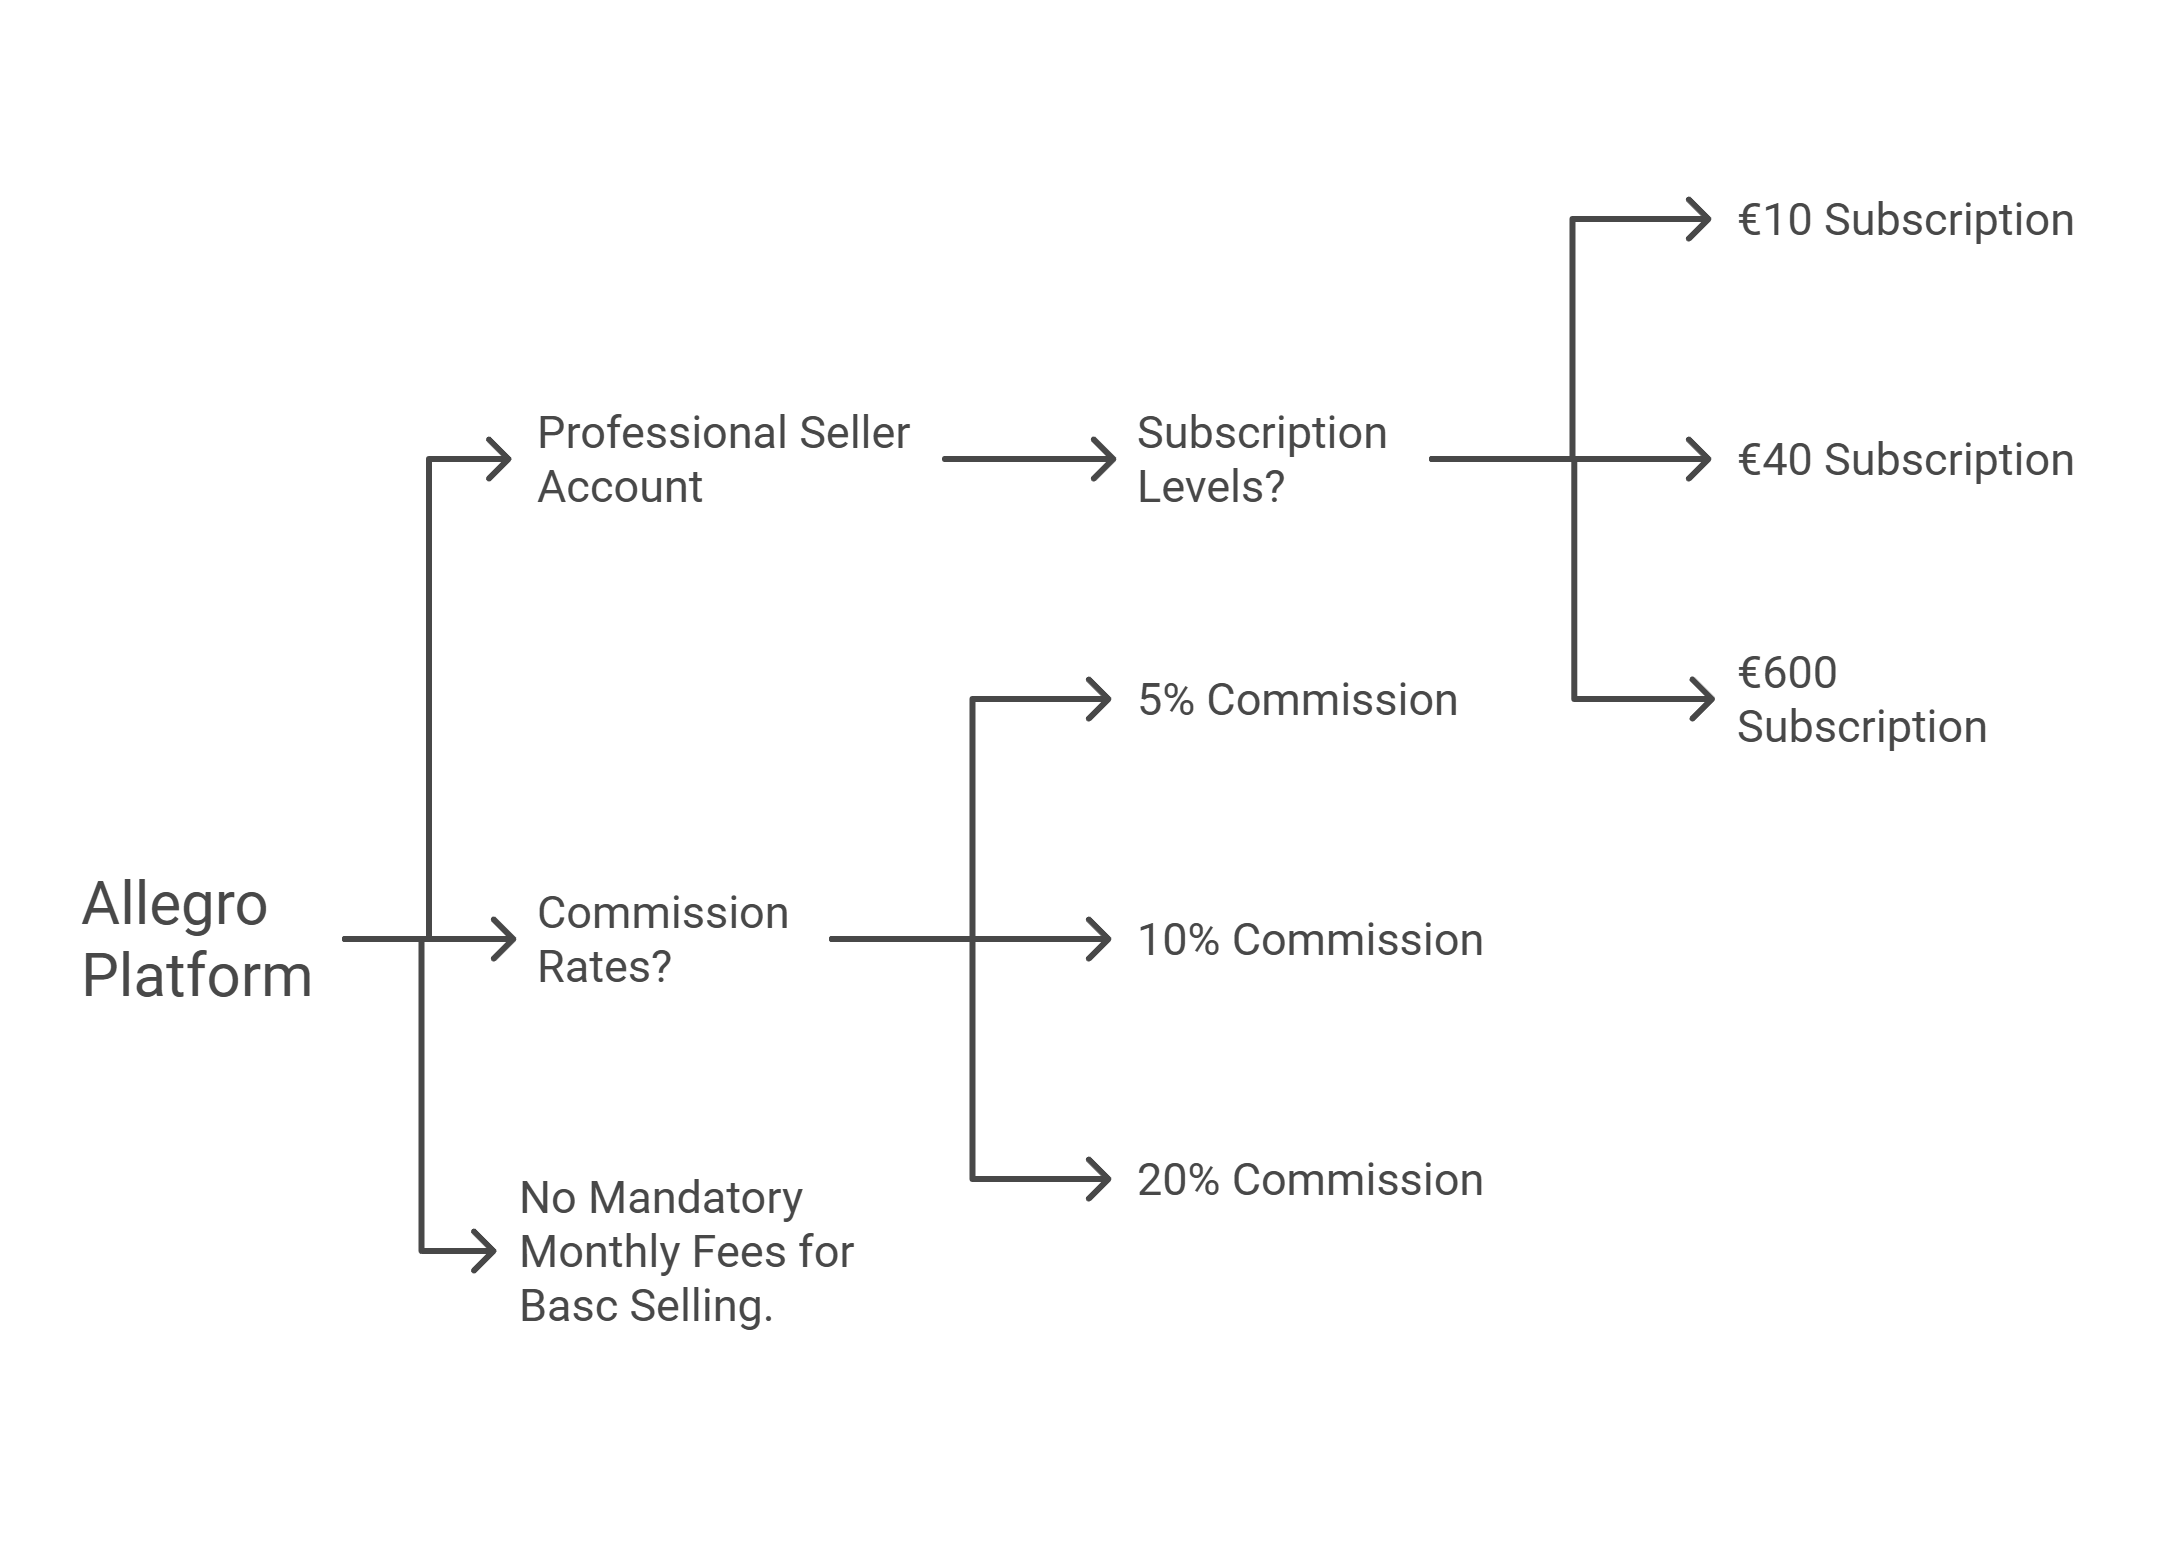
The platform maintains a straightforward fee structure:
- Professional seller account: Optional subscriptions at €10, €40, and €600 levels
- Commission rates: 5-20% depending on product categories
No mandatory monthly fees for basic selling.
Who Succeeds on Allegro
Allegro presents compelling opportunities for various types of sellers. The platform works particularly well for:
- New Entrepreneurs: It’s easy to start selling on Allegro - there are no monthly fees, and most successful sellers start with less than €5,000.
- Established Brands: Allegro protects 1,000 brand names and reaches many customers, making it good for big companies wanting to sell online.
- Cross-Border Sellers: Sellers can reach customers in 24 EU countries, with special websites for Poland, Czech Republic, and Slovakia.
Wayfair

Wayfair has established itself as one of the world’s largest online-only home goods retailers, achieving remarkable growth without operating any physical stores. The company’s revenue surged from $600 million in 2012 to over $12 billion in just over a decade.
Wayfair Market Position
Wayfair holds 1.5% of U.S. e-commerce market share, ranking fourth among furniture and homeware online retailers behind Amazon, Walmart, and Home Depot.
As of Q3 2024, the company maintains 21.7 million active customers and generates $11.8 billion in annual net revenue.
Current key performance metrics include:
- Average order value: $310 (Q3 2024)
- Orders delivered: 9.3 million quarterly
- Mobile orders: 63% of total orders
- Repeat customer rate: 79.9% of total orders
Revenue and Market Coverage
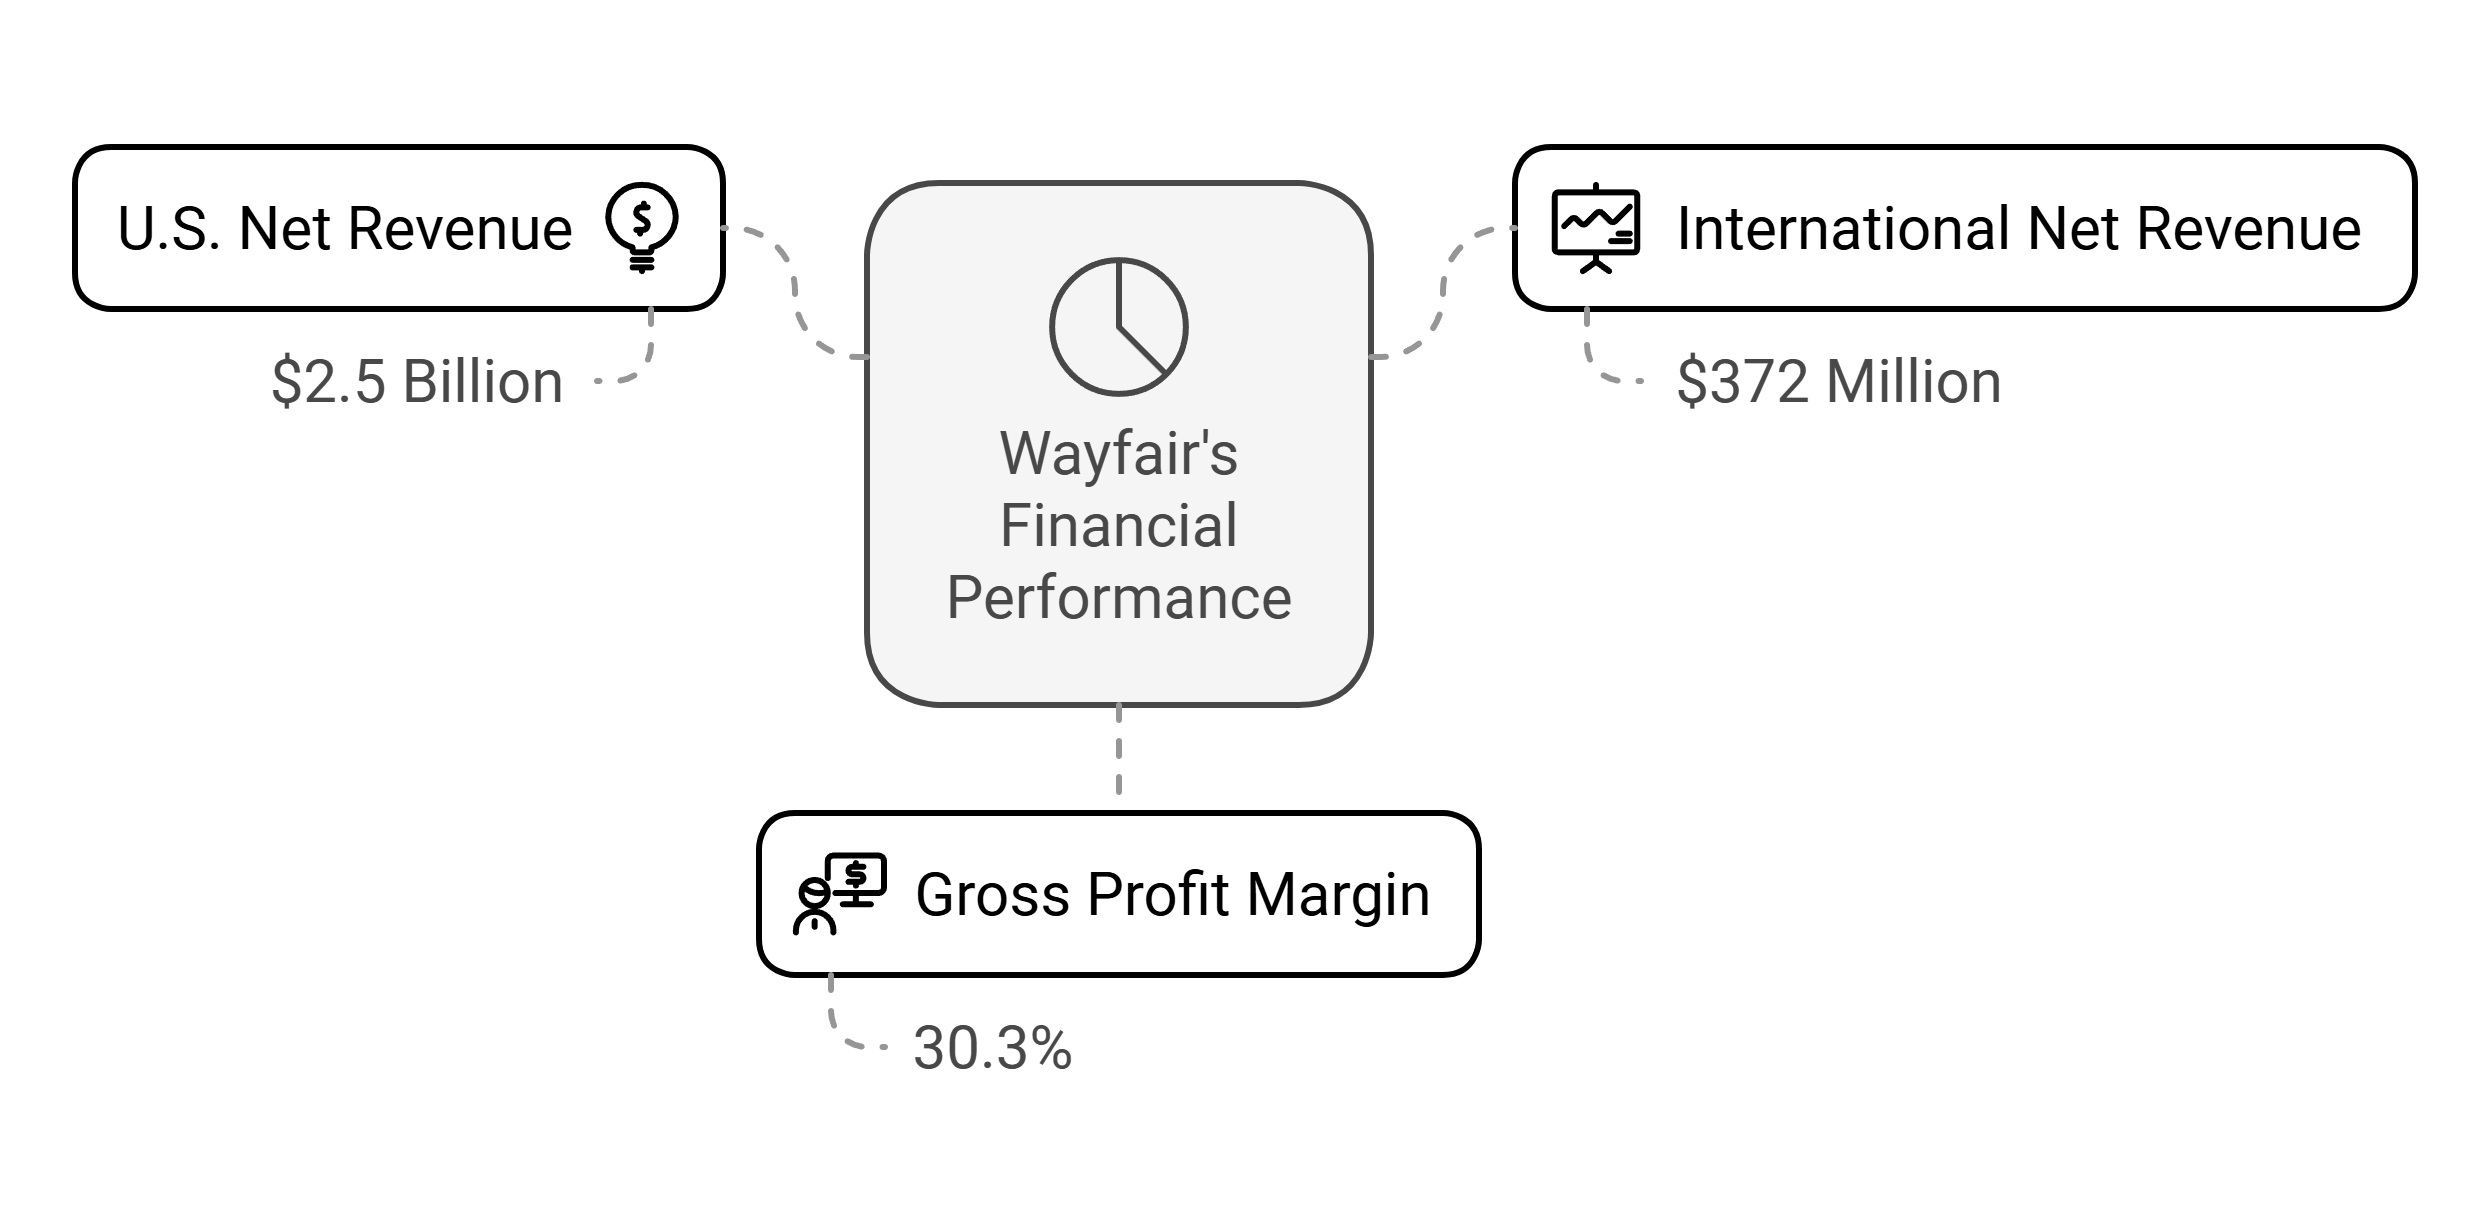
The company’s operations span multiple markets with distinct revenue streams:
- U.S. net revenue: $2.5 billion (Q3 2024)
- International net revenue: $372 million (Q3 2024)
- Gross profit margin: 30.3%
International Market Presence

Wayfair has expanded beyond the U.S., with significant operations in several markets:
- United Kingdom: Among top furniture online retailers by brand awareness
- Germany: Generated approximately $200 million in e-commerce sales
- Canada: Ranks among leading e-commerce brands
- Global ranking: 7th among top furniture and homeware online stores worldwide
Wayfair Cost Structure
Sellers should consider these operational aspects:
- No upfront fees to list products
- Commission-based revenue sharing
- Logistics and fulfillment costs
- Marketing and promotion expenses
The platform’s high repeat customer rate of 79.9% and average order value of $310 suggest strong potential for sustainable seller profitability when these costs are managed effectively.
Who Should Sell on Wayfair
Wayfair presents particular value for:
- Home Goods Manufacturers: Wayfair specializes in home furnishings and decor, connecting manufacturers with buyers who want these products.
- Established Brands: Many customers shop repeatedly on Wayfair, helping home goods brands reach more online buyers.
- International Sellers: Sellers can reach customers in multiple countries, especially in the U.S., UK, and Germany.
Global E-commerce Market Overview by Country
After examining the top e-commerce marketplaces worldwide, let’s analyze the five largest e-commerce markets - China, the United States, Japan, South Korea, and the United Kingdom.
These countries drive global online retail growth and shape how the biggest e-commerce marketplaces operate in different regions.
China
China stands as the world’s largest e-commerce market, with projected revenue of $1,469 billion in 2024. The market demonstrates exceptional scale with online retail accounting for 37% of total retail spending, far surpassing the U.S. (22%) and Western Europe (16%).
Market Size and Growth
The Chinese e-commerce market is experiencing remarkable expansion, with a projected CAGR of 9.95% from 2024 to 2029. Current user penetration stands at 78.8% and is expected to reach 97.4% by 2029, representing over 1.36 billion users.
The average revenue per user amounts to $1,553, reflecting the market’s maturity and consumer spending power.
Major Platforms and Performance
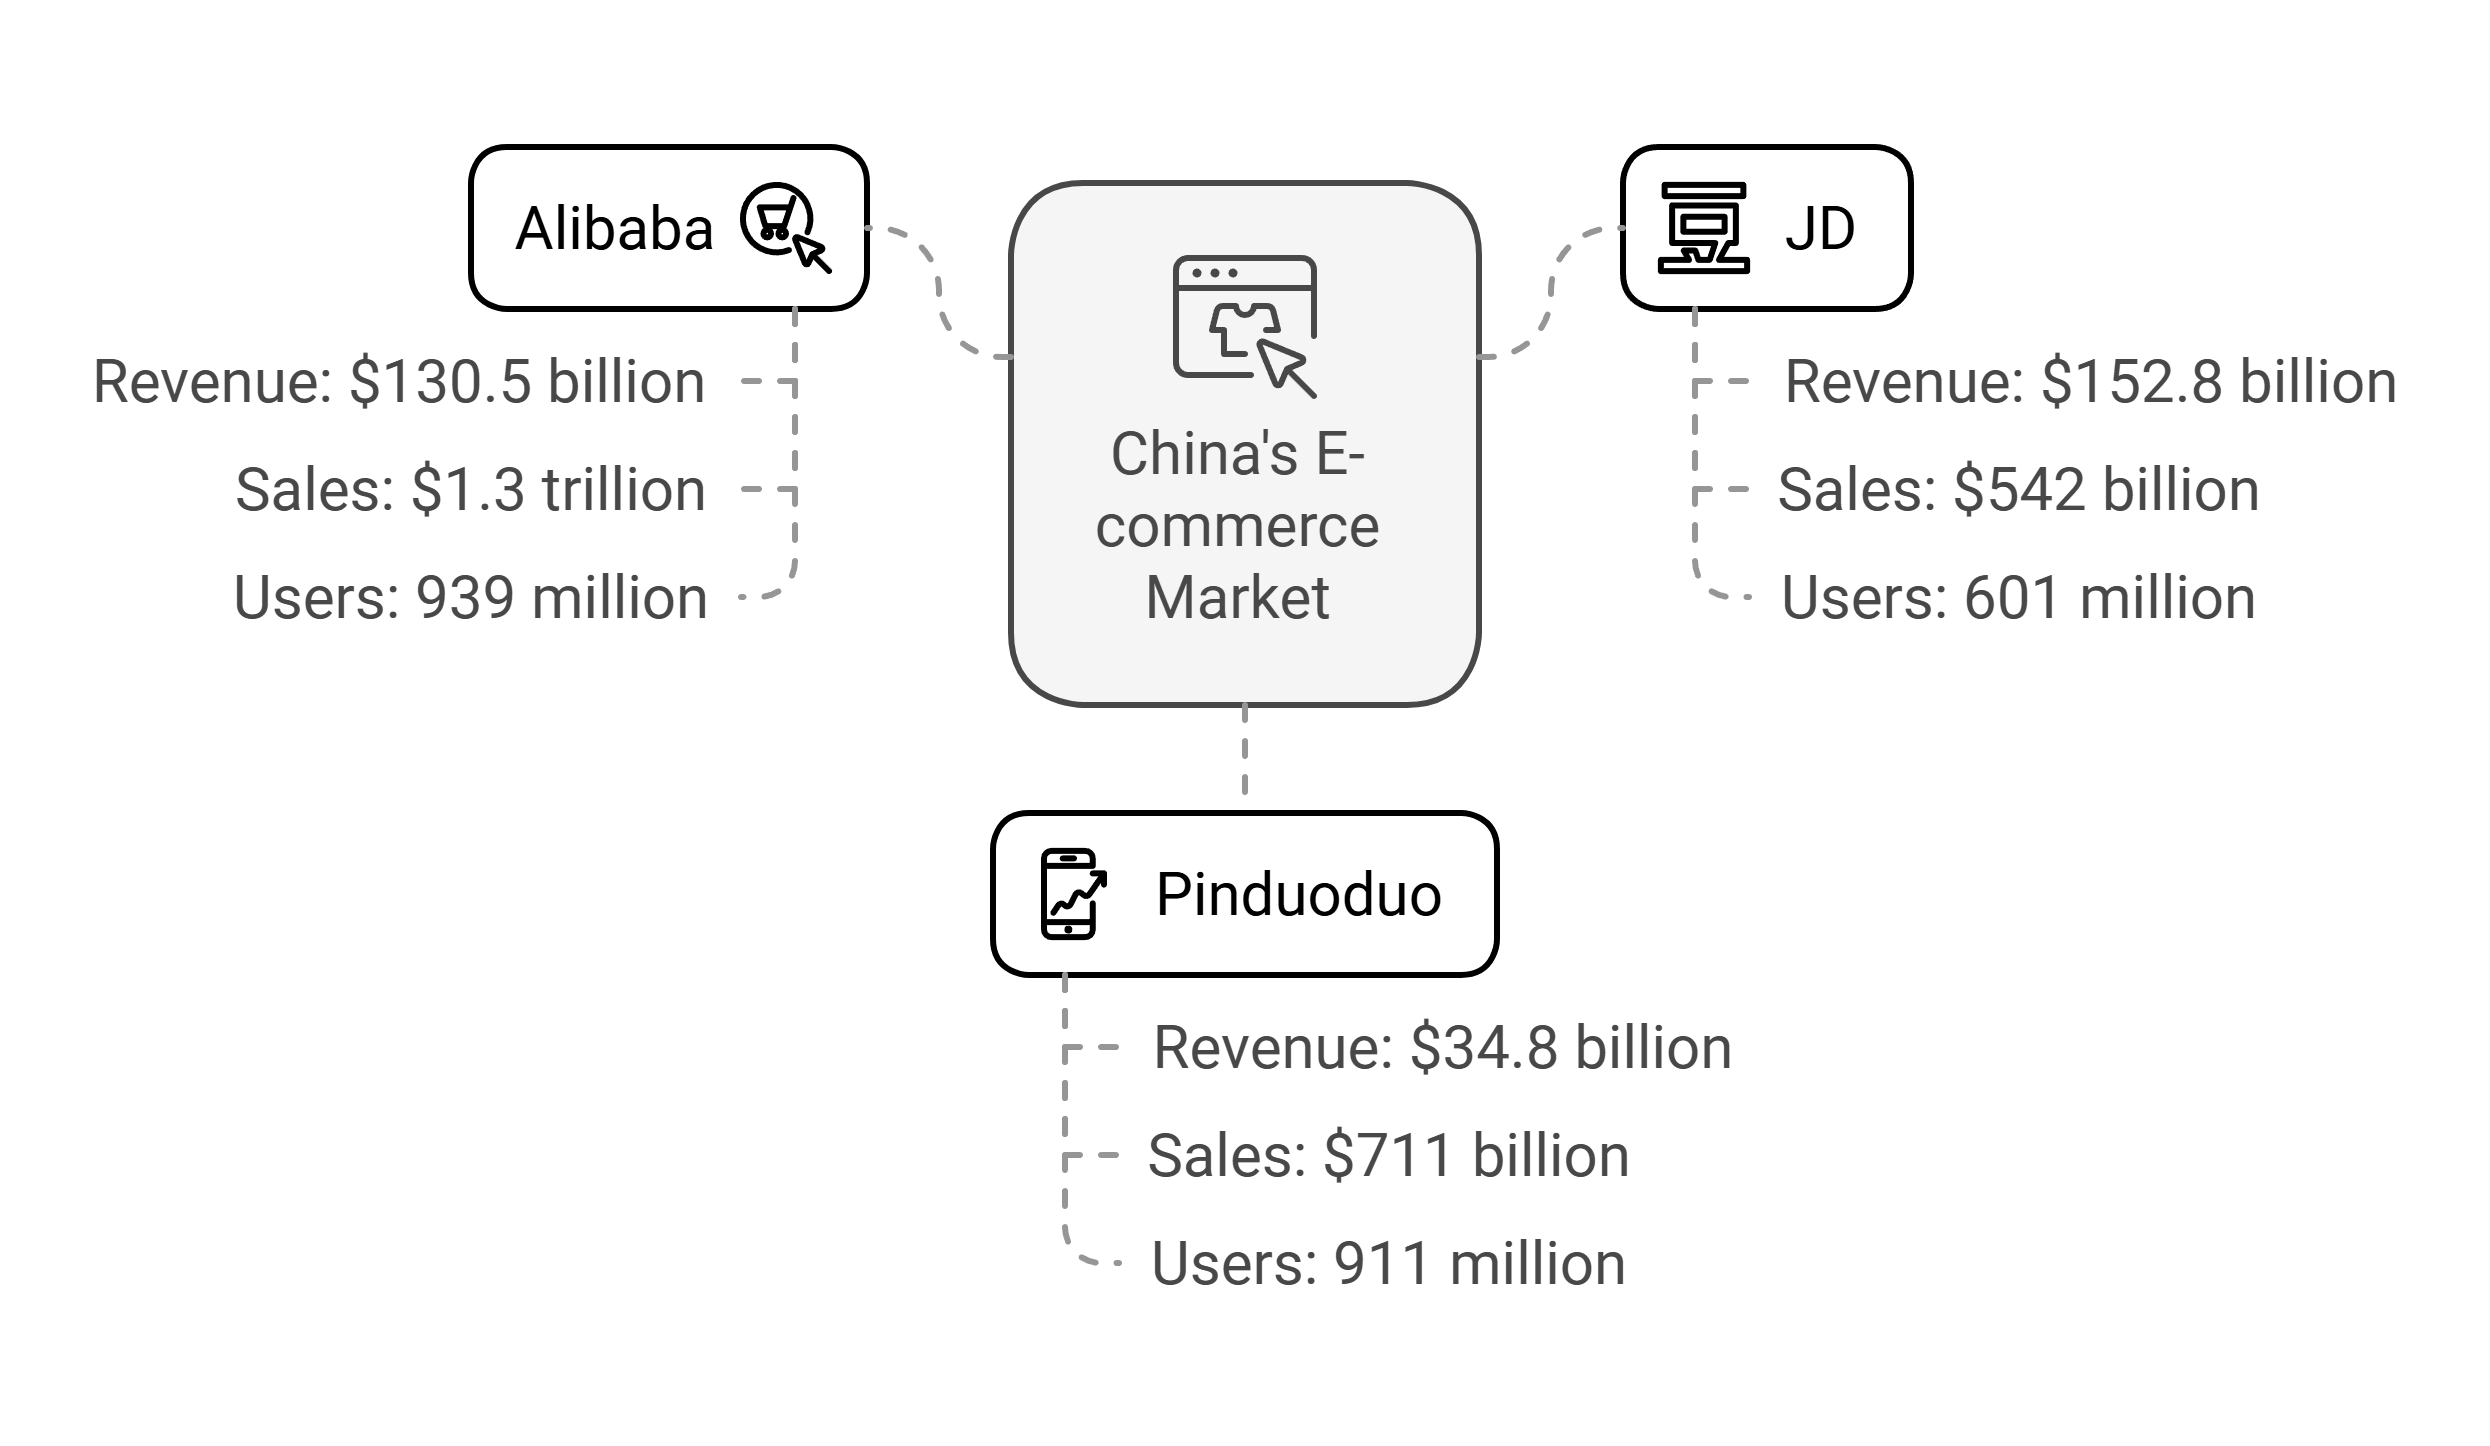
Three dominant players shape China’s e-commerce:
1) Alibaba
The world’s biggest e-commerce company sold $1.3 trillion worth of goods in 2023. It makes $130.5 billion yearly and has 939 million users on its Taobao and Tmall sites.
2) JD
JD earned the most money among Chinese platforms ($152.8 billion) in 2023. It has 601 million users and sold $542 billion worth of goods.
3) Pinduoduo
A fast-growing competitor with 911 million users. It made $34.8 billion in revenue and sold $711 billion worth of goods in 2023, growing mainly through its international store, Temu.
Cross-Border Commerce
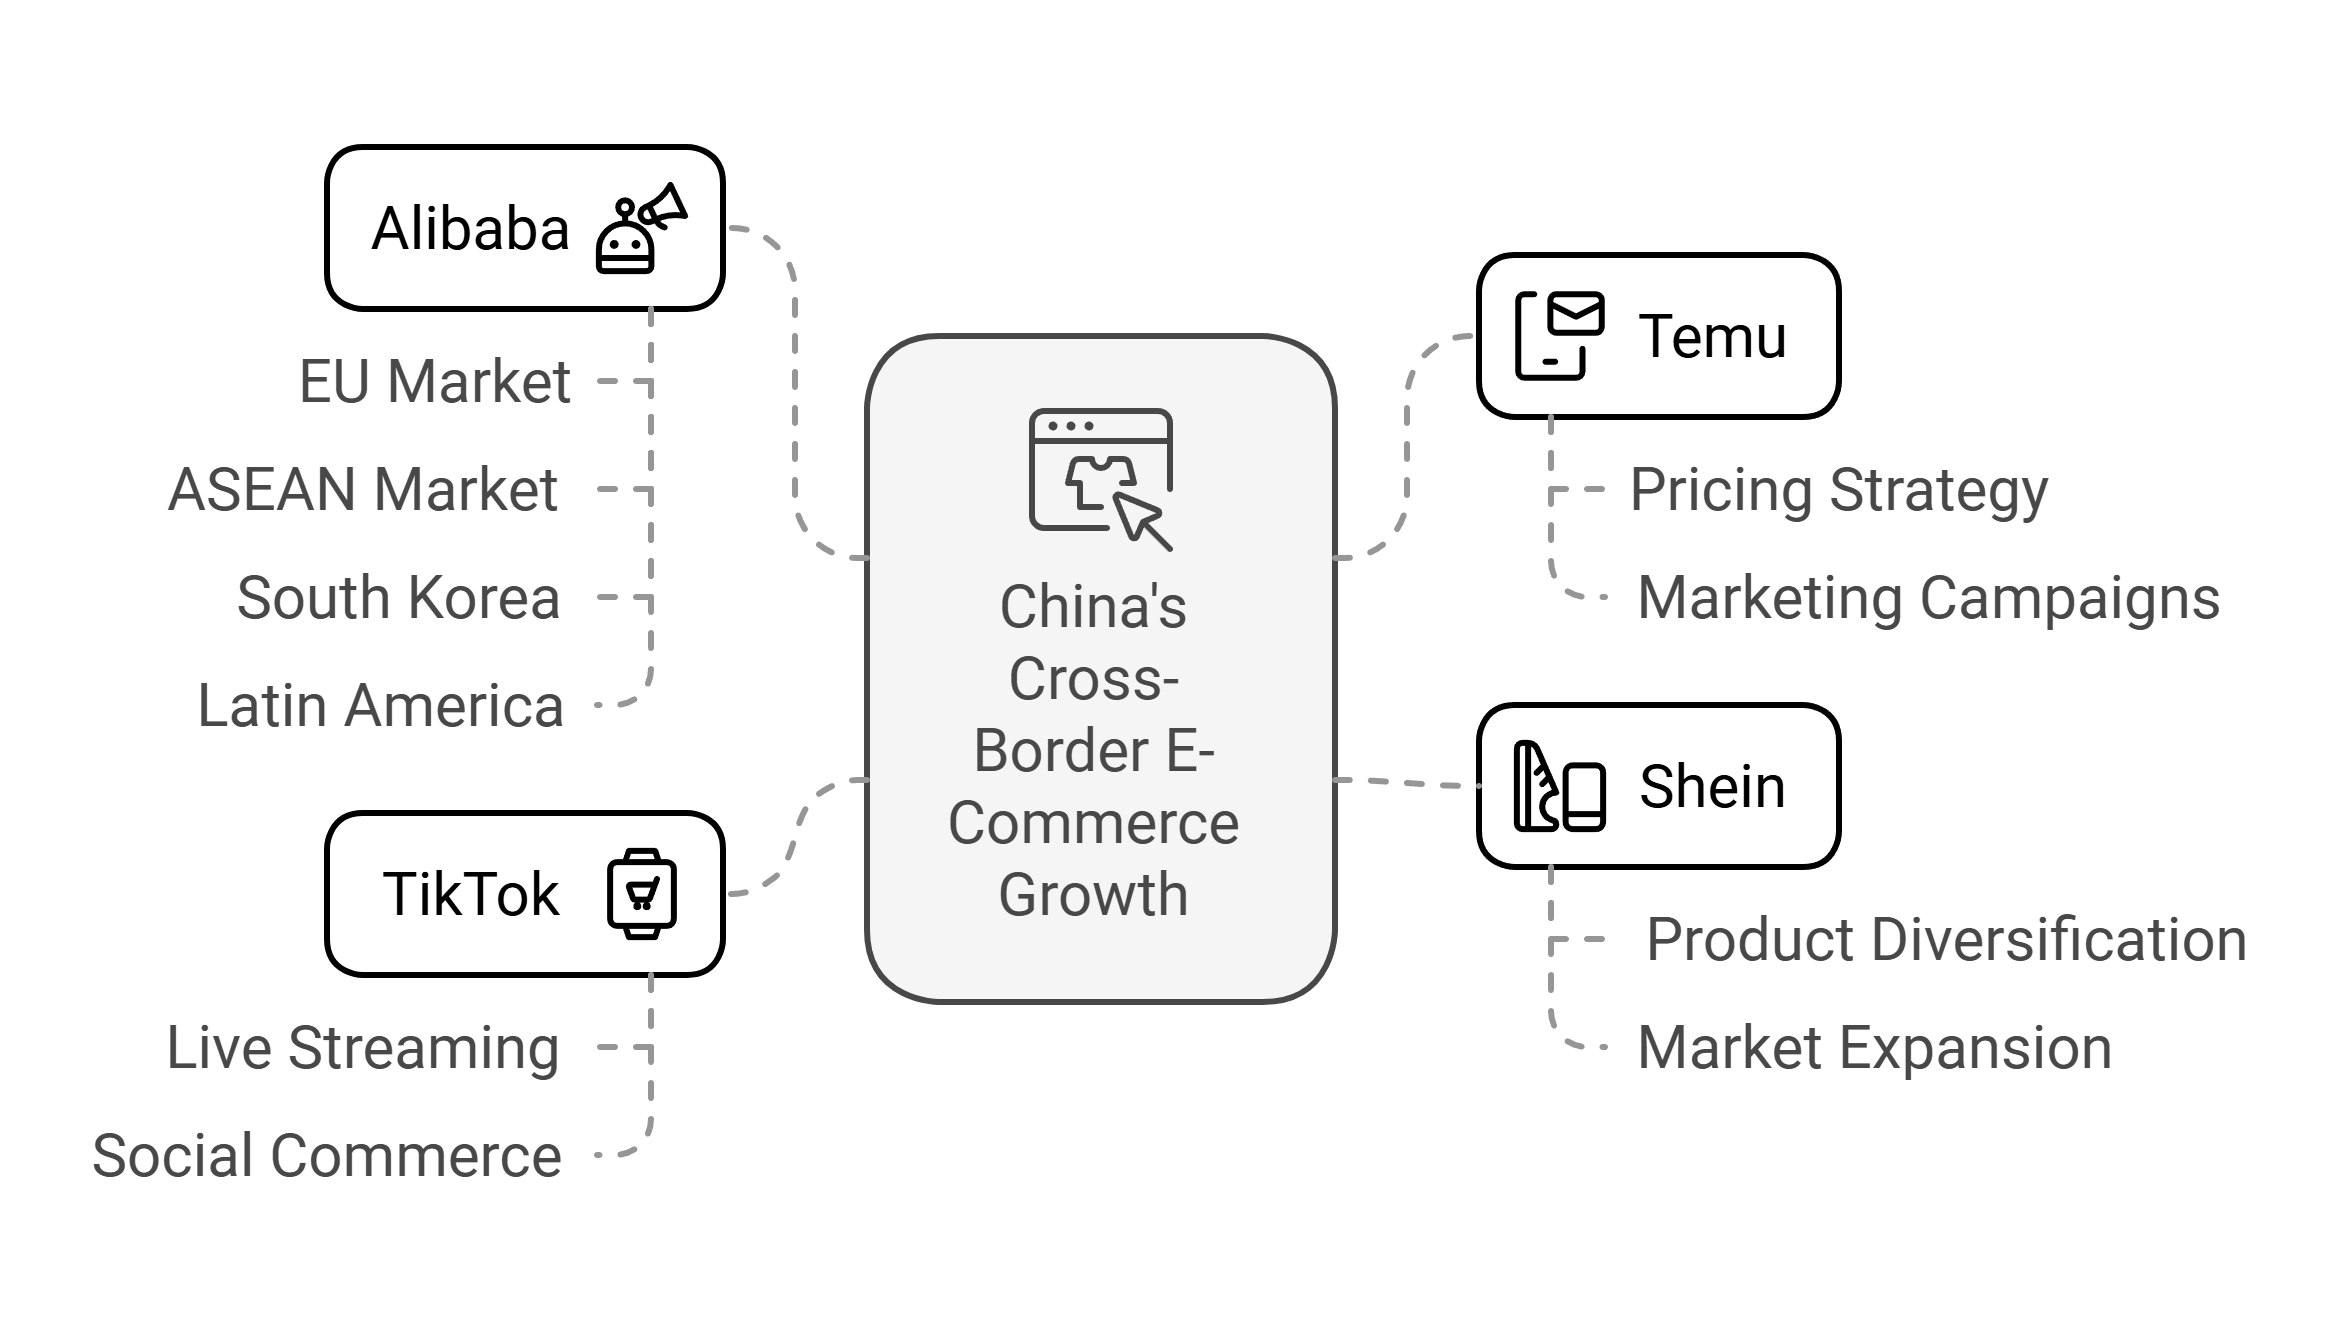
China’s cross-border e-commerce has shown explosive growth, evolving from a $155 billion market in 2019 to $350 billion in 2023. Projections indicate it will reach $500 billion by 2025, driven by four key players:
- Temu: Leading the charge with ultra-low pricing and aggressive international marketing
- Alibaba: Leveraging established presence in EU, ASEAN, South Korea, and Latin America
- Shein: Expanding beyond fast fashion into broader retail categories
- TikTok: Pioneering social commerce through live streaming capabilities
Market Innovation and Growth Drivers
In early 2024, online sales hit 7.1 trillion yuan ($996 billion), up 9.8% from last year. AI products grew 136.6%, and smart wearables grew 31.5%.
Companies spent 48 billion yuan on new technology, focusing on AI, virtual shopping, and self-driving delivery.
US
The United States e-commerce market continues its expansion, projected to generate $1.2 trillion in revenue for 2024, with expectations to reach $1.8 trillion by 2029.
This growth comes with increasing competition between established domestic players and emerging international challengers.
In early 2024, online sales hit $289.2 billion, up 8.6% from last year. Online shopping now makes up 15.9% of all retail sales.
US Market Leaders and Competition
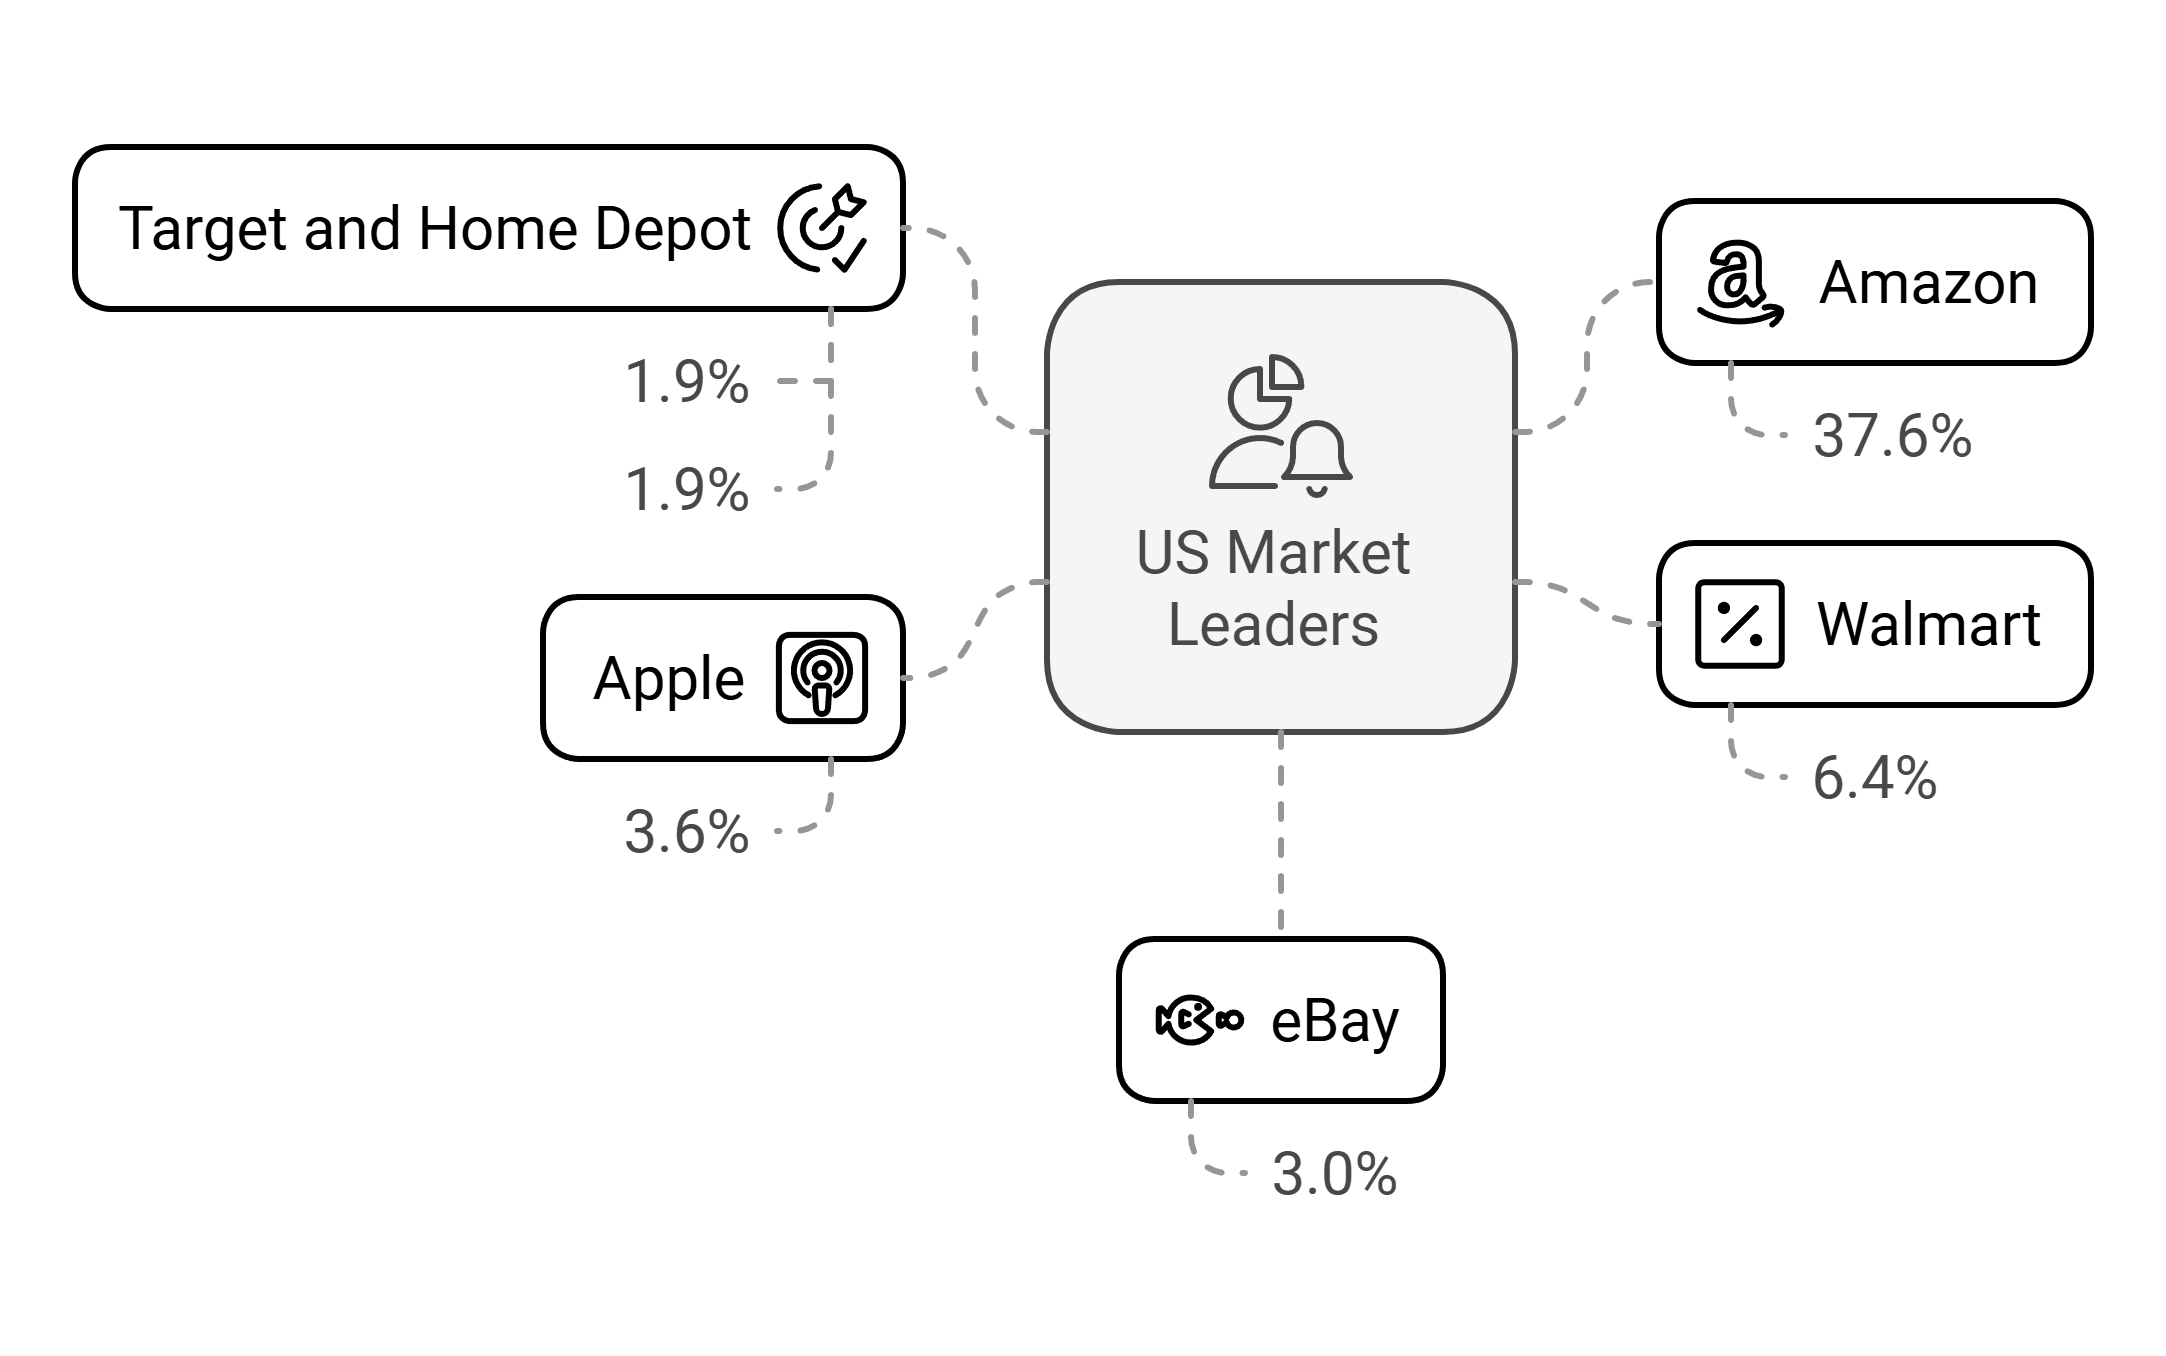
Amazon maintains its dominant position in the US market:
- Amazon: 37.6%
- Walmart: 6.4%
- Apple: 3.6%
- eBay: 3.0%
- Target and Home Depot: 1.9% each
Amazon’s supremacy is particularly evident in sales volume, generating approximately $135 billion in retail e-commerce sales in 2023, while Walmart, its closest competitor, achieved around $65 million.
The Rise of International Competition
Chinese companies are gaining ground. Temu became 2023’s most downloaded shopping app with 123 million downloads - five times more than Amazon. Shein followed with 37 million downloads, selling cheap fashion items.
Consumer Behavior and Trends
The average revenue per user stands at $4,470, demonstrating substantial consumer spending power. Mobile commerce dominates, with 73% of transactions occurring on smartphones.
Payment preferences show consistent patterns, with VISA accepted by 96.1% of e-commerce platforms, making it the most widely available payment option.
Market Challenges
Cart abandonment remains a significant concern for retailers:
Key abandonment factors:
- 47% leave due to high additional costs
- 25% abandon when required to create an account
- 16% cite unsatisfactory return policies
- 19% express credit card security concerns
Japan
Japan is the world’s third-biggest online shopping market after China and the US, expecting $169.40 billion in sales in 2024.
The market should grow 9.23% yearly until 2029, reaching $263.40 billion. The percentage of Japanese people shopping online will grow from 72.3% to 87.3% (93.9 million users) by 2029.
Japan Ecommerce Market Leaders and Competition
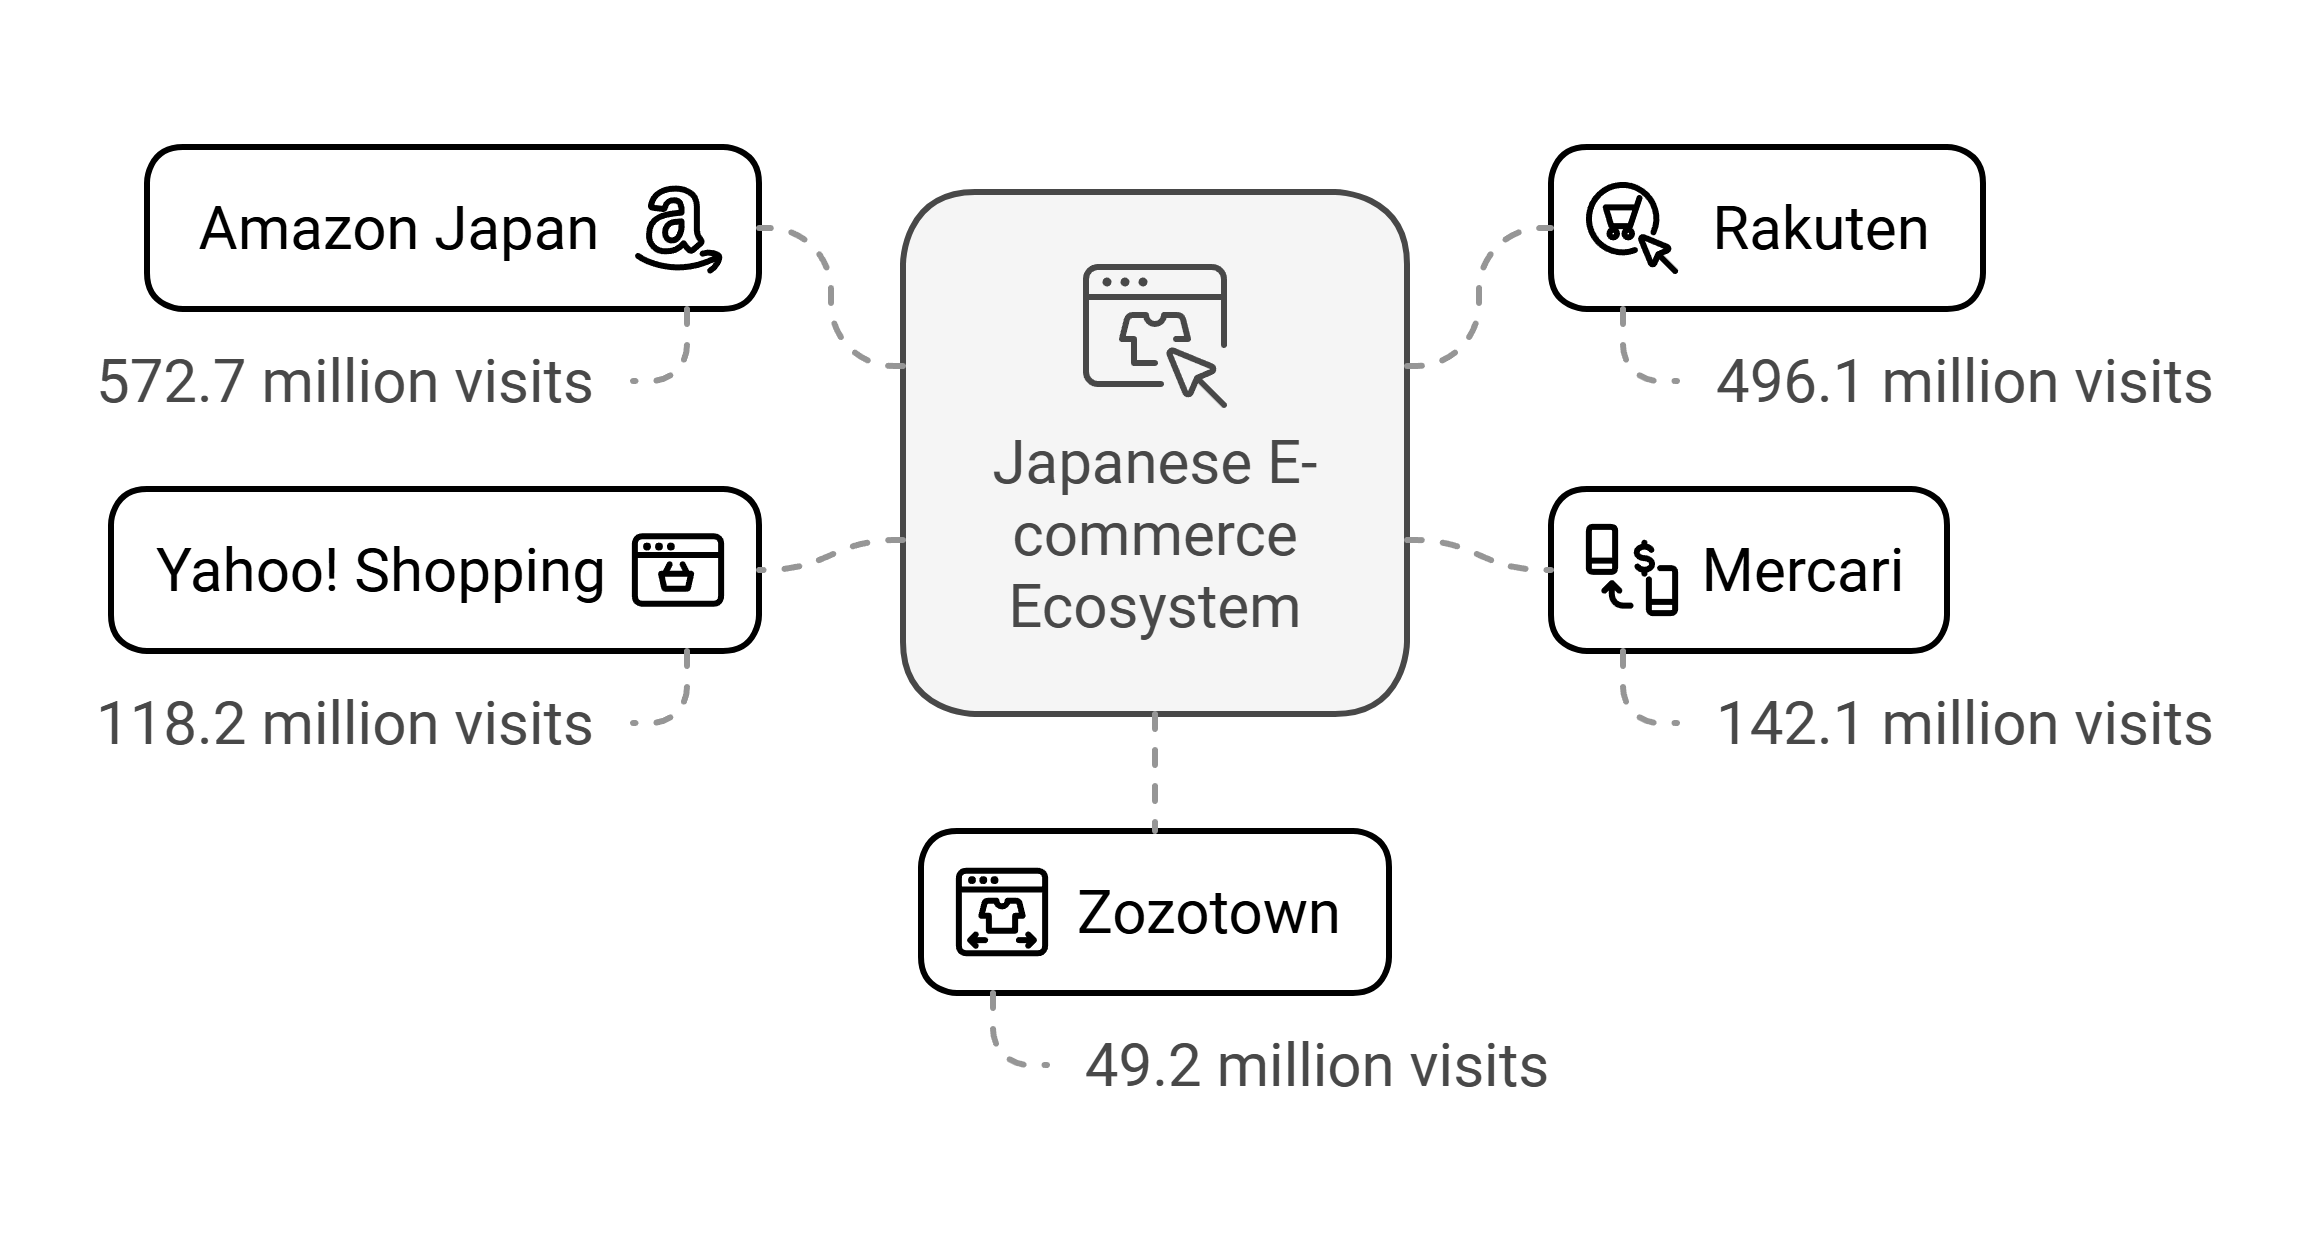
The Japanese ecommerce ecosystem is led by five major platforms, based on monthly visitors:
- Amazon Japan: 572.7 million visits
- Rakuten: 496.1 million visits
- Mercari: 142.1 million visits
- Yahoo! Shopping: 118.2 million visits
- Zozotown: 49.2 million visits
Consumer Shopping Preferences
Japanese consumers strongly favor established ecommerce platforms, with Amazon and Rakuten together commanding 94.2% of online shopping activity. Manufacturer brand websites have become increasingly important, attracting 40.9% of online consumers.
The market shows diverse shopping preferences across channels:
- Home electronic stores maintain strong online presence (33.1%)
- Online auction sites serve specific consumer needs (27.3%)
- Flea market platforms attract value-conscious shoppers (24.9%)
Popular Product Categories
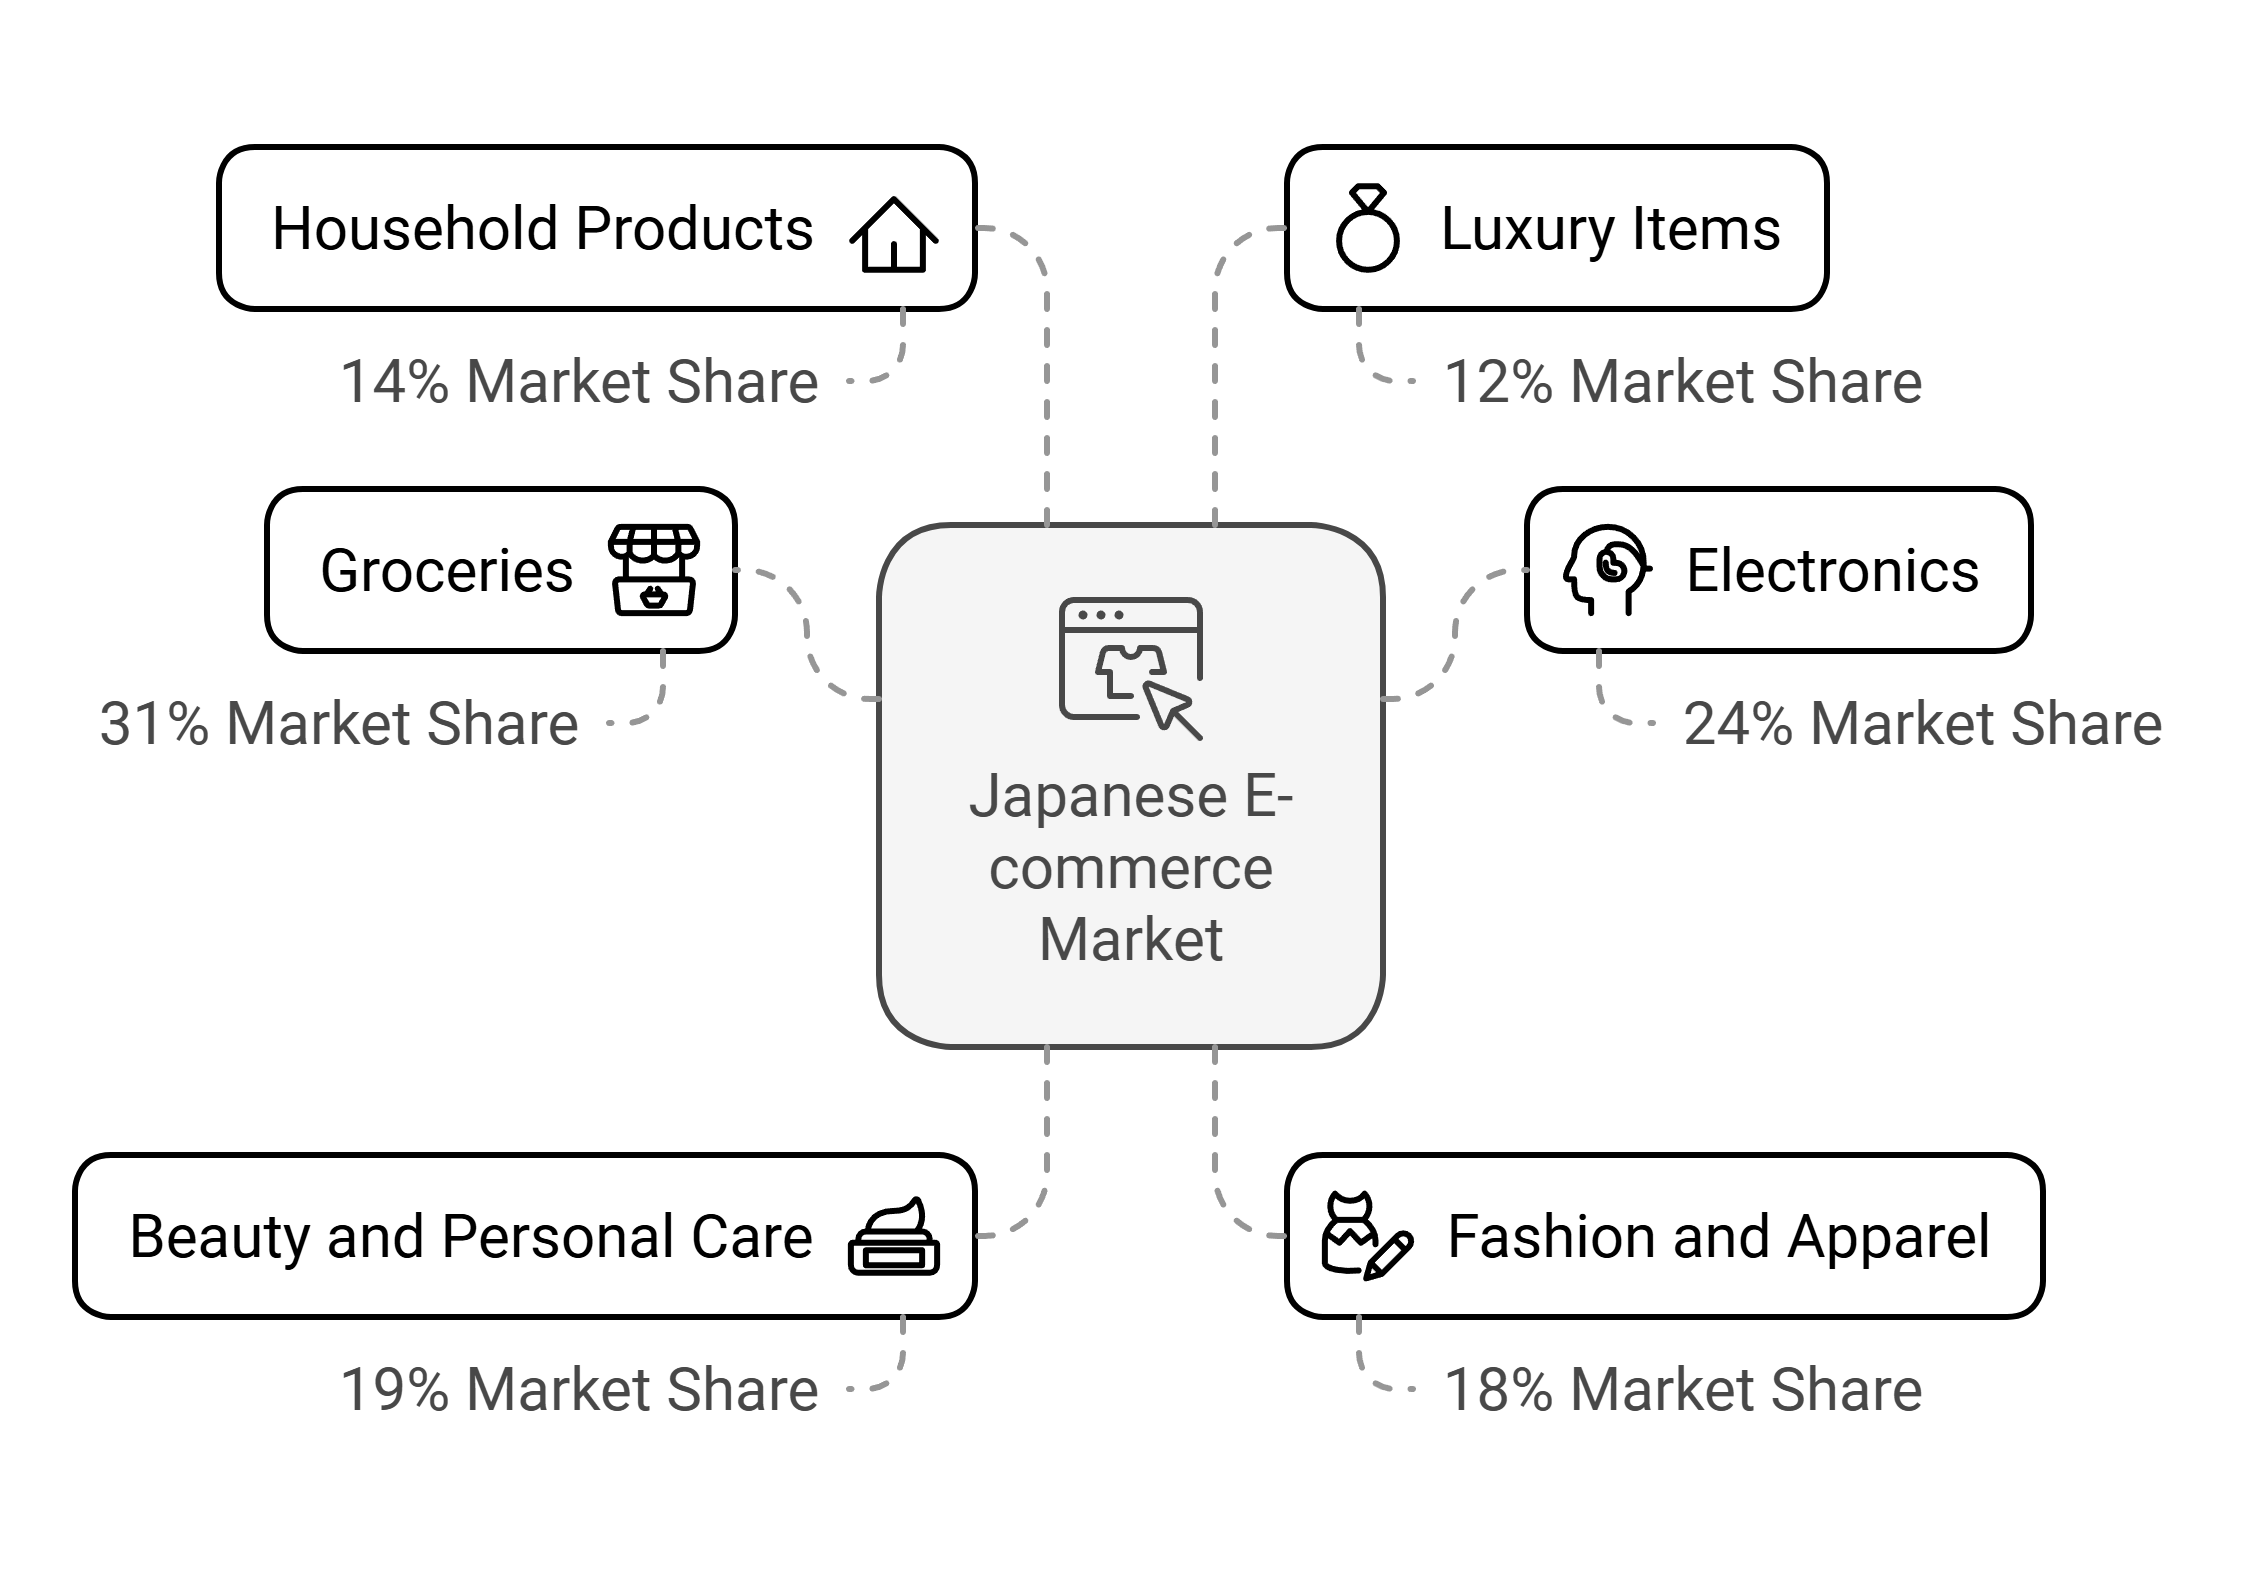
Groceries lead the Japanese ecommerce market, capturing 31% of online shopping activity. Electronics follow as a strong second with 24% of transactions.
Beauty and personal care products hold 19% of the market, demonstrating Japanese consumers’ focus on personal care.
Other significant categories include:
- Fashion and apparel (18%)
- Household products (14%)
- Luxury items (12%)
South Korea
South Korea’s online shopping will reach $170.1 billion by 2028. Fast internet, safe payments, and high trust in online shopping make it popular with both local and foreign sellers.
Market Scale and Growth
As the fourth-largest e-commerce market in Asia-Pacific, South Korea continues to expand rapidly. The market grew at 12.6% CAGR from 2020 to 2023, reaching $114.2 billion.
Expected growth of 7.8% CAGR from 2024 to 2028 will push the market to $170.1 billion.\n\n
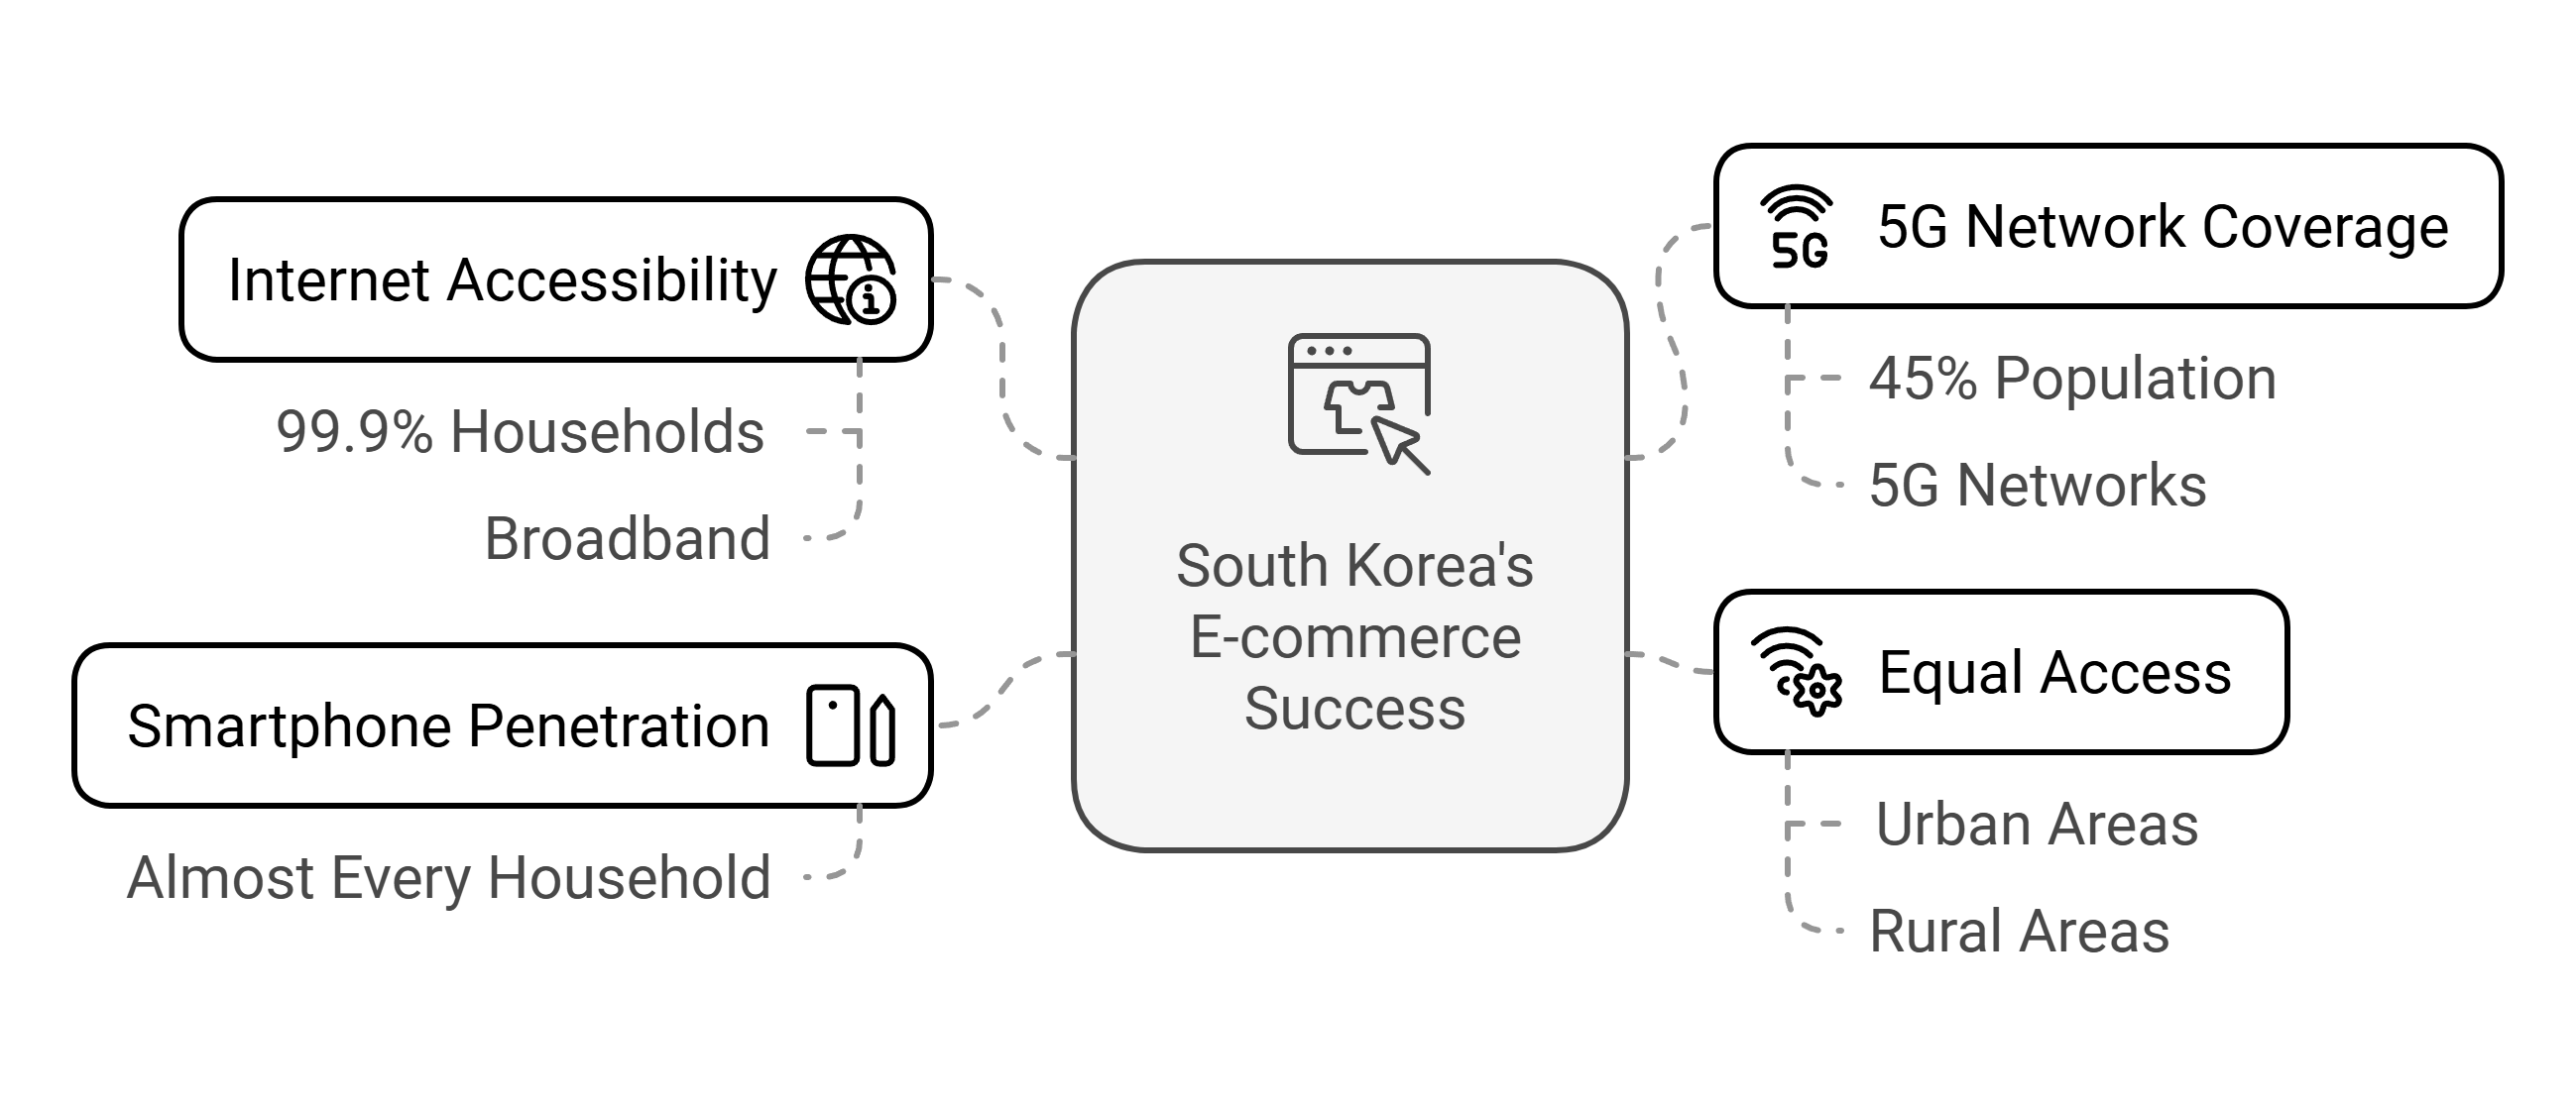
South Korea’s e-commerce success builds on strong technical foundations:
- 99.9% of households have broadband internet
- Almost every household owns a smartphone
- 5G networks reach 45% of the population
- Equal internet access across urban and rural areas
Ecommerce Leaders in Japan
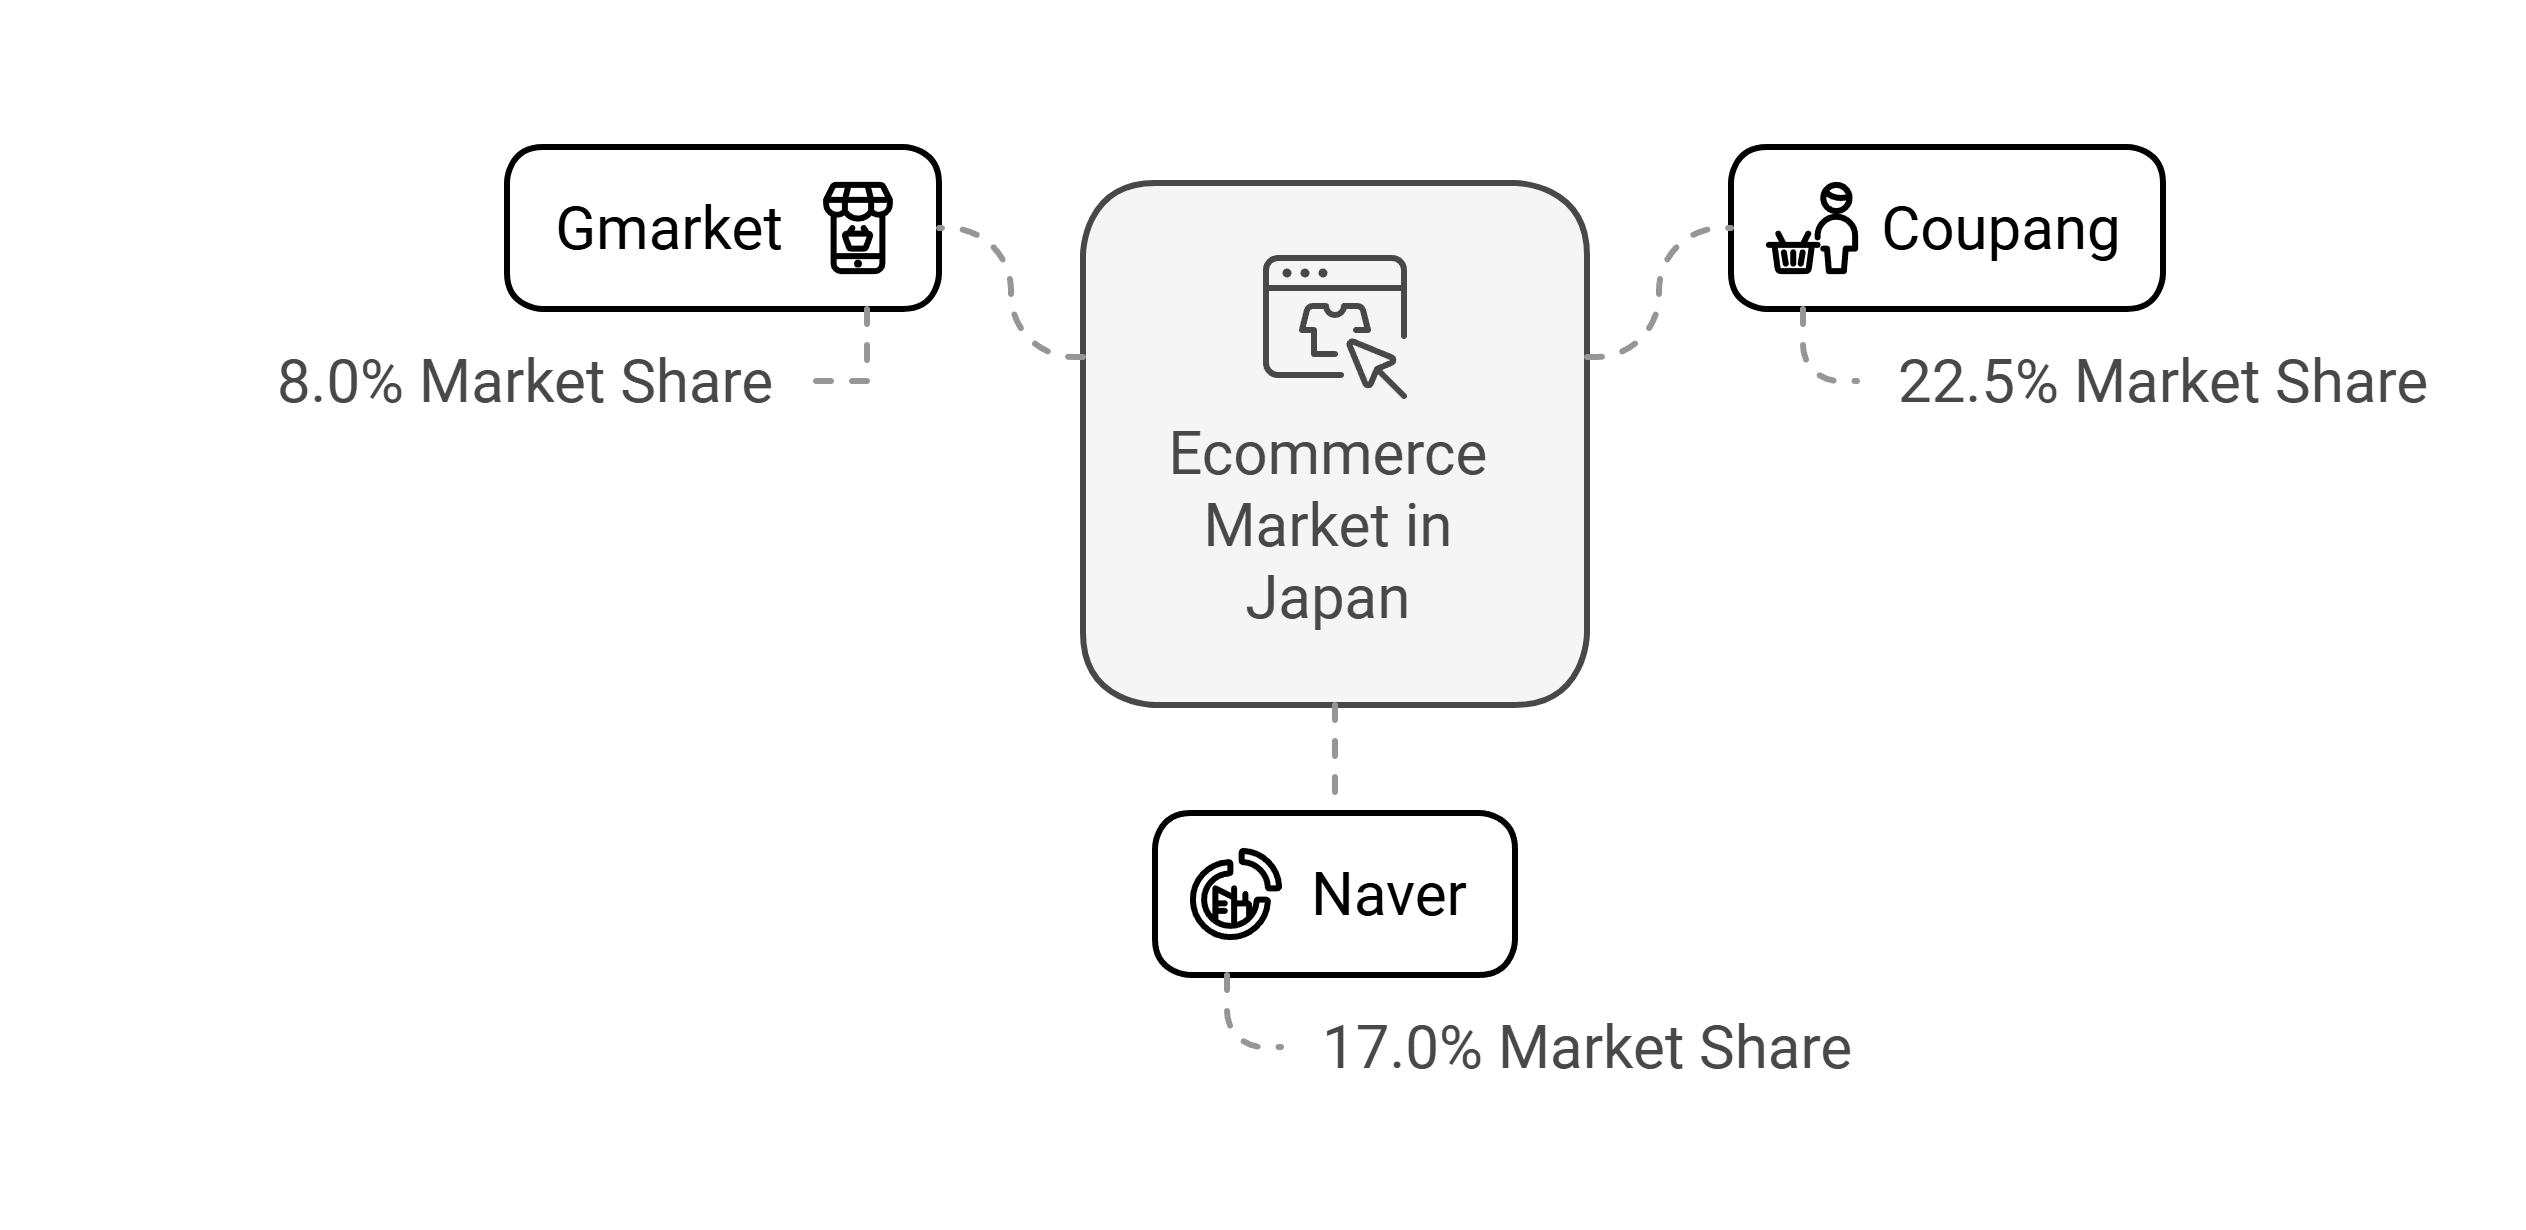
Three major domestic platforms control most of the market:
- Coupang holds the largest share at 22.5%
- Naver: 17.0% market share
- Gmarket: 8.0% market share (now part of Shinsegae)
Consumer Behavior
South Korean shoppers show clear preferences for mobile shopping, with 73% of e-commerce purchases made on phones. The total percentage of people shopping online reached 75% in 2023, indicating wide acceptance of digital purchasing.
Credit cards handle most payments (54.3%), with credit cards alone making up 48.5%. Digital wallets like Samsung Pay and Naver Pay process 32.9% of payments. Cash is rarely used, accounting for only 2% of purchases.
Market Innovation
South Korean e-commerce continues to advance with new technologies. Live commerce now makes up 2.5% of e-commerce sales through interactive streaming sessions that let customers buy products directly.
Delivery services have improved significantly, with next-day and same-day delivery available in major cities.
Key developments include:
- AI systems that personalize shopping experiences
- Automated customer service handling millions of questions
- Testing of drone and robot deliveries
Cross-Border Commerce
Foreign sales grew 50% since 2024, with US products making up 41% of foreign purchases. More global brands like Shein are entering the market.
The country has made international shopping easier with faster customs processing, more payment options, and better local versions of foreign shopping sites.
UK
The United Kingdom leads Europe in ecommerce, with strong digital adoption across all age groups. The market is set to reach £194.1 billion by 2027, showing steady growth despite economic challenges.
Most UK residents (96.7%) use the internet, and 81.5% shop online. Online sales make up 30% of all retail sales. The UK has 580,000 online stores, and shoppers spend about £4,679 online each year.
Consumer Behavior and Shopping Patterns
The 25-34 age group leads in adoption, with 91% making online purchases in the last year. Search engines remain important for product discovery, with 42% of consumers starting their shopping journey there.
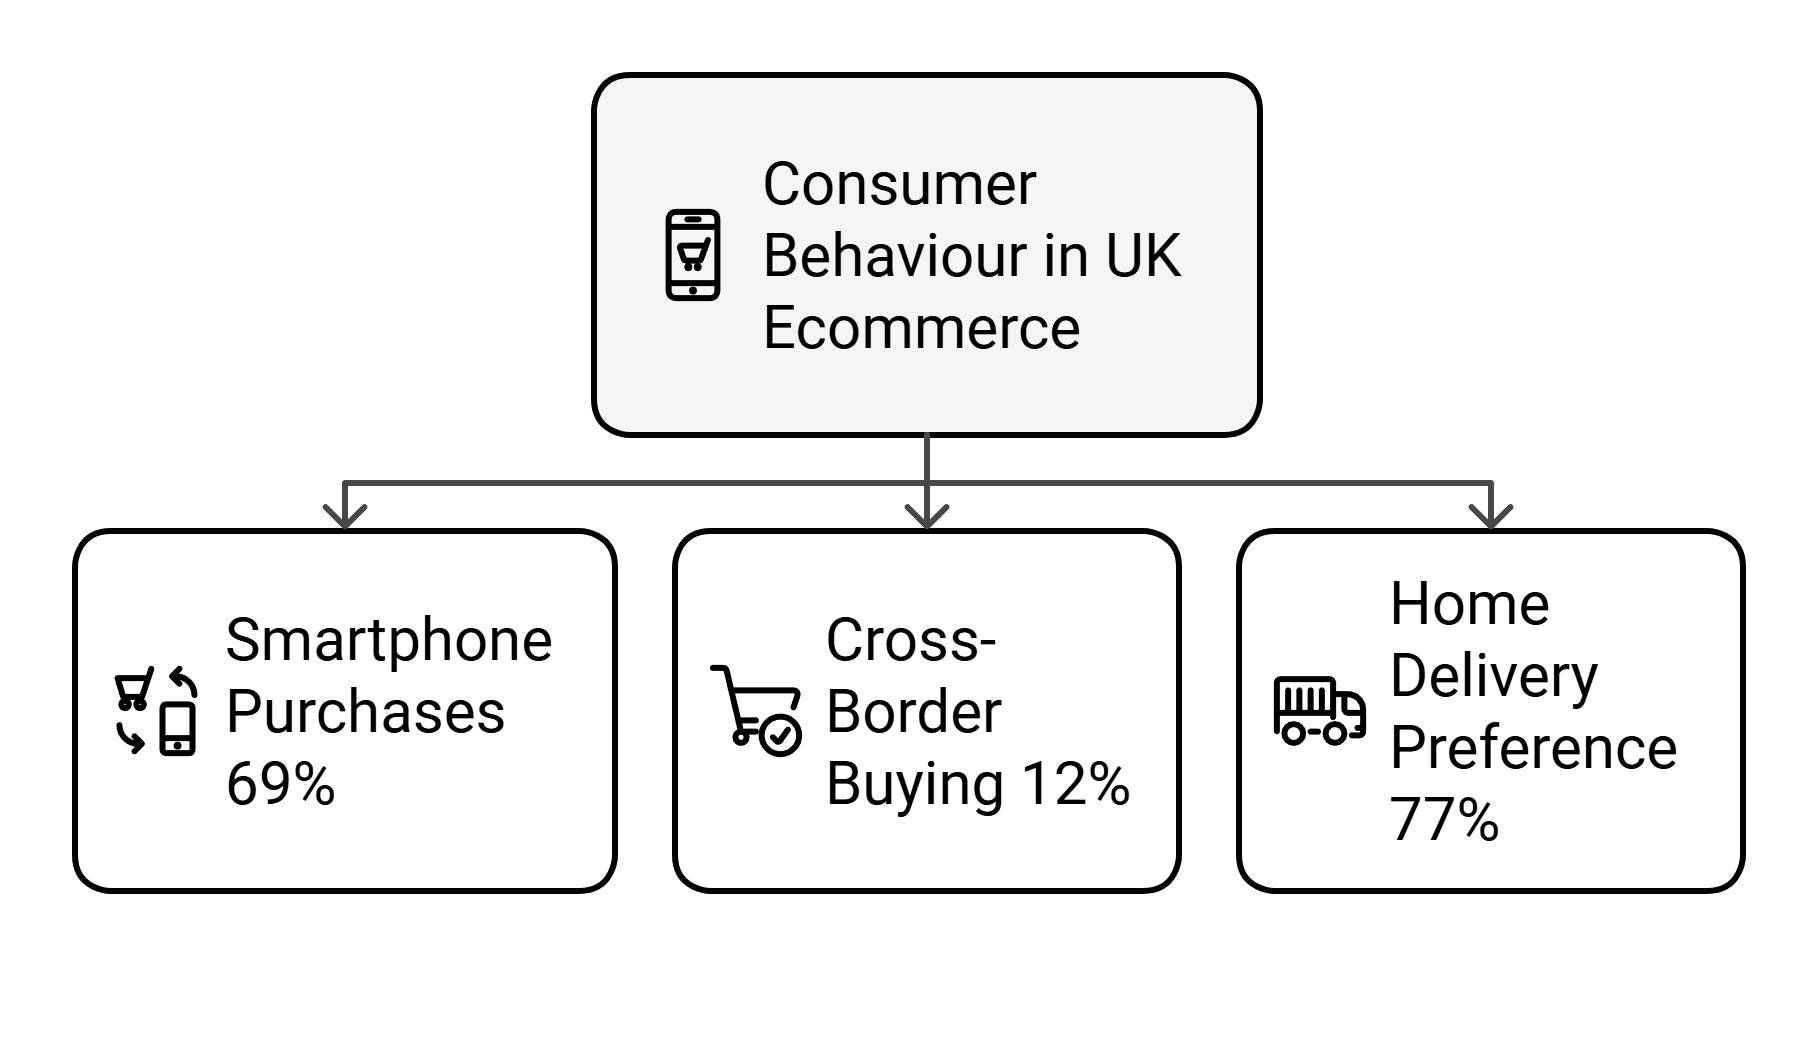
Mobile shopping has become central to UK retail:
- 69% of purchases happen on smartphones
- Digital payments support quick transactions
- Cross-border buying makes up 12% of sales
- 77% of shoppers prefer home delivery
Market Leaders and Competition
Amazon dominates UK ecommerce with over 400 million monthly visits, while eBay follows with 200 million visitors. Shopify powers many independent retailers, holding 21% market share. These platforms compete through price, delivery speed, and product range.
Fashion stands out as a key growth sector, expected to reach £86 billion by 2030. Retailers reach customers through multiple channels, including online marketplaces, their own websites, and physical stores supported by digital services.
Payments and Delivery
UK shoppers have embraced digital payments, making them the second most common choice after debit cards. PayPal leads in digital payments with 88% of online shoppers using the service.
Delivery speed affects buying decisions. Next-day shipping influences 37.7% of shoppers’ choices for most purchases. Click-and-collect has grown as an alternative to home delivery, letting customers pick up orders when convenient.
Top Ecommerce Markets Worldwide: FAQ
Here are the most searched questions about major ecommerce markets in 2024:
Which countries have the largest ecommerce marketplaces in 2024 and what is their market size?
China leads with $1,469 billion in revenue, followed by the US ($1.2 trillion), Japan ($169.40 billion), and South Korea (projected $170.1 billion by 2028). The UK tops Europe’s market with expected growth to £194.1 billion by 2027.
What are the leading marketplaces in each major market and their market shares?
In the US, Amazon holds 37.6%, Walmart 6.4%, and eBay 3.0%. China’s market is split between Alibaba (Taobao/Tmall), JD, and Pinduoduo. South Korea’s Coupang leads with 22.5%, followed by Naver at 17.0%. Japan’s top platforms are Amazon Japan and Rakuten.
How do payment methods differ across top ecommerce markets?
The US mainly uses credit cards and digital wallets. China relies on digital payments through Alipay and WeChat Pay. Japan splits between card payments (31%) and digital wallets (29%). The UK uses debit cards first, with PayPal reaching 88% of online shoppers.
What are the mobile shopping trends in the biggest ecommerce markets?
The UK sees 69% of purchases on smartphones, South Korea 73%, and the US 73%. China has the highest mobile shopping rate globally.
Which new trends are shaping the top ecommerce markets in 2024?
Cross-border commerce is growing, led by Chinese platforms like Temu. Live shopping makes up 2.5% of South Korea’s sales. AI personalization and same-day delivery are becoming common. Social commerce is expanding through platforms like TikTok.
Conclusion: What’s Next for Global Ecommerce Markets
The world’s ecommerce markets show clear patterns in 2024. China and the US maintain their lead with trillion-dollar markets. Mobile shopping is now standard, with over 70% of purchases happening on phones. Digital payments are replacing cash, especially in Asia.
Cross-border selling is growing fast, with platforms like Temu expanding globally. Fast delivery and AI tools are no longer optional - they’re becoming basic requirements for success.
These changes point to a shift: the lines between local and global markets are fading.
Sellers can now reach customers worldwide, while shoppers can buy from any market. This makes 2024 a turning point for global ecommerce.