![Product Performance Analysis with Shopify Analytics [2025 Guide]](https://media.analyzify.com/4/8335/product-performance-analysis-shopify-analytics-FPgnom3x.png)
Once you build your Shopify store, you get many built-in reports for product performance analysis with Shopify Analytics.
Here, we take a look at Shopify Analytics, covering:
- Reports for product performance analysis
- How to use them for better analyses
- Limitations of Shopify Analytics
- Alternatives for Shopify product performance analysis
along with the most frequently asked questions about this important topic.
Let’s learn what Shopify Analytics provides, and explore an insightful guide that will help you analyze your product performance on Shopify better.
Checking Product Performance Reports on Shopify
Before we go on and discover how to analyze product performance on Shopify, let’s get started by checking product performance reports on Shopify.
Here, we will first have a quick look at all the Shopify Analytics reports that can provide valuable insights into your product performance.
Then, we will explore what kind of questions the most important product-related Shopify Analytics reports can answer.
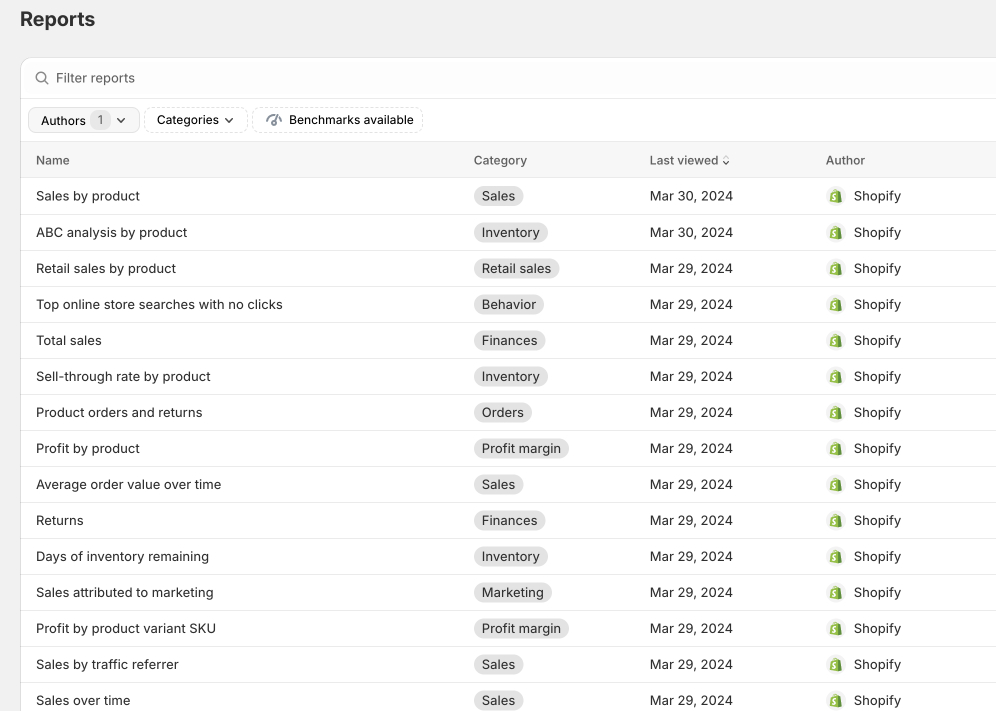
A List of Shopify Analytics Reports for Product Performance Analysis
Here are all the important Shopify Analytics reports that can help you with product performance analysis:
Sales
- Sales over time
- Sales by product
- Sales by traffic referrer
- Average order value over time
- Sales by channel
- Sales by checkout currency
- Sales by discount
- Sales by product vendor
Inventory
- Sell-through rate by product
- Average inventory sold per day
- ABC analysis by product
- Days of inventory remaining
- Month-end inventory snapshot
- Month-end inventory value
- Percent of inventory sold
Finances
- Net sales
- Cost of goods sold
- Discounts
- Gross profit
- Gross sales
- Net sales with cost
- Returns
- Total sales
Retail Sales
- Retail sales by product
- Retail sales by product type
- Retail sales by product variant SKU
- Retail sales by product vendor
Profit Margin
- Profit by product
- Profit by product variant SKU
Behaviour
- Online store cart analysis
Marketing
- Sales attributed to marketing
Orders
- Product orders and returns
Now, let’s take a deeper look at some of the most important ones for a decent product performance analysis with Shopify Analytics:
Sales by Product
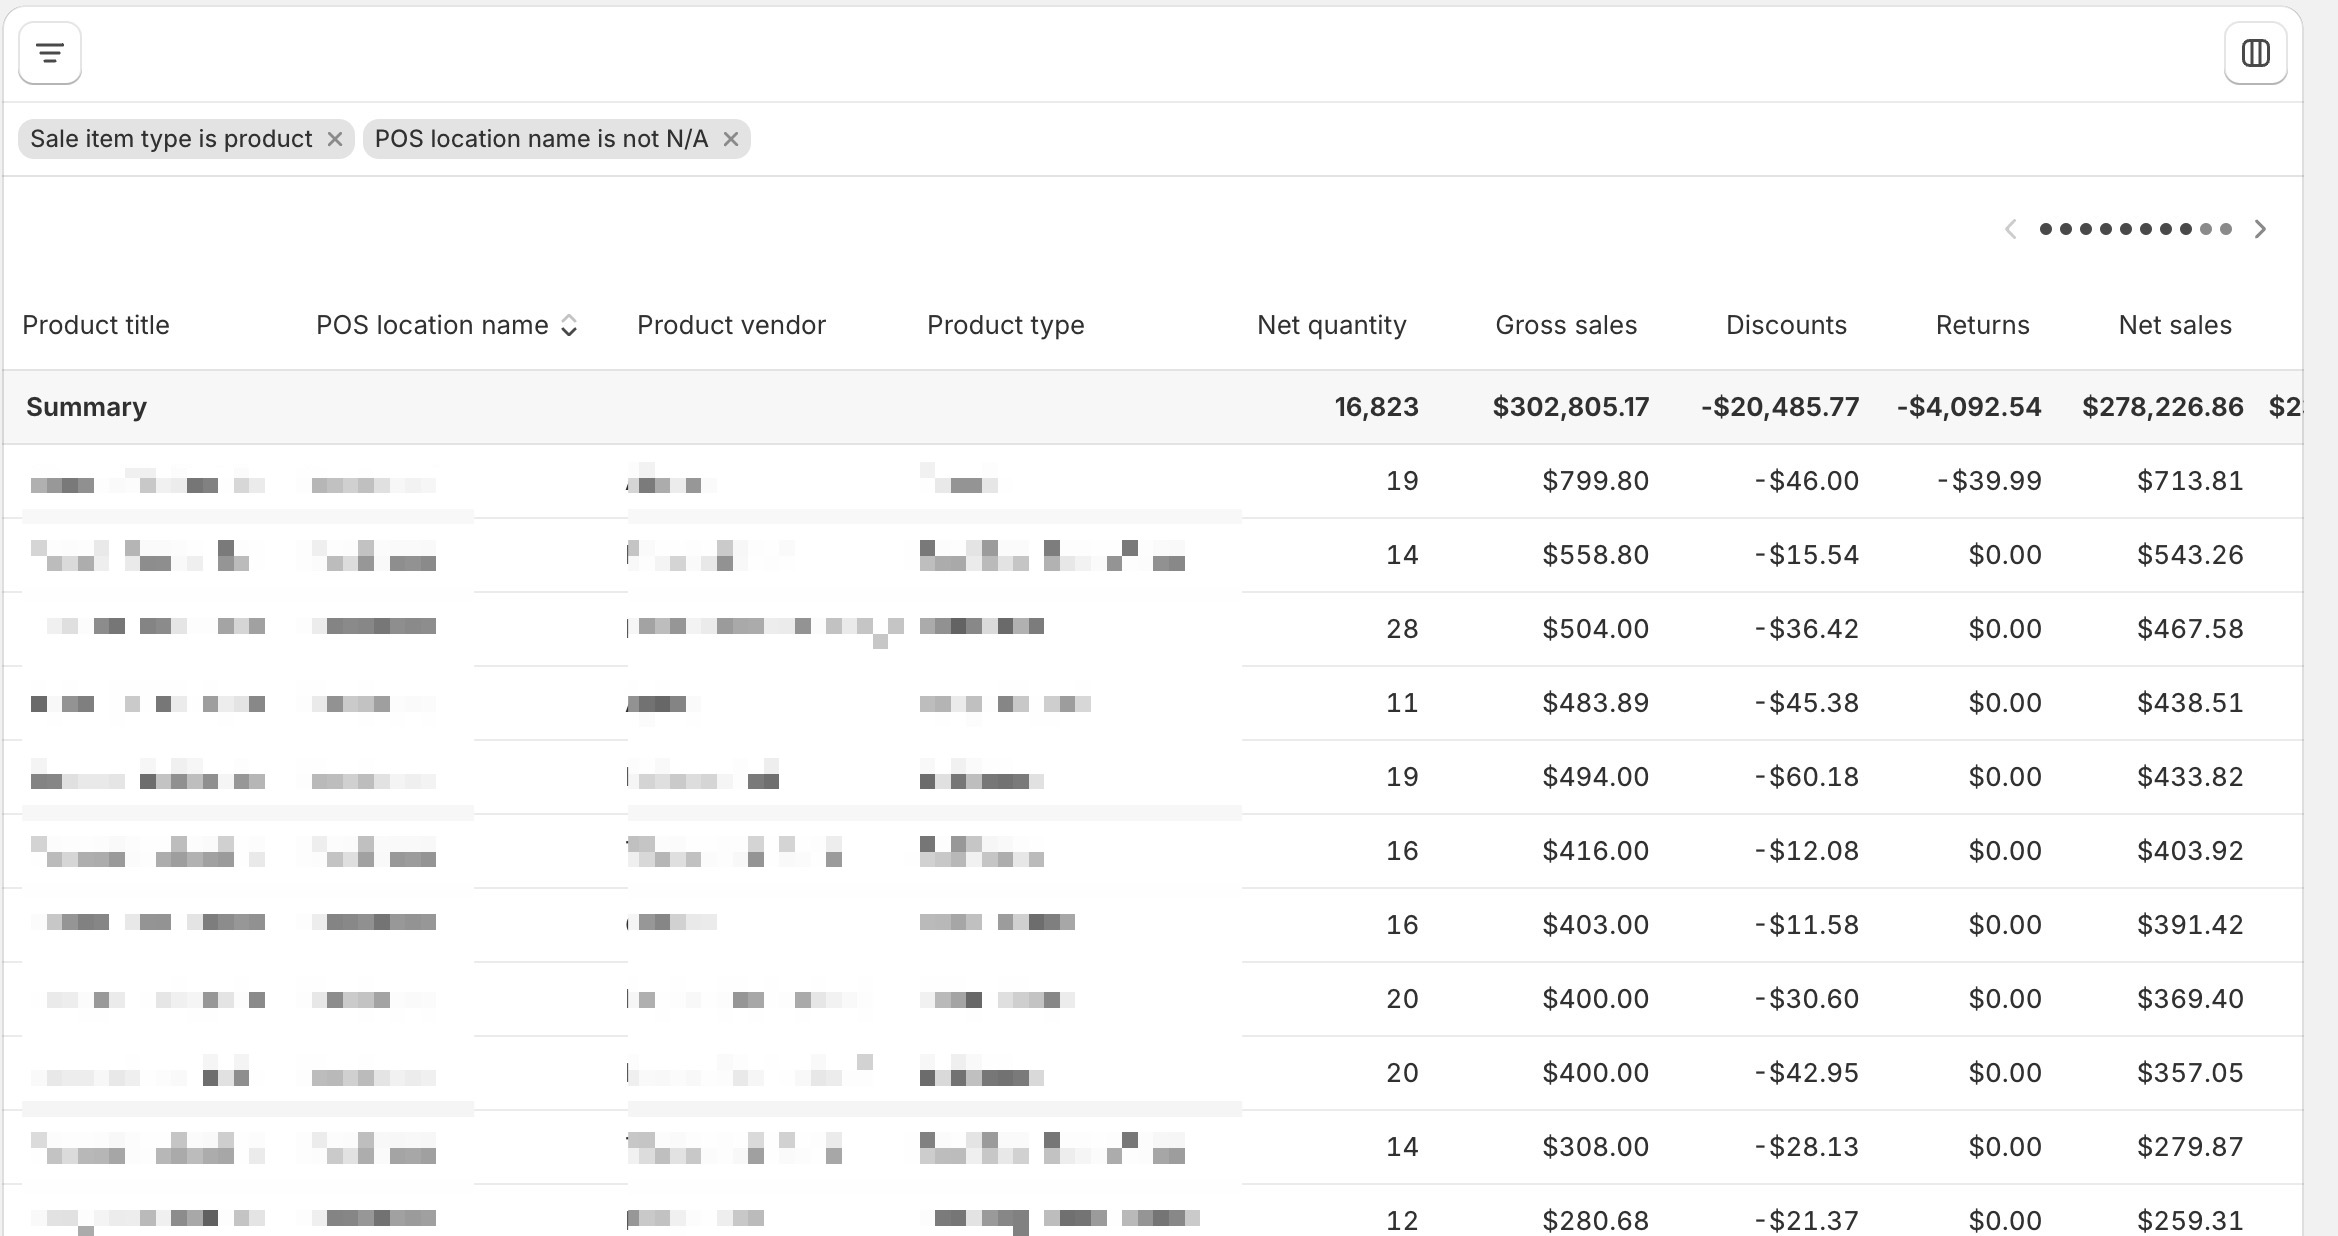
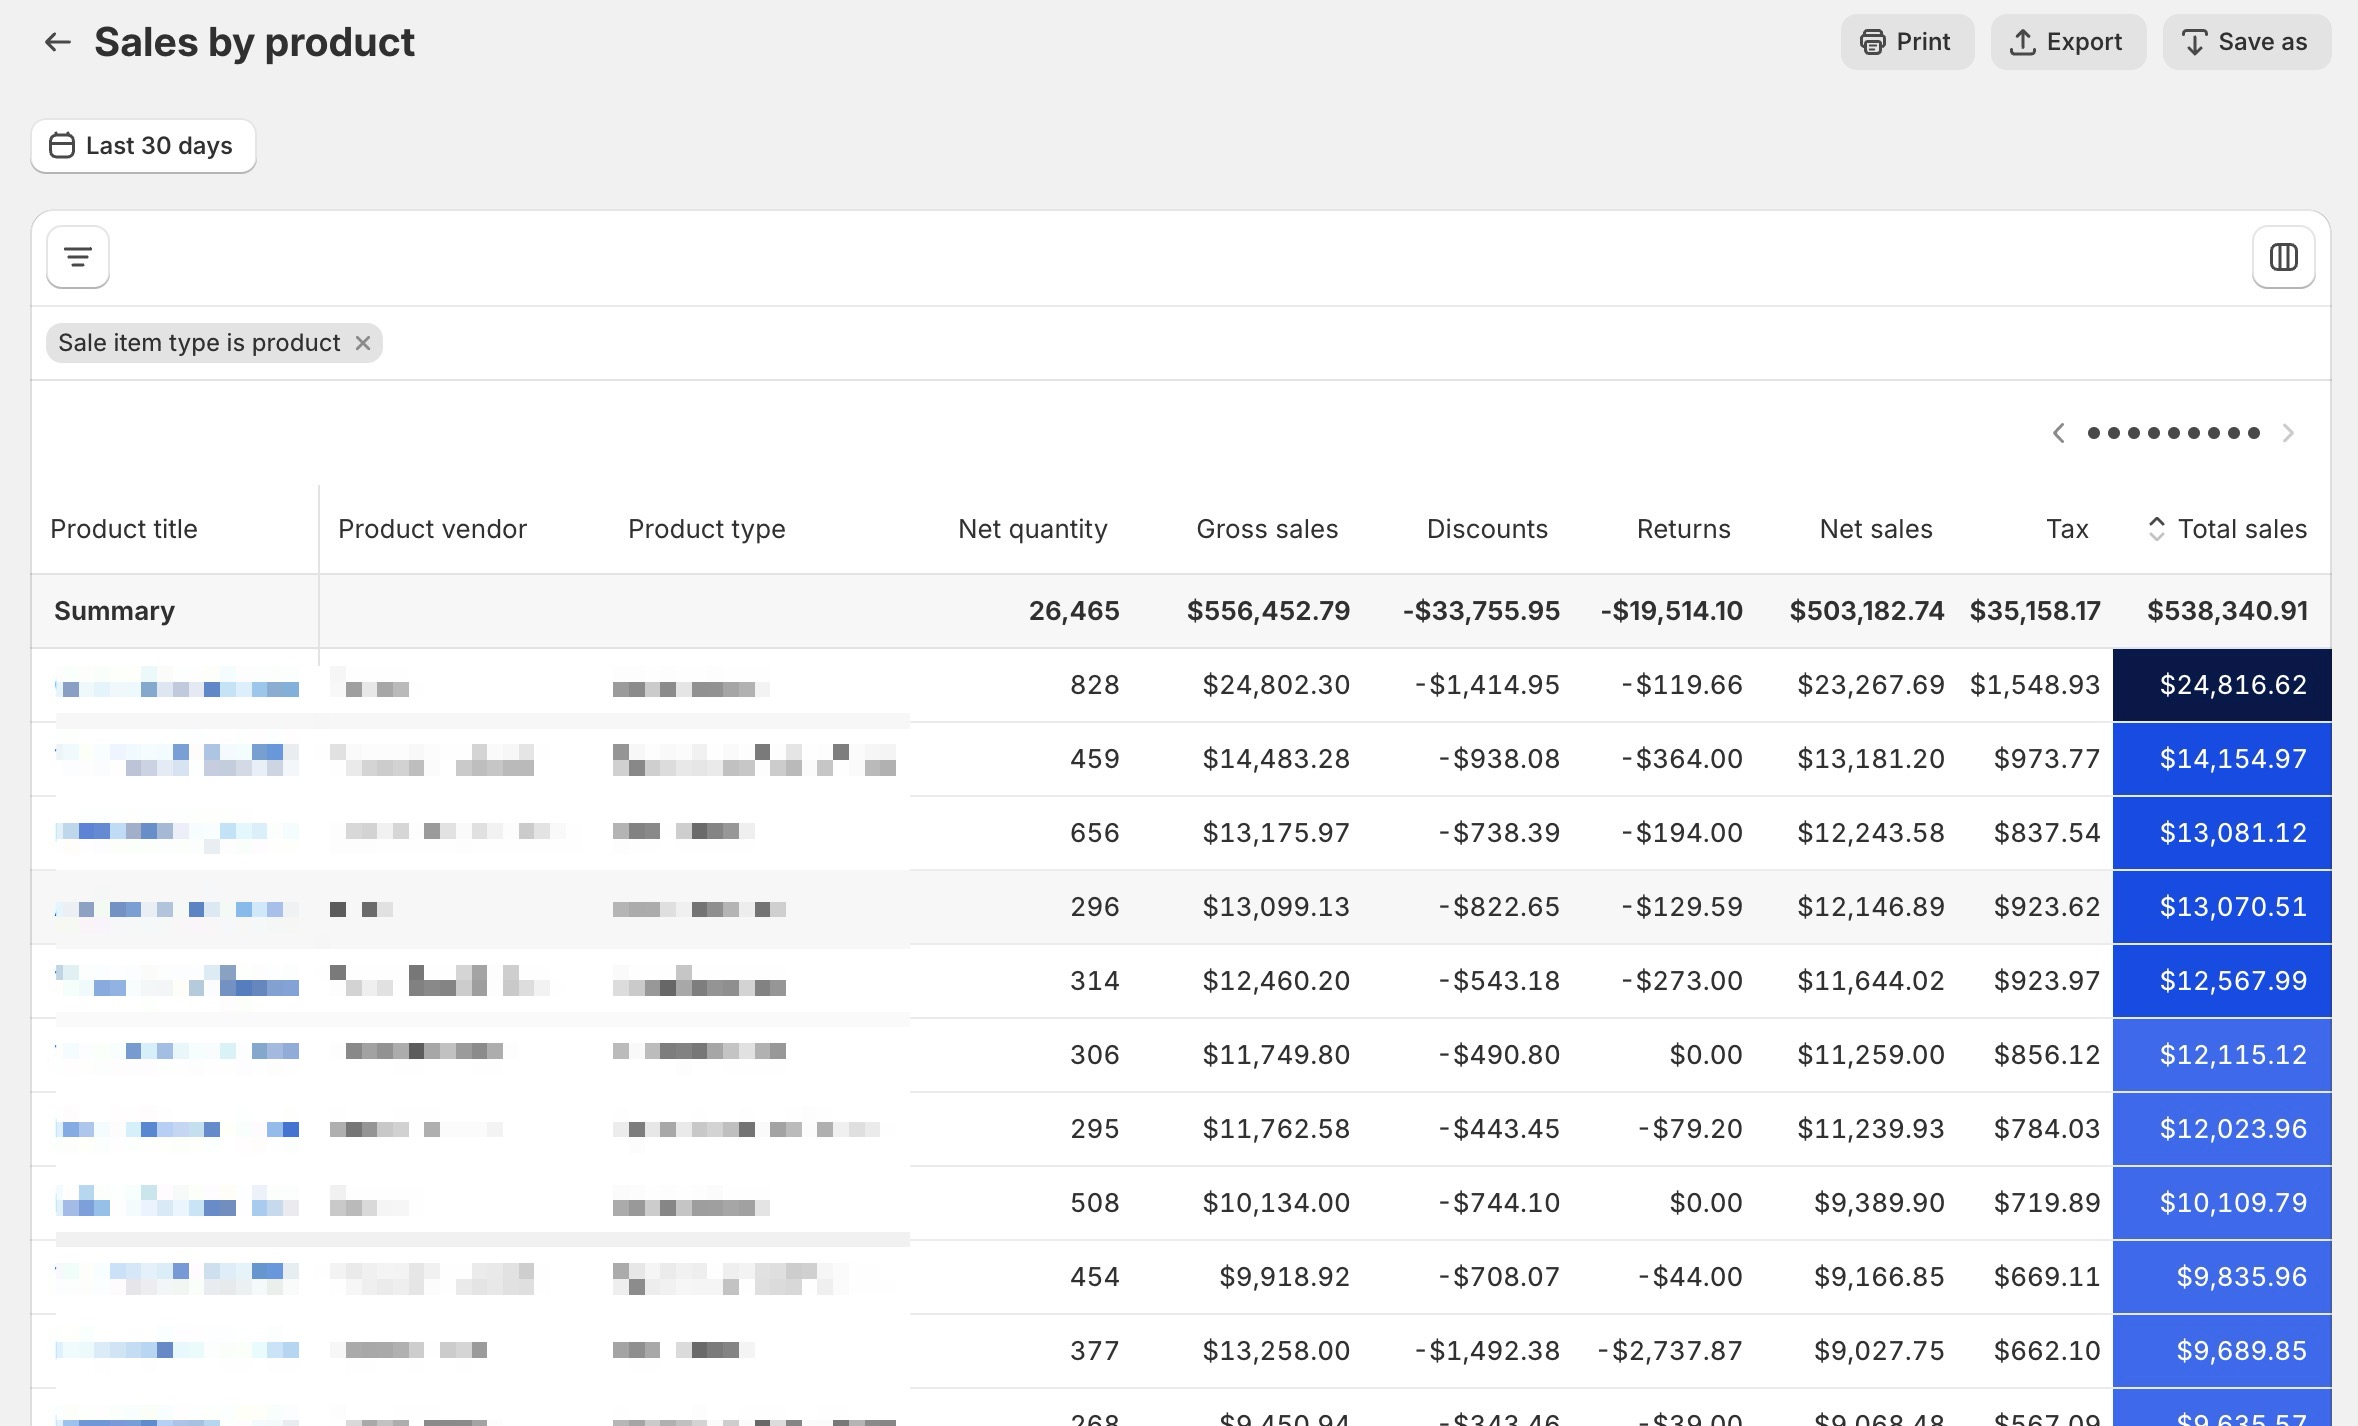 The “Sales by Product” report in Shopify Analytics offers an overview of sales performance across different products or product variants within your Shopify store.
This report displays the quantity of products sold, the revenue generated from each product, and other key performance indicators such as returns and discounts applied.
It allows you to pinpoint which products are their top performers and which may require further marketing efforts or adjustments in strategy.
What Questions the Sales by Product Report Answers:
- Which products are the top sellers?
- How do discounts impact sales of particular products?
- Which products have the highest return rates?
- How do product variants perform against each other?
- What is the average order value for specific products?
- How do specific products contribute to overall sales?
and more.
How to See This Report:
Navigate to Analytics > Reports > Sales by product (under the category of Sales)
You can customize this report by adding more metrics through the Filter and the Column icons to find more specific answers.
Average Order Value Over Time
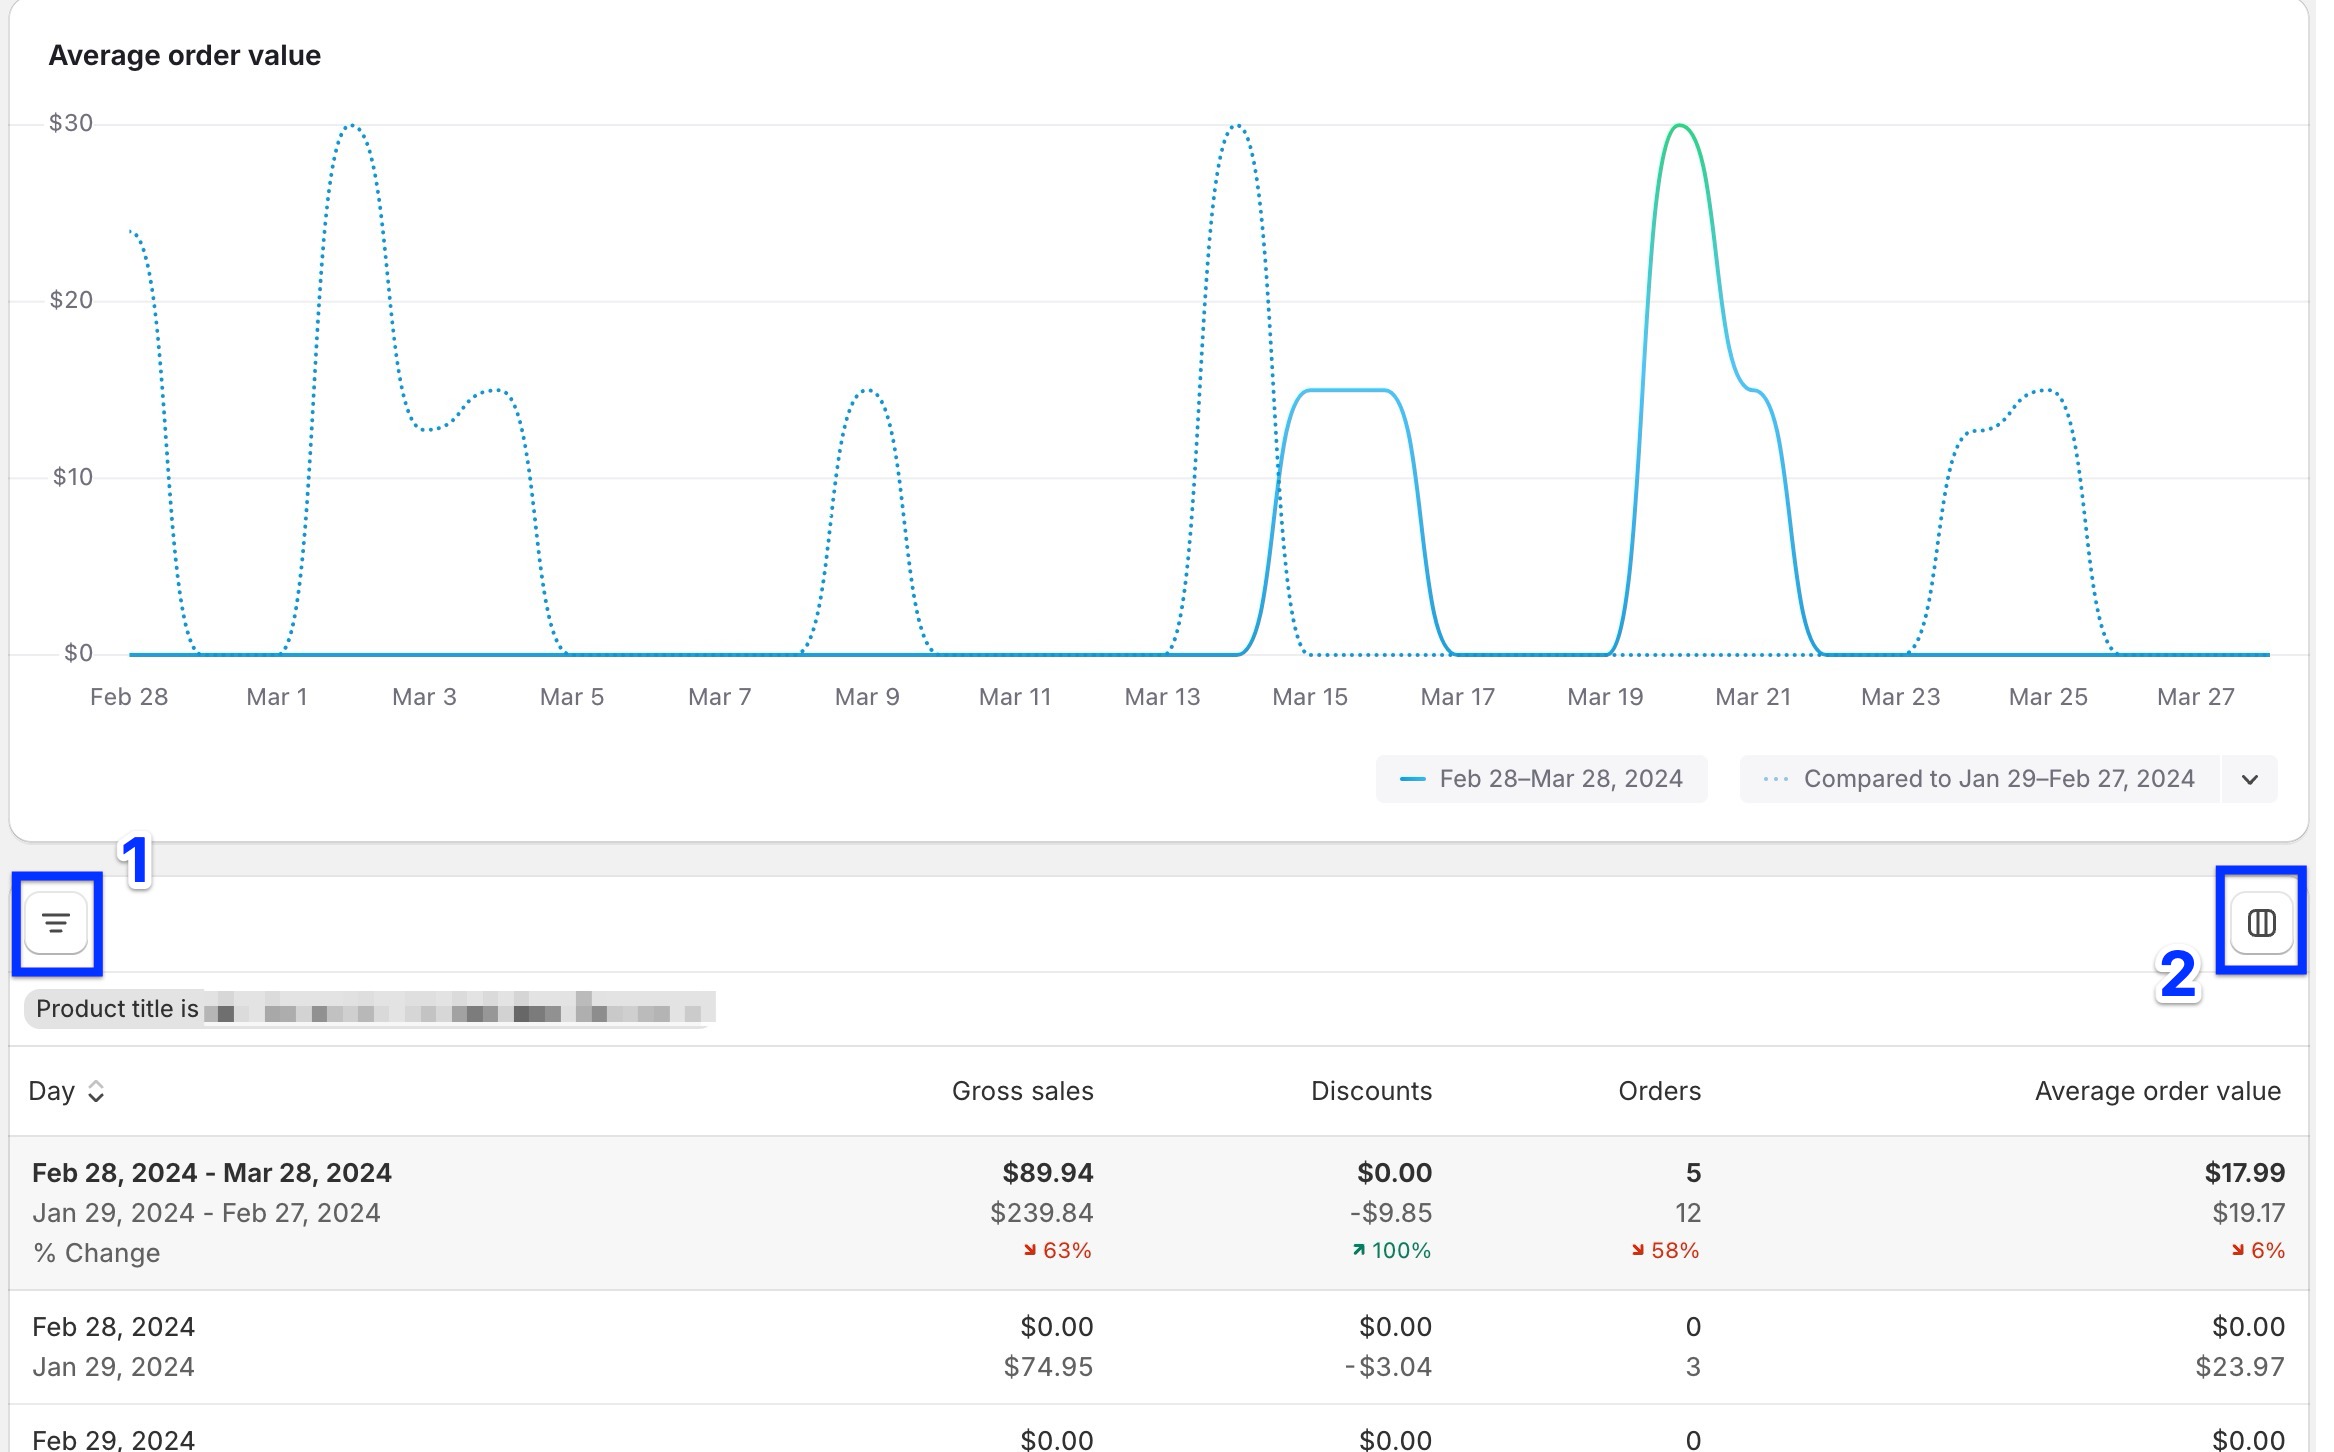 The “Average Order Value Over Time” report in Shopify Analytics provides insights into the average amount of money customers spend on products in your store over a specified period.
This metric is crucial for understanding purchasing behaviors and evaluating the effectiveness of pricing strategies, promotions, and product mix.
By tracking changes in the average order value (AOV) over time, you can make informed decisions to improve/change marketing strategies, optimize product offerings, etc.
Once you customize the “Average Order Value Over Time” report in Shopify Analytics by clicking on the filter icon (1) and choosing “Product title” and adding a specific product - and adding extra metrics such as “Returns” by clicking the columns (2), you can find answers to such questions:
What Questions the Average Order Value Over Time Report Answers:
- How has the average order value trended over time?
- Does the introduction of new products or product bundles influence customer spending?
- What is the effect of promotions or discounts on order value?
- How do seasonal trends affect average order value?
- What’s the difference in average order value across product types?
and more.
How to See This Report:
Navigate to Analytics > Reports > Average order value over time (under the category of Sales)
Profit by Product
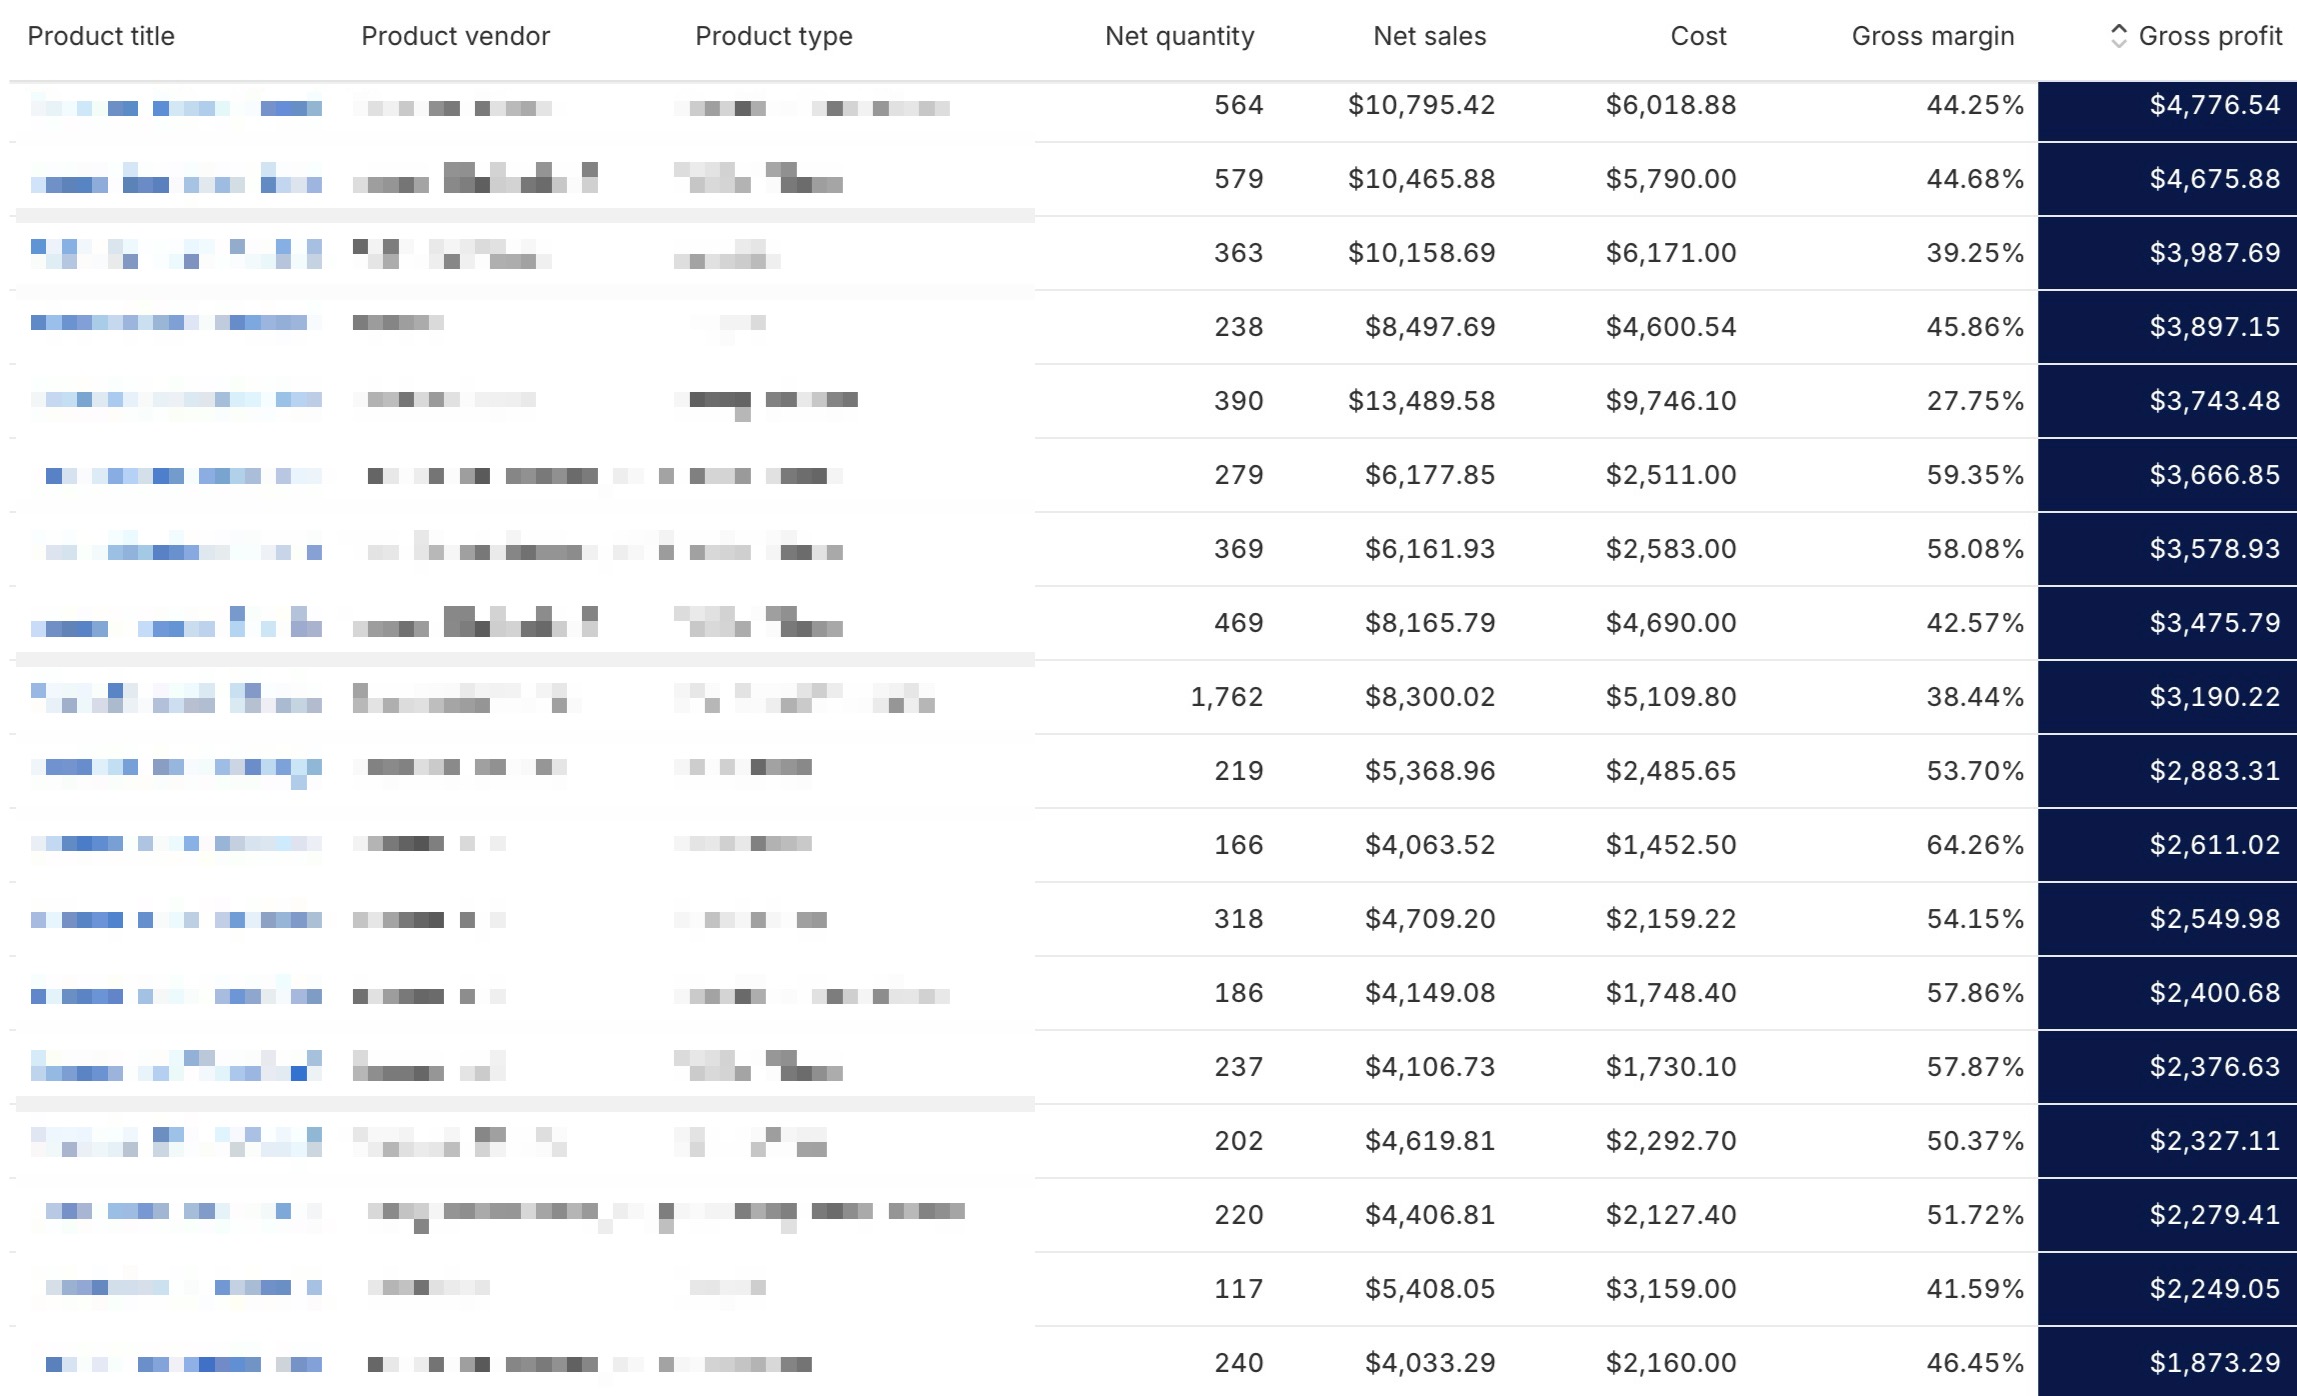
 The “Profit by Product” report in Shopify Analytics offers you a comprehensive view of the profitability of each product or product variant sold in your Shopify store.
If you check this report regularly, you can see which products contribute most to your bottom line and make better decisions about your inventory management, pricing strategies, and product development.
What Questions the Profit by Product Report Answers:
- Which products are the most profitable?
- How do product costs impact the overall profitability of a product?
- Are there any products that result in a loss?
- How do discounts and promotions affect product profitability?
- What is the contribution of each product to the overall profit?
- How does the mix of product sales affect profitability over time?
- Are there seasonal variations in product profitability?
and more.
How to See This Report:
Navigate to Analytics > Reports > Profit by product (under the category of Profit margin)
You can customize this report by adding more metrics through the Filter and the Column icons to find more specific answers.
Product Orders and Returns
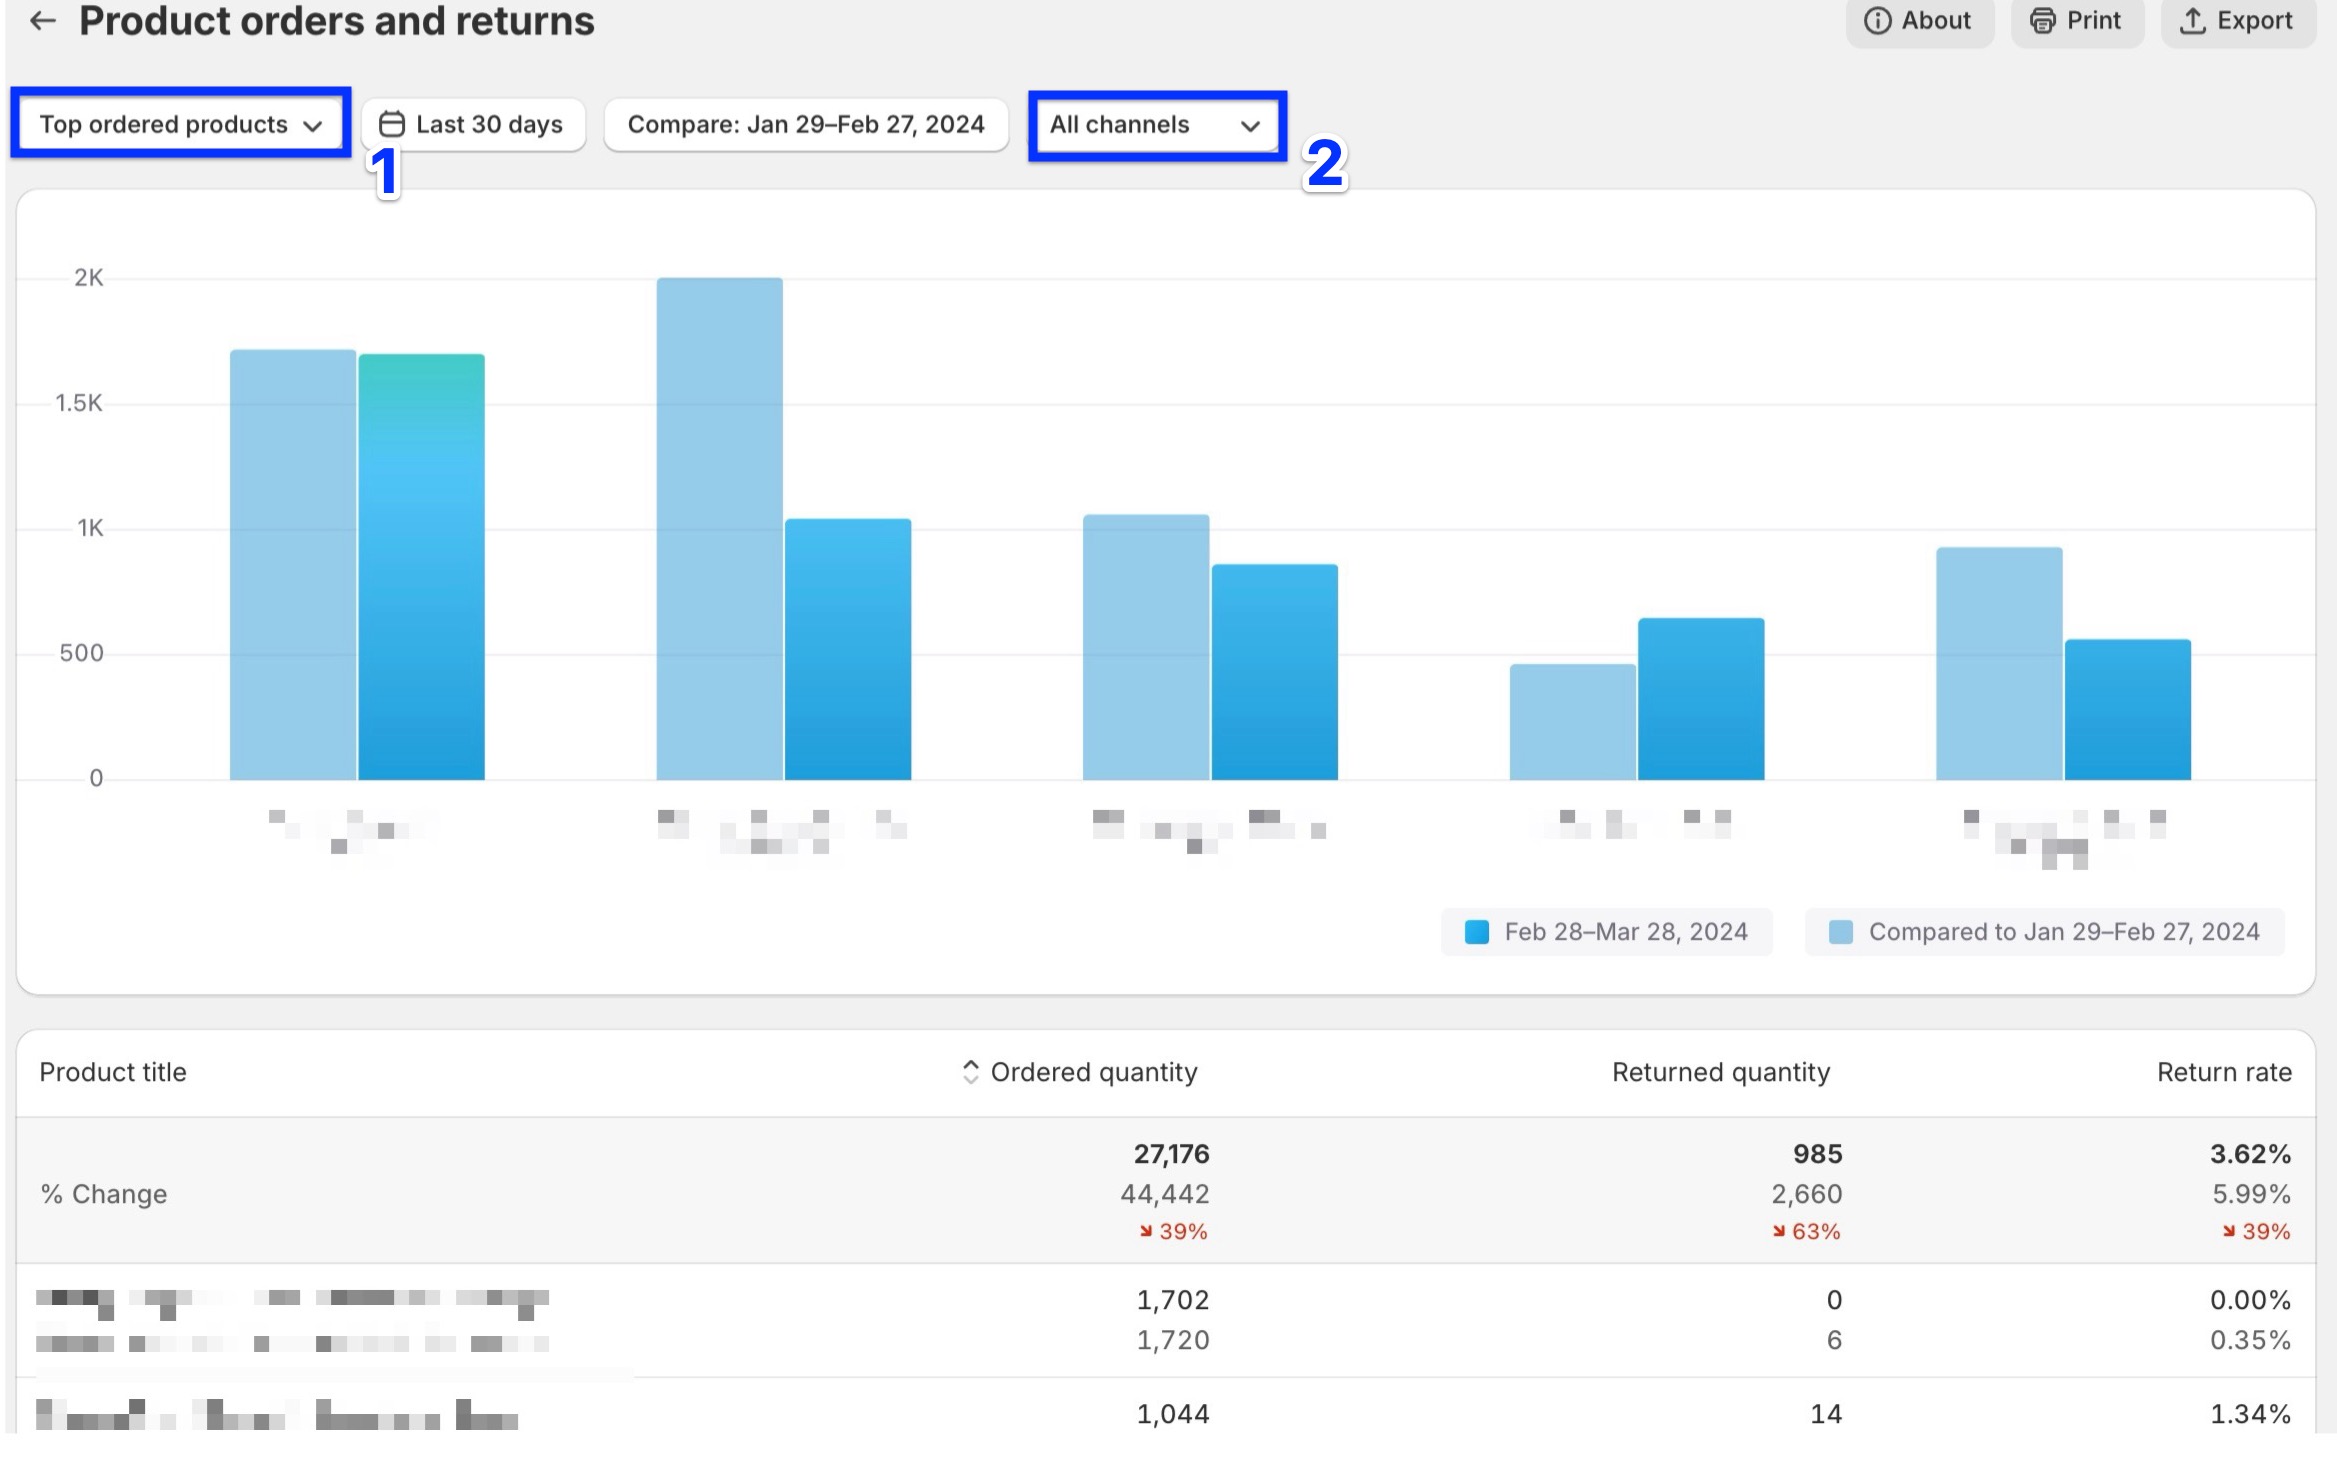 The “Product Orders and Returns” report presented in Shopify Analytics gives you a detailed overview of both the orders and return activities for your products.
This report tracks the number of orders placed and the returns registered, providing a return rate that you can compare in different periods for your products.
What Questions the Product Orders and Returns Report Answers:
- What is the ratio of orders to returns for each product?
- How do return rates compare across different products?
- Which products have a high sales volume but also a high return rate?
- Are there any differences in order or return activity over time?
You can also change the view of your report by clicking on “Top ordered products” (1) and selecting from other options, such as “Top returned products” and “Top products by return rate”.
In addition, you can click “All channels” (2) to see the difference in product orders and returns between your sales channels.
How to See This Report:
Navigate to Analytics > Reports > Product orders and returns (under the category of Orders)
Sell-Through Rate by Product
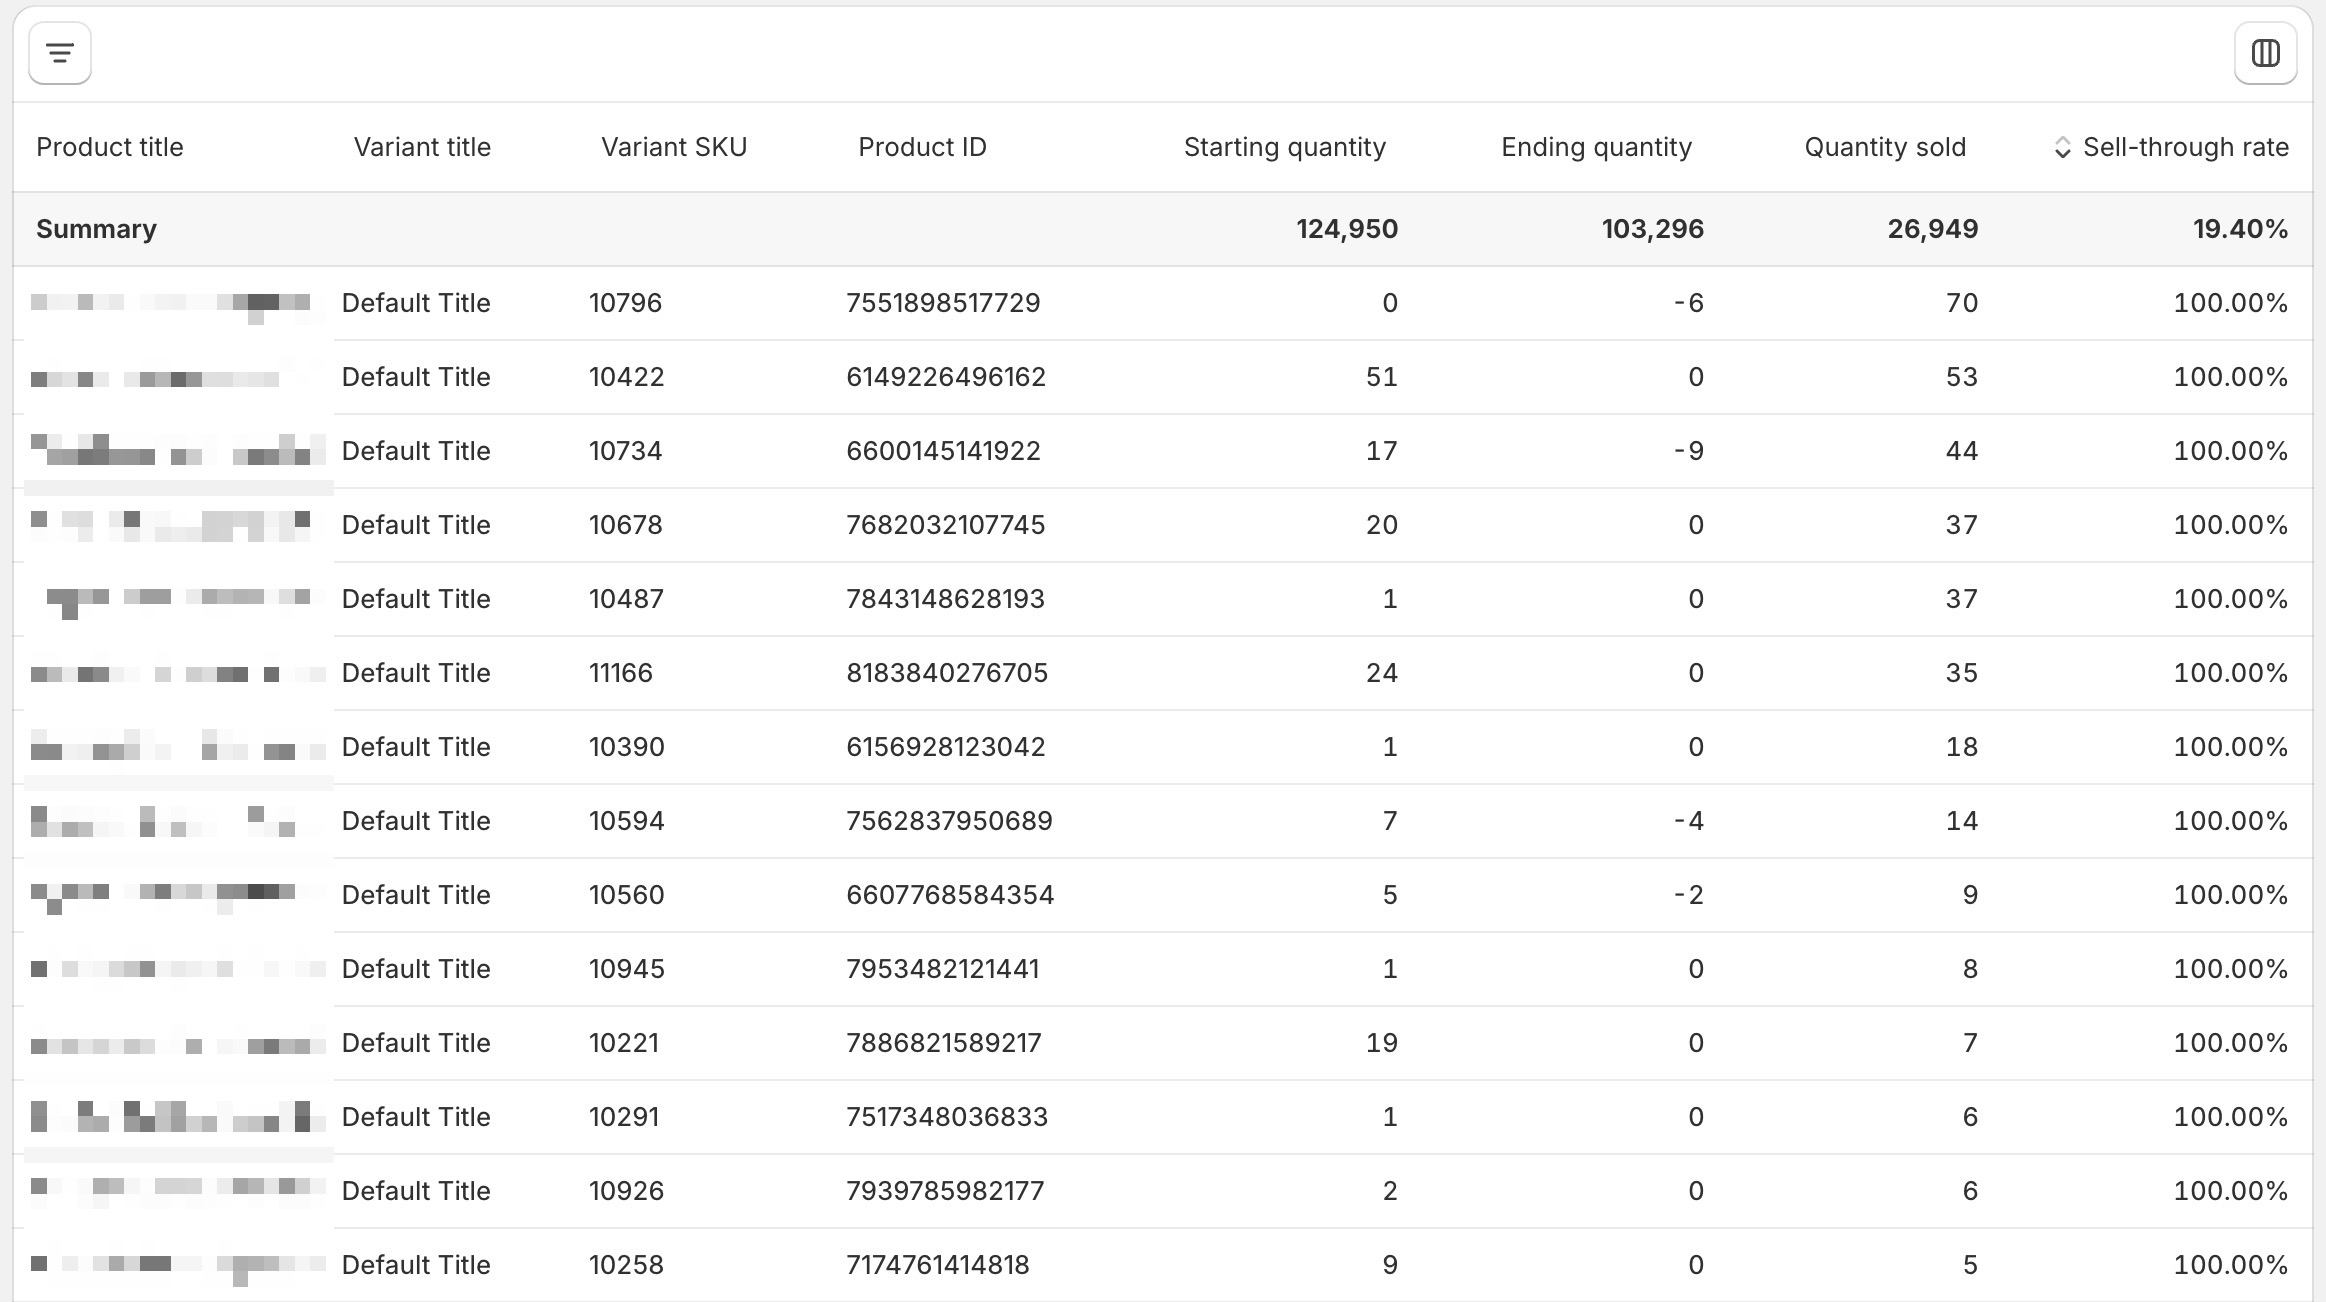 The “Sell-through Rate by Product” report lets you get a measure of how much of your total inventory quantity is sold within a specific timeframe.
This report calculates the sell-through rate as: “Total quantity of items sold / (total quantity of items sold + total quantity of items still in inventory)”.
It’s an important report to help you understand product demand and inventory efficiency, and make informed decisions on purchasing, pricing, and promotional strategies.
What Questions the Sell-through Rate by Product Report Answers:
- Which products have the highest sell-through rate?
- Are there products with consistently low sell-through rates?
- How do seasonal trends affect sell-through rates?
- What is the impact of promotions on sell-through rates?
- How does the sell-through rate inform restocking decisions?
- Have the adjustments made for products with low sell-through rates worked to improve their performance?
And more.
How to See This Report:
Navigate to Analytics > Reports > Sell-through rate by product (under the category of Inventory)
You can customize this report by adding more metrics through the Filter and the Column icons to find more specific answers.
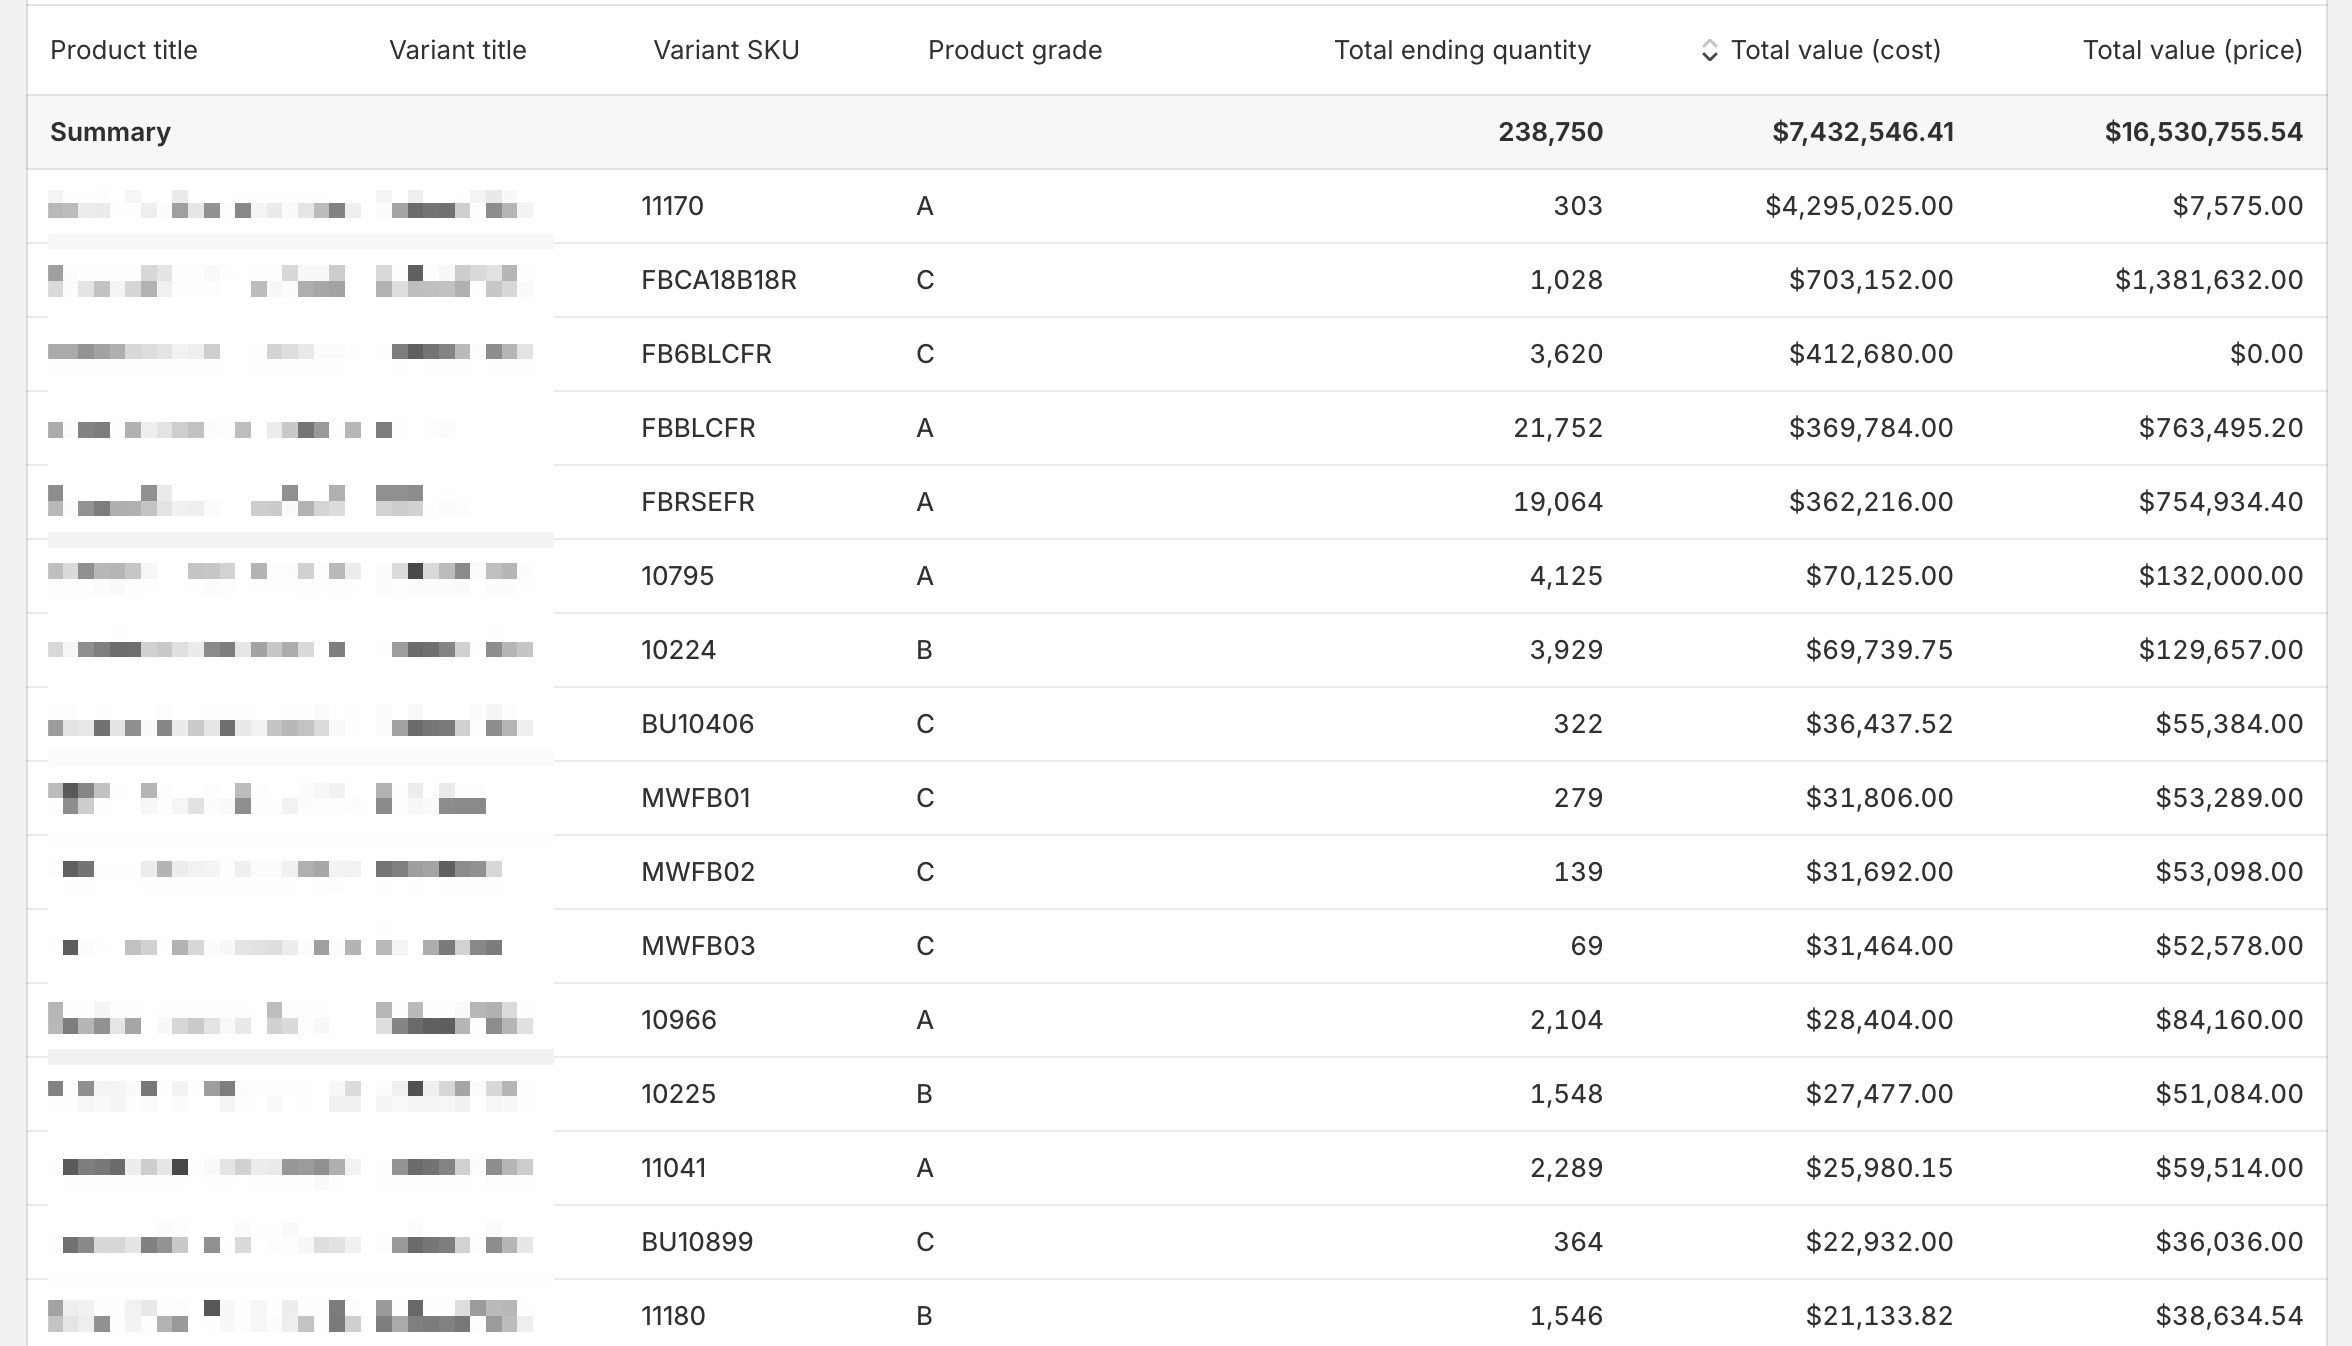
ABC Analysis by Product
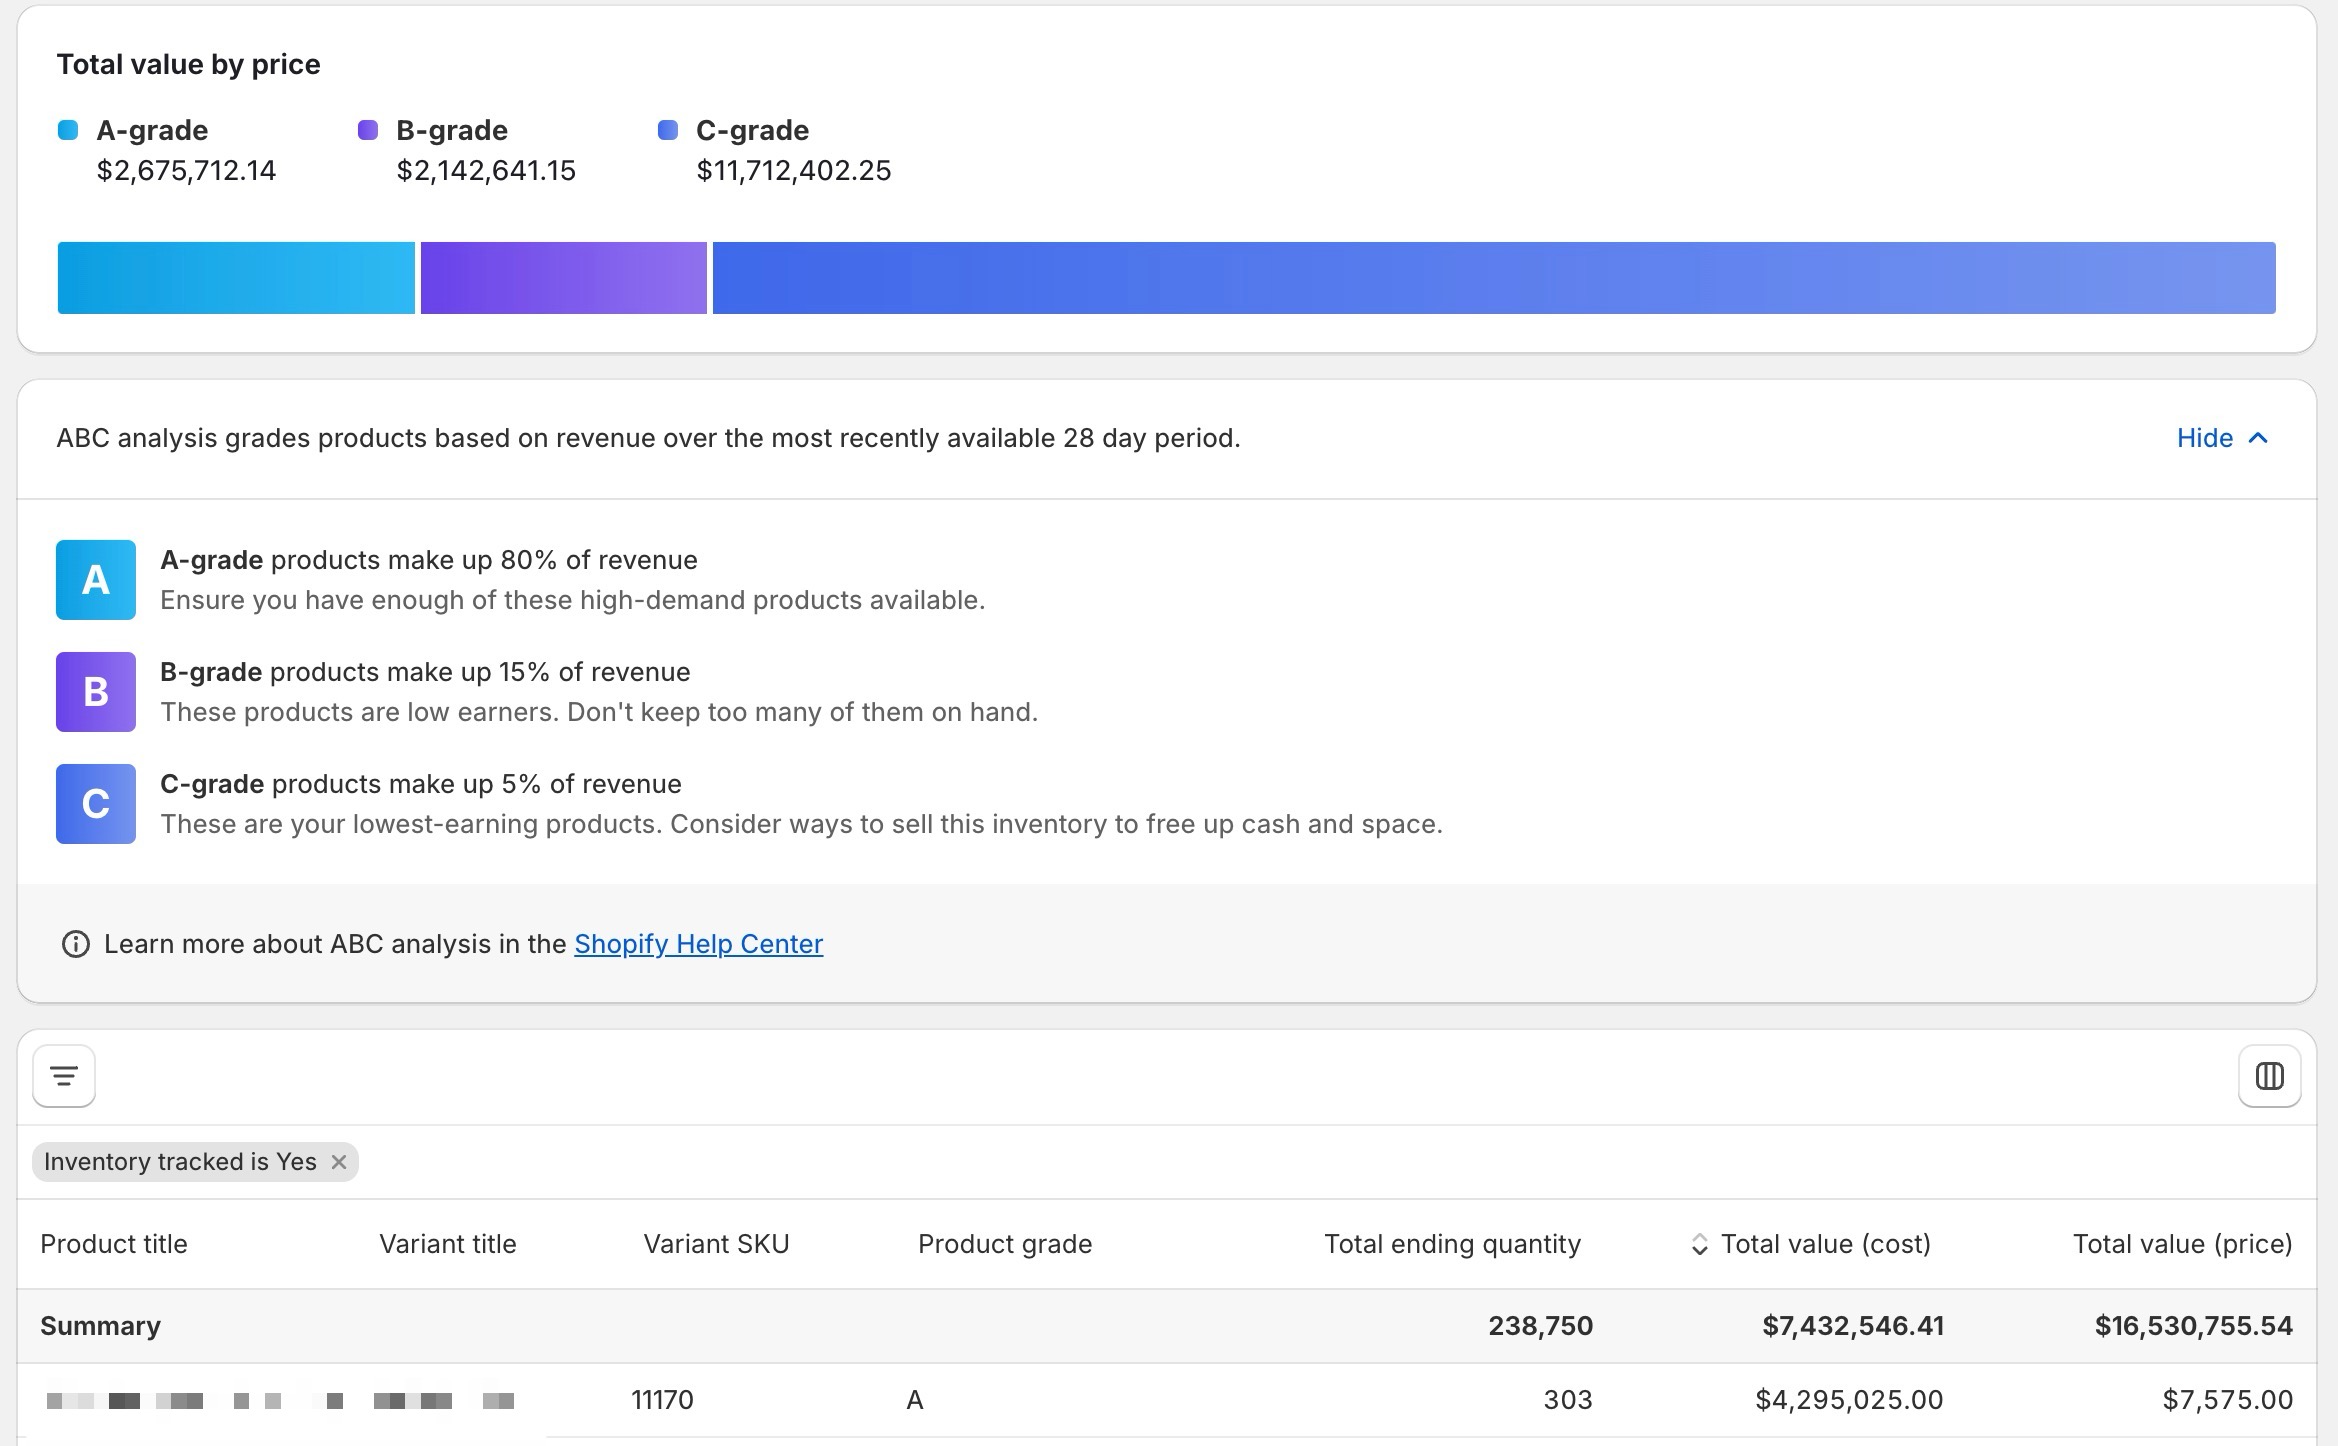
The “ABC Analysis by Product” report in Shopify Analytics acts as a strategic inventory management report.
This report categorizes products into three classes (A, B, and C) based on their sales performance and importance to the overall revenue.
Class A includes the most valuable products that contribute the most to your revenue, Class B represents products with a moderate impact, and Class C includes the least performing products.
It can help you prioritize your inventory management efforts, optimize stock levels, and focus on strategies to maximize profitability.
What Questions the ABC Analysis by Product Report Answers:
- Which products are critical to the store’s revenue?
- What inventory requires active management but is less critical than top performers?
- Which products have the lowest sales performance and impact on revenue?
- What product types contribute most to the overall sales?
- Which products need attention & care to improve the sales performance?
And more.
How to See This Report:
Navigate to Analytics > Reports > ABC Analysis by Product (under the category of Inventory)
You can customize this report by adding more metrics through the Filter and the Column icons to find more specific answers.
Total Sales
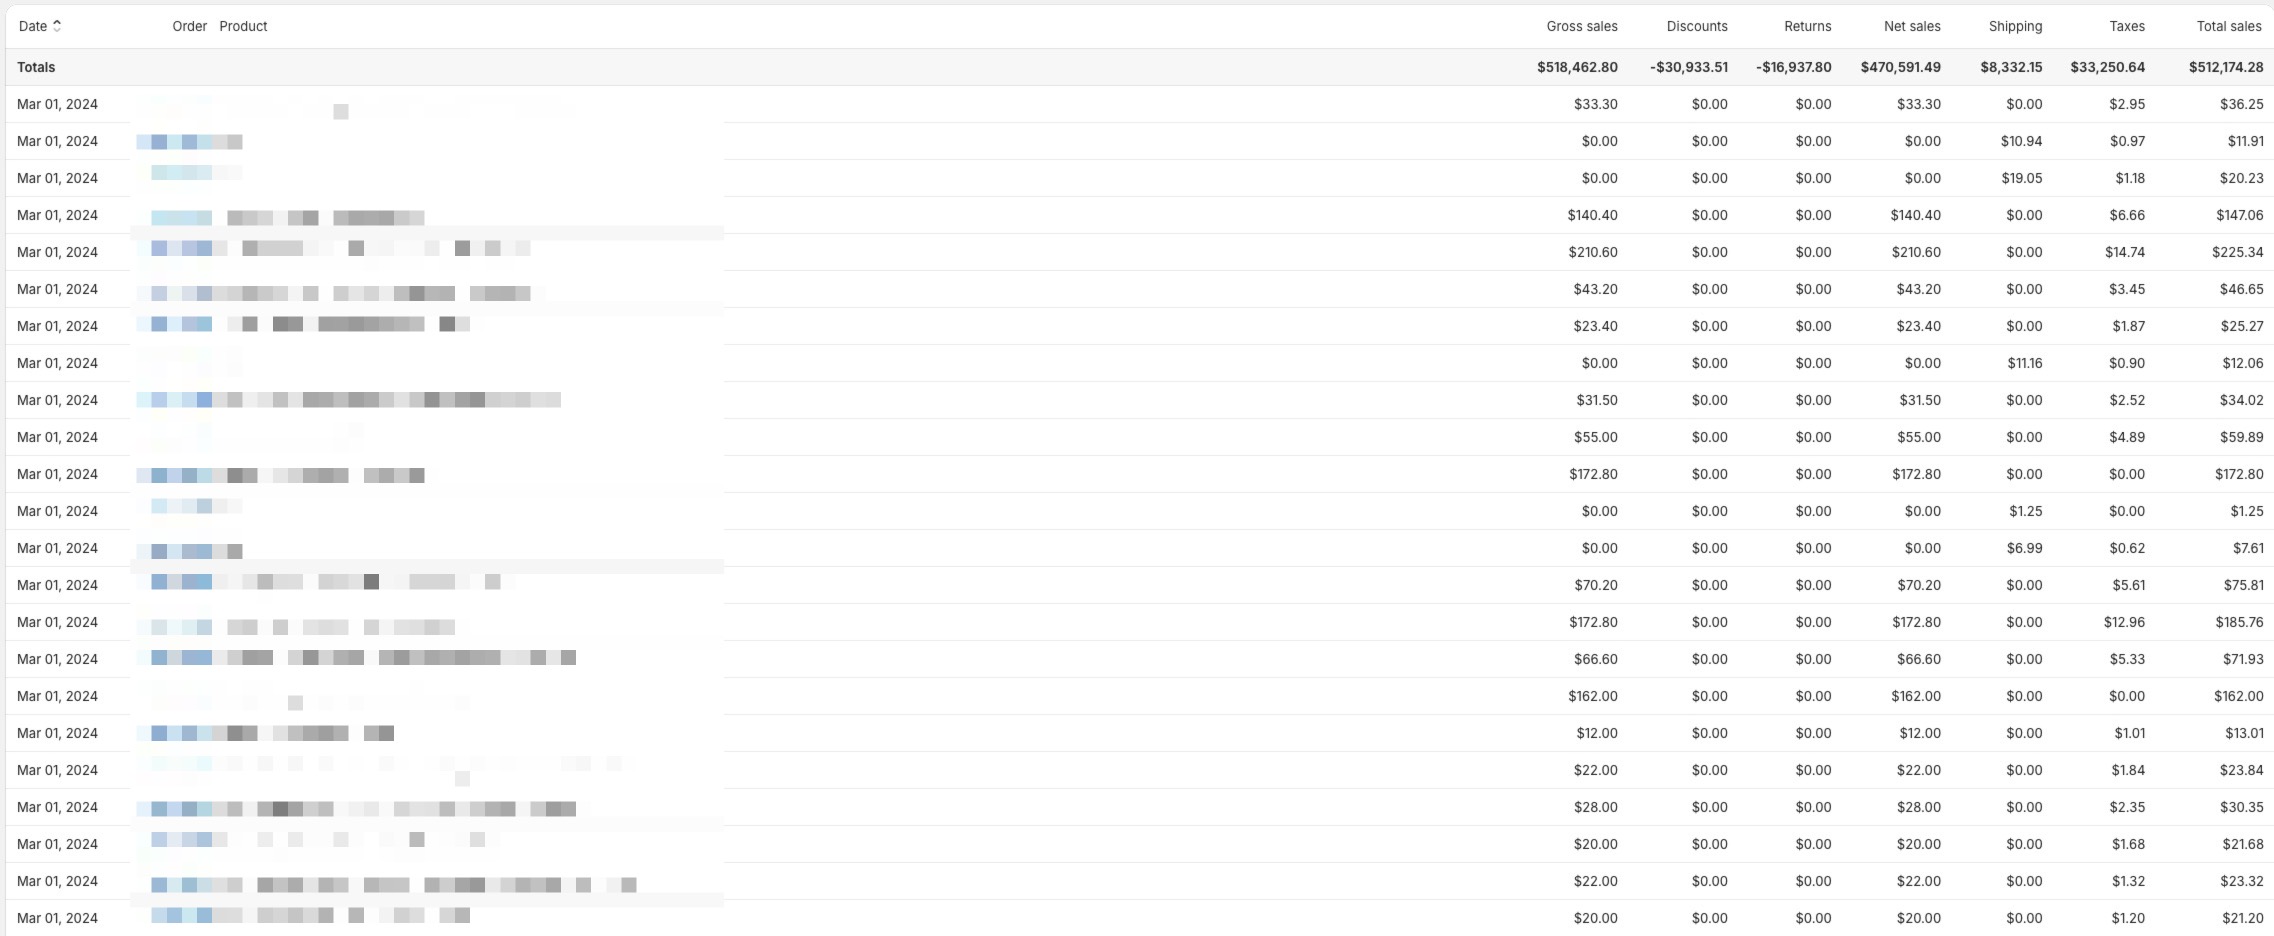 The “Total Sales” report in Shopify Analytics presents an overview of the revenue generated by the specific products over a specific period.
It gives the total income from all sales channels, including online sales, point of sale (POS), and other integrations, deducting returns, taxes, and shipping charges to provide a clear picture of the net sales.
What Questions the Total Sales Report Answers:
- What is the total revenue generated by the X product?
- How do net sales of the X product compare across different periods?
- What impact do returns, taxes etc. have on the total sales of a product?
- Which sales channels are most profitable for the X product?
- Are there any seasonal trends in a product’s sales data?
- How effective are my sales and marketing strategies for the X product?
And more.
How to See This Report:
Navigate to Analytics > Reports > Total Sales (under the category of Finances)
Online Store Cart Analysis
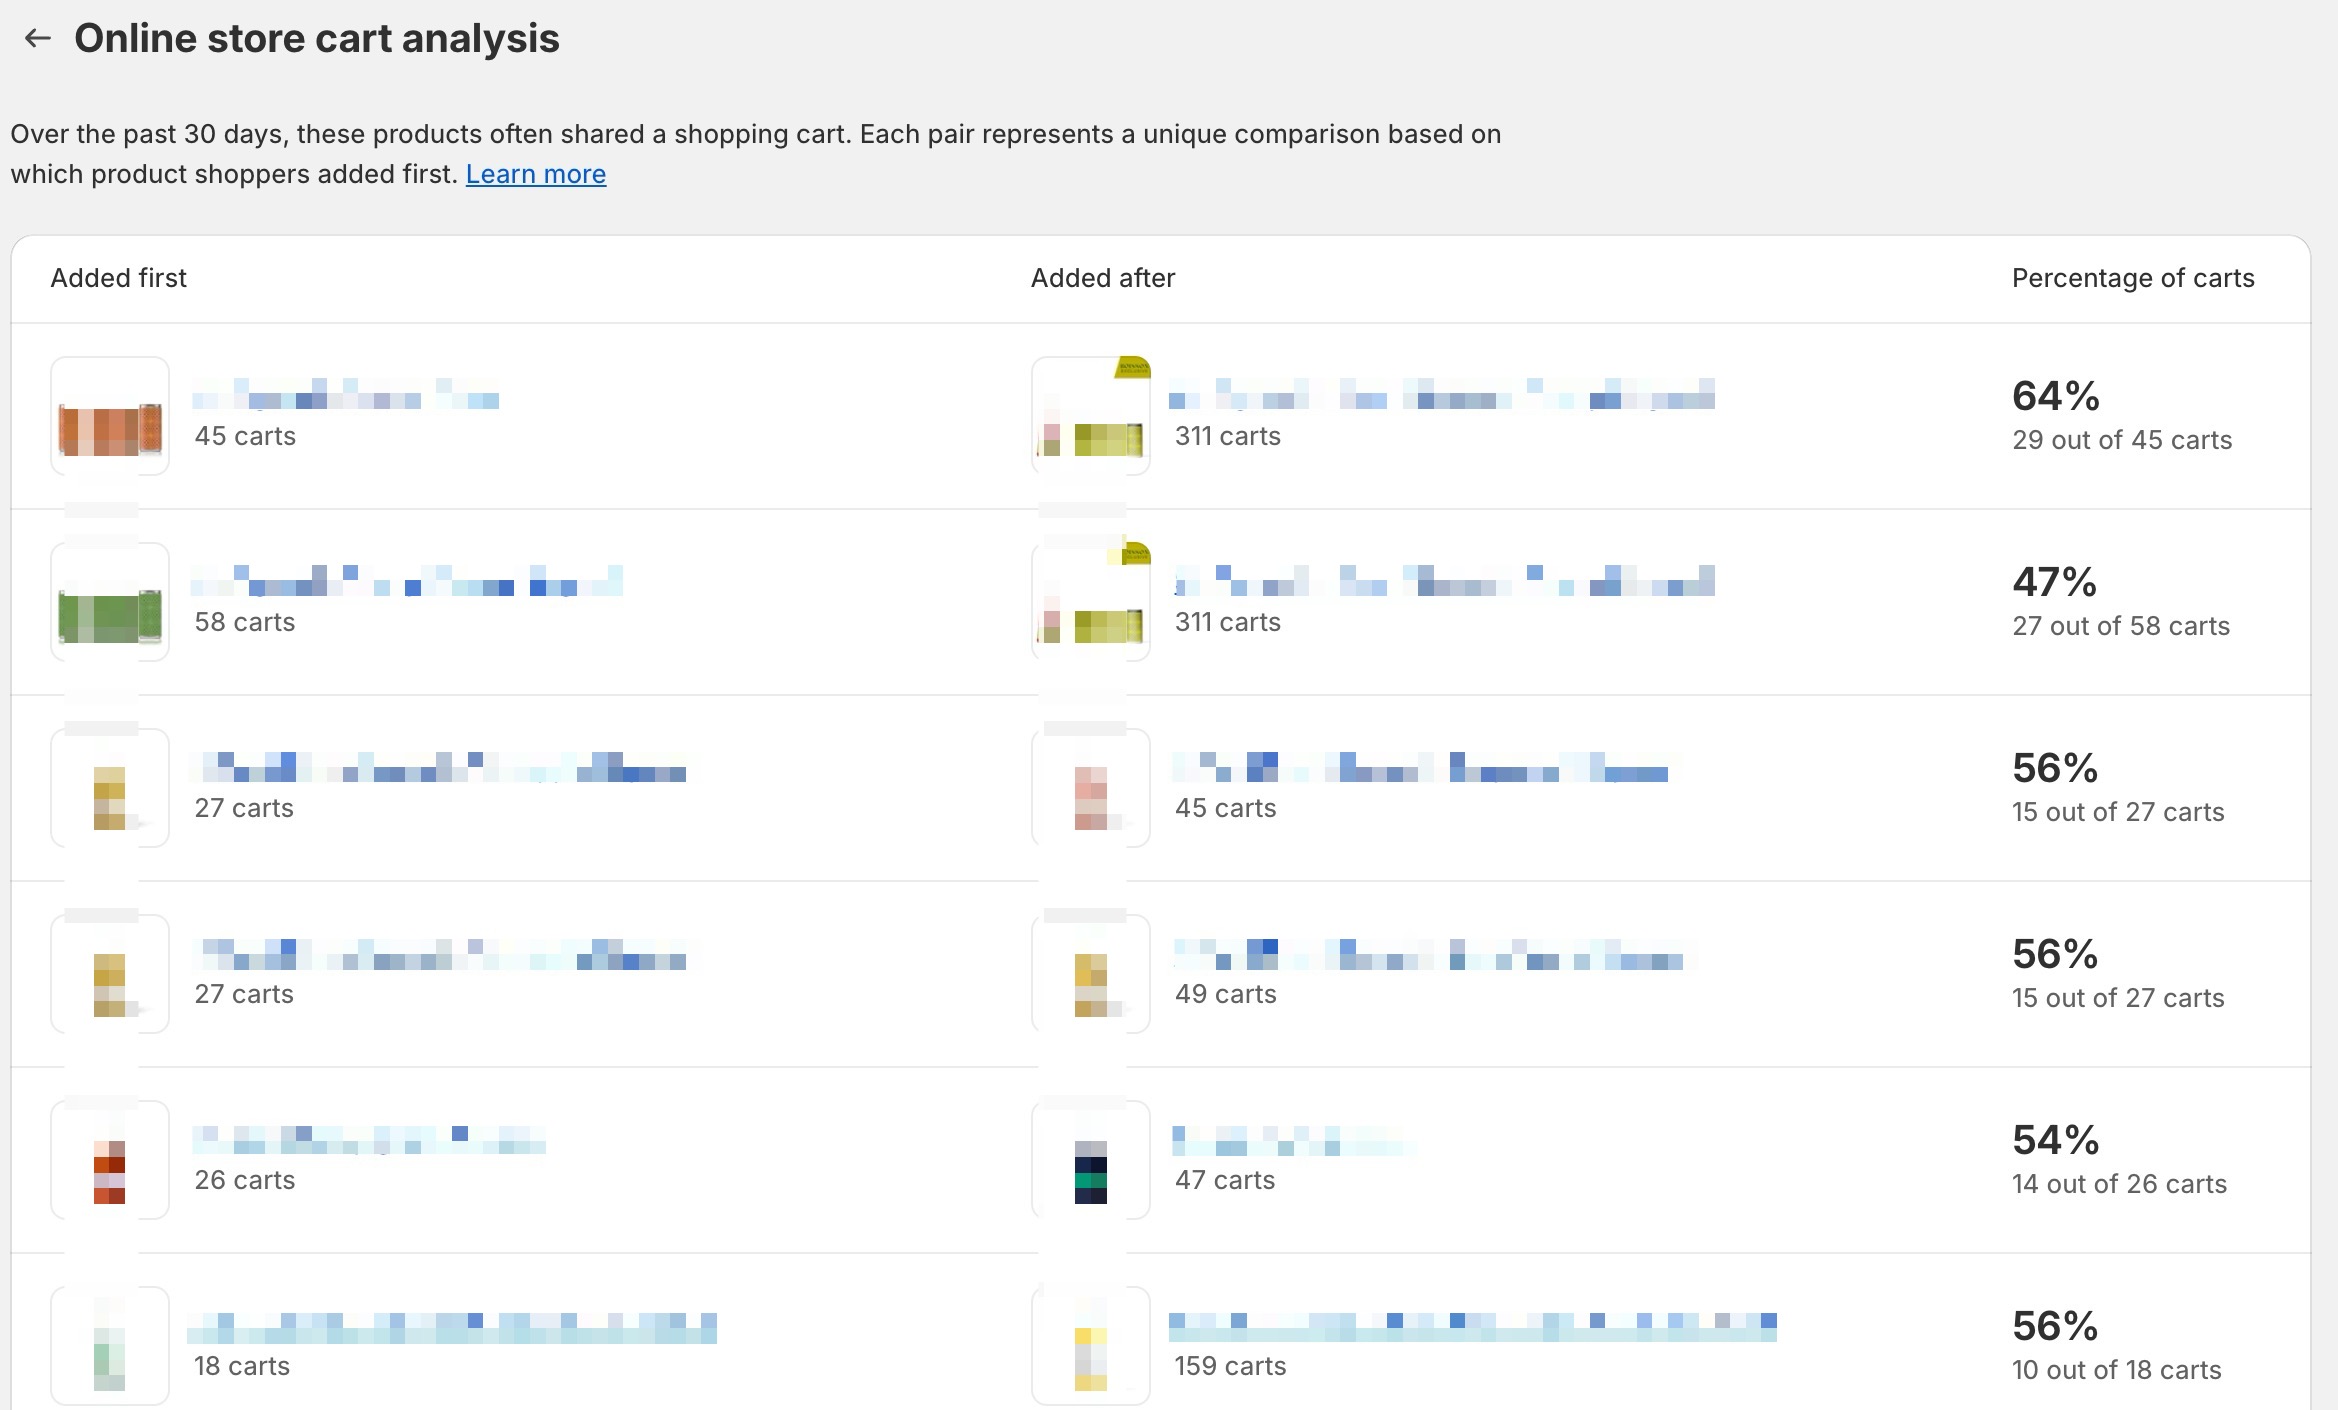 The “Online Store Cart Analysis” provides an in-depth look at customer shopping cart behavior on your online store.
Basically, this report helps you identify what pair of products your customers often add to the same cart in the past 30 days.
It can help you with data-driven decisions on pricing, product bundling, and upselling strategies.
What Questions the Online Store Cart Analysis Report Answers:
- What pair of products have the highest add-to-cart percentage?
- Which products are most frequently added to the cart first?
- What impact do promotions and discounts have on add-to-cart rates?
- Which products are most commonly added to the cart after a specific product?
And more.
How to See This Report:
Navigate to Analytics > Reports > Online store cart analysis (under the category of Behaviour)
Top Online Store Searches with No Clicks
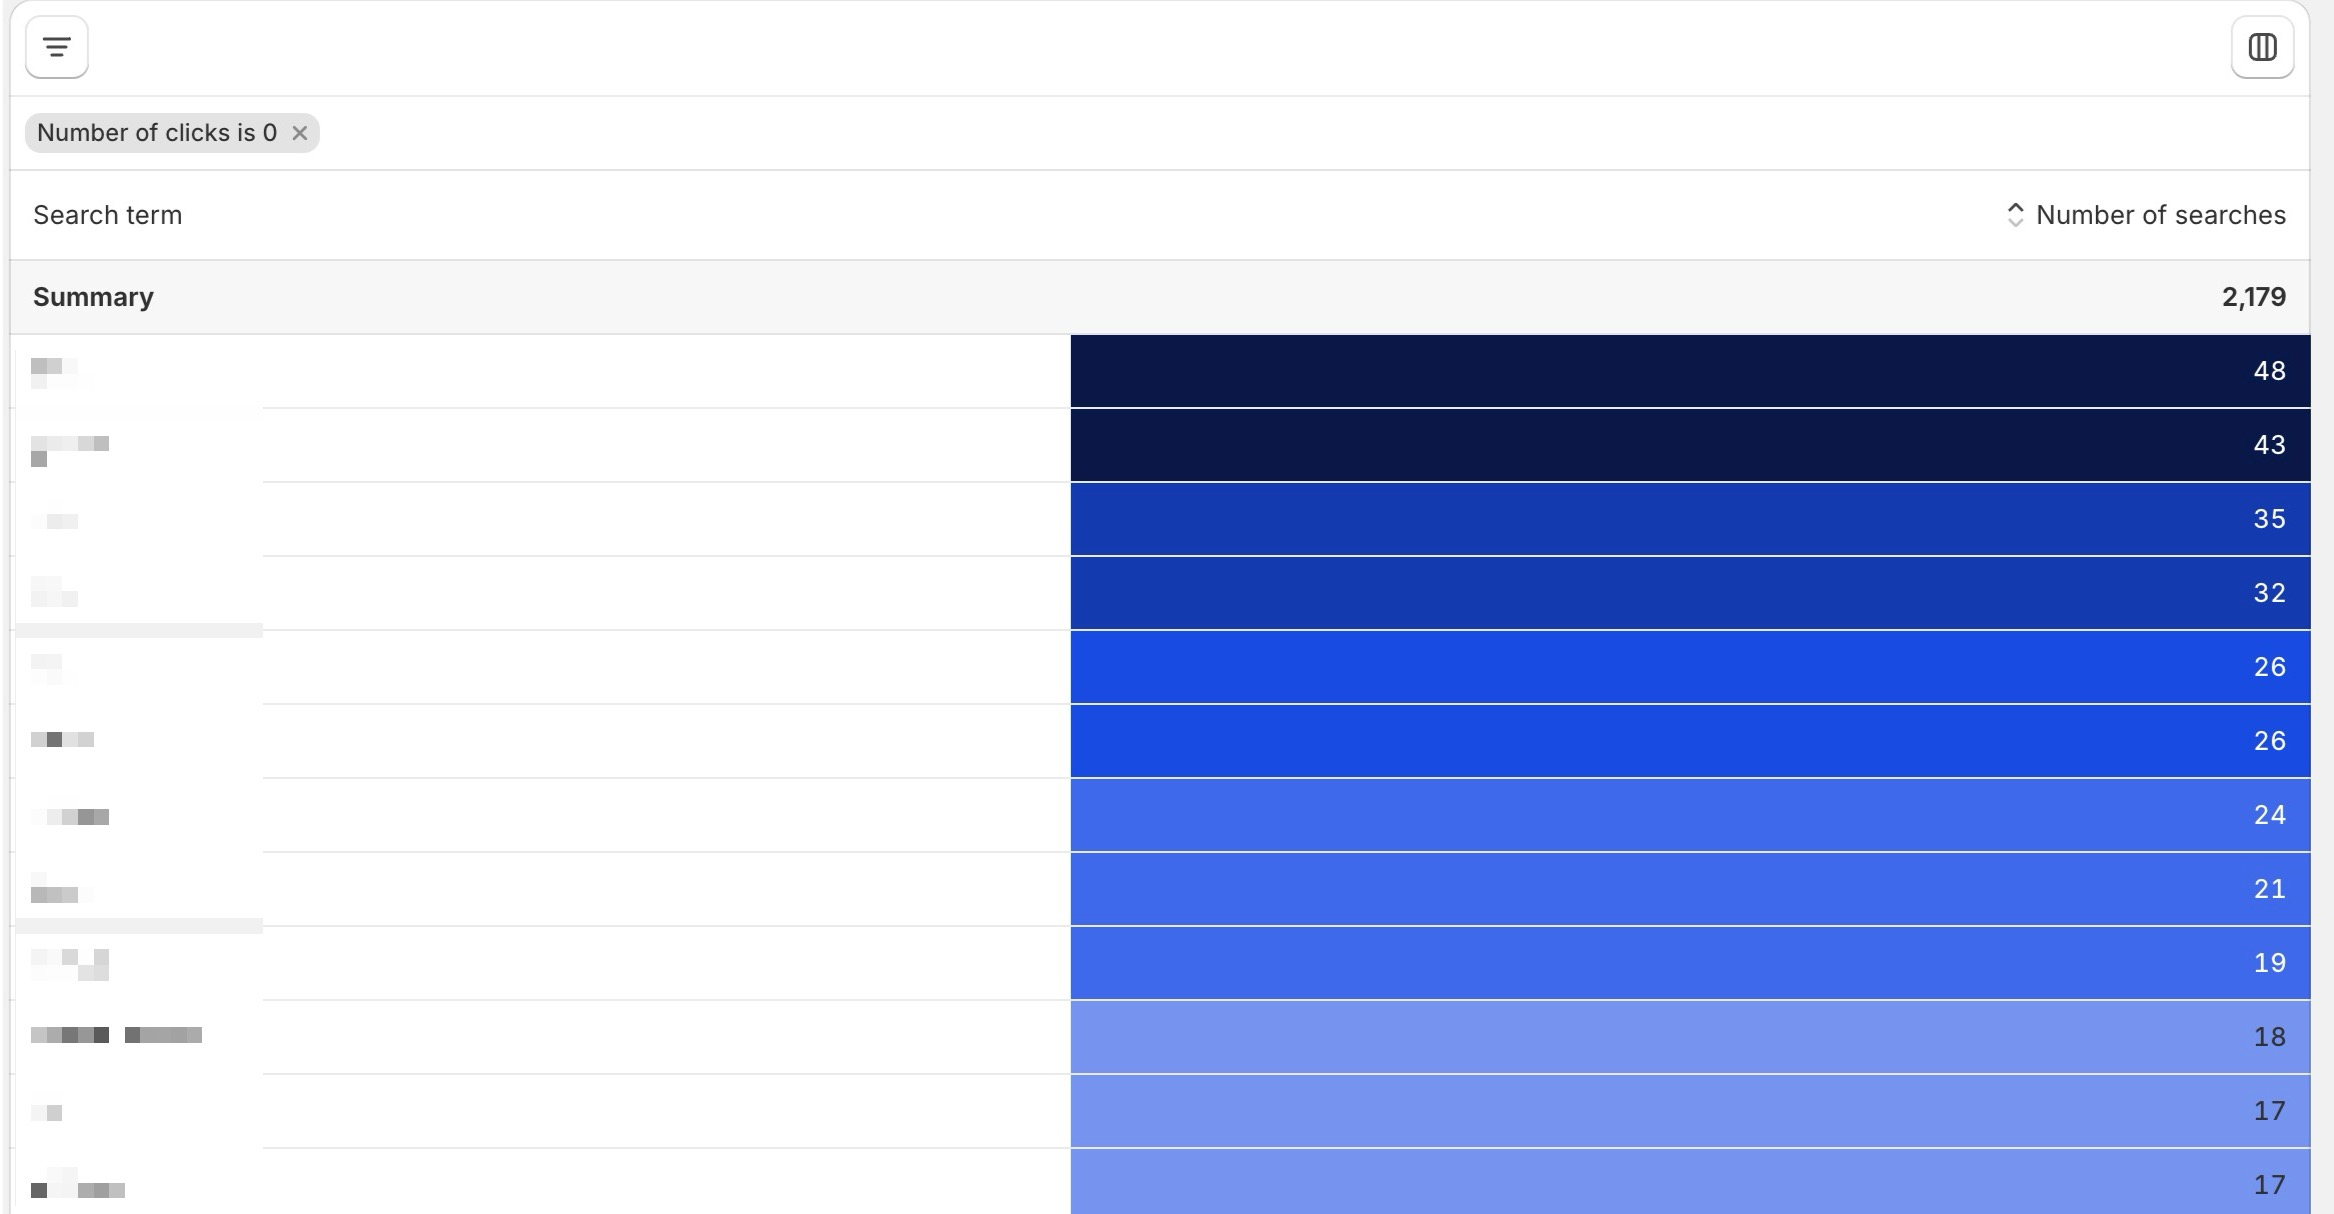
The “Top online store searches with no clicks” report in Shopify Analytics offers valuable insights into the search queries entered by visitors on your Shopify store that result in no clicks.
You can use the data provided here to uncover the specific search queries customers use for your products.
Then, you can explore whether refining your product titles and descriptions can streamline their search experience.
What Questions the Top Online Store Searches with No Clicks Report Answers:
- What products are customers looking for that they can’t find?
- Does any specific product need SEO optimizations based on what users are searching for?
- Can there be issues with how search results are displayed or ranked?
- Should I adjust existing product descriptions or tags to better match search queries?
- How did the search terms with no clicks change over time?
And more.
How to See This Report:
Navigate to Analytics > Reports > Top online store searches with no clicks (under the category of Behaviour)
You can customize this report by adding more metrics through the Filter and the Column icons to find more specific answers.
Retail Sales by Product
The “Retail Sales by Product” report displays a detailed breakdown of sales data for each product sold through your retail or physical store channels connected to Shopify POS (Point of Sale).
This report can help you track and analyze the performance of their products in a retail setting, providing insights into which ones are driving sales, trends, etc.
What Questions the Retail Sales by Product Report Answers:
- Which products are the top performers in my retail stores?
- Are there specific products that perform better in a retail environment?
- What inventory levels are needed to support retail sales for a specific product?
- How do seasonal trends affect retail sales of specific products?
- Which products have declining sales in retail stores?
and more.
How to See This Report:
Navigate to Analytics > Reports > Retail sales by product (under the category of Retail sales)
You can customize this report by adding more metrics through the Filter and the Column icons to find more specific answers.
Best Practices for Product Performance Analysis with Shopify Analytics
Shopify Analytics gives you access to a bunch of product-performance-related reports so you can get insights into how your products are performing on your online store.
However, having data is one thing; knowing how to analyze and act on it effectively is another.
Let’s take a look at the best practices for product performance analysis with Shopify Analytics
Setting Clear Goals and KPIs
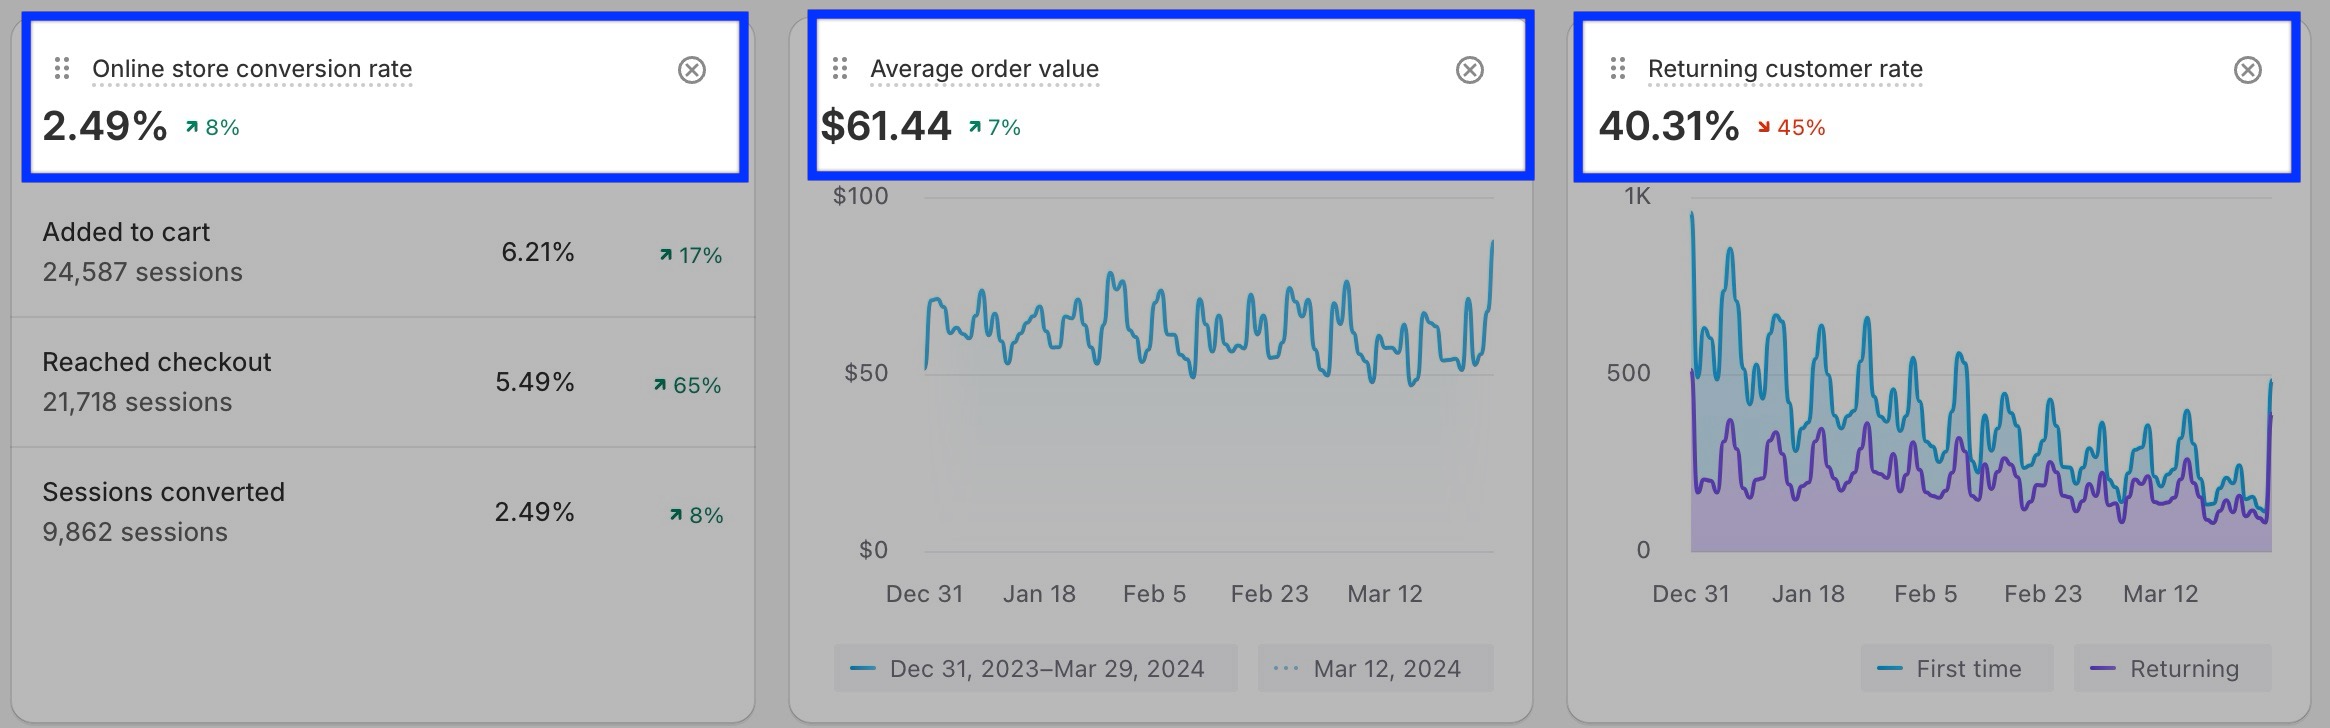 Before diving into data, you should define what success looks like for your store.
First, you should identify the optimum key performance indicators for your products (KPIs) such as conversion rate, average order value, returning customer rate, profit margins etc.
Then, you can set clear goals and KPIs that you aim to reach for your products. This can guide your product performance analysis and help you evaluate the important milestones.
Using the ABC Analysis
 Check out the ABC Analysis by Product report to better manage your inventory.
Here, you can focus on ‘A’ items that contribute most to your revenue, optimize ‘B’ items for better performance, and decide whether to discontinue or come up with different strategies for ‘C’ items.
For ‘A’ items, you make sure:
- The best-sellers are always in stock
- They are prominently featured in your marketing efforts
For ‘B’ items, consider:
- Strategies to enhance their performance
- Targeted promotions or bundling with ‘A’ items to increase their visibility and appeal
For ‘C’ items, make a more critical assessment to:
- decide whether to discontinue them,
- reduce their stock levels, or
- employ different strategies to increase their sales, such as discounting or repositioning in the market
How to Apply:
Let’s say you are running a Shopify store that specializes in fitness equipment.
Your ABC Analysis might reveal that high-end treadmills (A items) account for 70% of your revenue despite being only 10% of your inventory.
Resistance bands (B items) contribute 20% of revenue and represent 40% of your stock, while small accessories like gym towels (C items) make up the remaining 10% of revenue and half of your inventory.
With these insights, here are the actions you can consider taking:
-
- Increase your investment in marketing for the high-end treadmills, showcasing them in your most prominent sales channels.
- For resistance bands, you create bundle deals with popular workout equipment, improving their visibility and sales potential.
- For gym towels and other C items, you evaluate whether to continue stocking them in large quantities or use them as promotional gifts to incentivize purchases of A and B items.
This way, you optimize your inventory based on performance and strategic value.
Identifying Your Best-Selling Products
Shopify Analytics reports let you pinpoint which products are your best sellers easily.
By focusing on these products, you can manage your resources more effectively—be it through inventory management, marketing efforts, or further product development—to maximize profits and customer satisfaction.
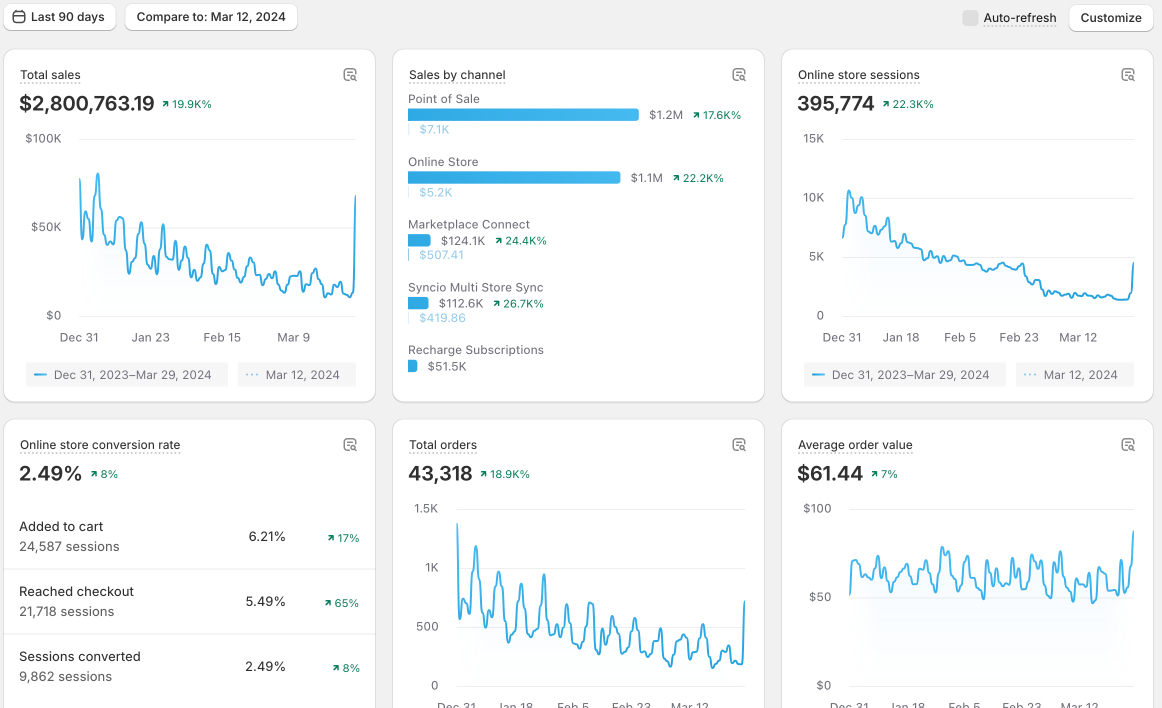
You can see a quick overview of your “Top-selling products” on your Analytics in a card view, with a comparison of a given time.
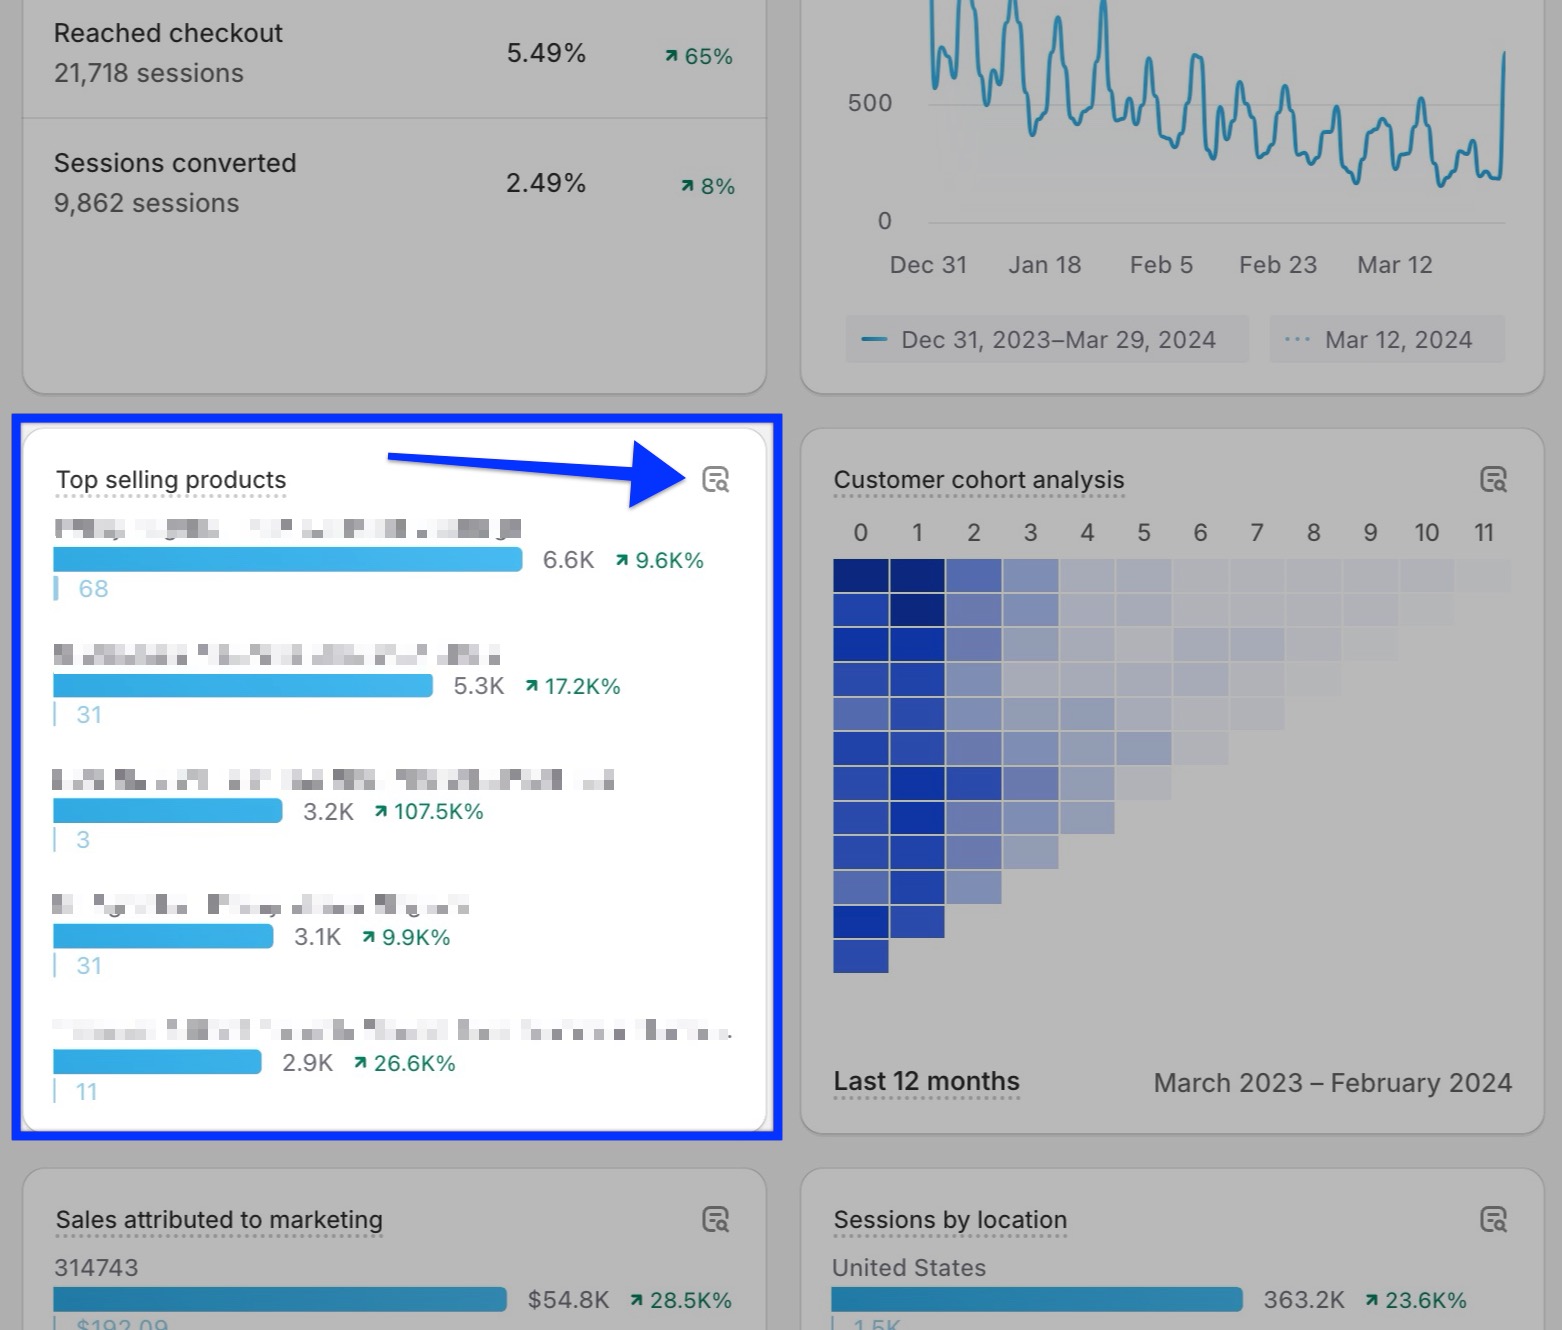 If you want to see a more detailed view of your best-selling products, you can go ahead and click the “View report” icon. This will lead you to the “Sales by product” report.
How to Apply:
Let’s focus on a Shopify store that sells eco-friendly home goods in this case.
After reviewing your reports, you discover that your best-selling products are bamboo toothbrushes and biodegradable cleaning sponges.
These items significantly outperform other products in their catalog, both in terms of quantity sold and revenue generated.
Then, you may decide to increase its stock levels for these items to ensure you can meet customer demand without risking stockouts, especially during peak shopping seasons.
Additionally, you can launch a targeted marketing campaign around eco-friendly best sellers, using social media ads and email marketing to highlight the environmental benefits of these products.
You can also consider expanding your range of eco-friendly products, given the clear customer interest in sustainable goods.
To further capitalize on the success of the high-end mills, you can introduce some bundle deals and promote them as ideal gifts for environmentally conscious consumers.
By concentrating your efforts on these best-selling products, you not only boost your sales and revenue but also strengthen your brand identity.
Utilizing the Profit by Product Report
 This report breaks down the profitability of each product or variant in your catalog by comparing the revenue they generate against the costs associated with selling them, including the cost of goods sold (COGS).
By understanding which products offer the highest and lowest margins, you can make strategic decisions about pricing, promotion, and inventory management to maximize your store’s overall profitability.
Analyzing profit margins at the product level helps you identify not just top sellers by volume, but those that actually contribute most significantly to your bottom line.
It can provide you with a strategic approach to inventory, focusing efforts and resources on items that offer the best return on investment.
How to Apply:
Imagine you run a Shopify store specializing in handmade candles.
By reviewing your Profit by Product report, you discover that while your seasonal scents are popular and sell quickly, your margin on these is lower than expected due to higher production costs and seasonal promotions.
Conversely, your classic scents, though selling at a steadier, slower pace, have a much higher profit margin due to lower costs and consistent year-round demand.
With that in mind, for upcoming seasons, you can plan to slightly increase the price of your seasonal scents to improve margins, while also launching a targeted marketing campaign for your classic scents to boost their sales volume.
Additionally, you explore ways to reduce production costs for your seasonal candles without compromising quality.
Furthermore, recognizing the high profitability of your classic line, you can expand this range with new scents, benefitting from their steady demand and high margin.
This strategic adjustment, informed by the Profit by Product report, not only aims to increase your revenue but also ensures a healthier profit margin across your product range.
Limitations of Product Performance Analysis with Shopify Analytics
Shopify Analytics offers a wealth of basic information that you may need to check out in your day-to-day product performance tracking.
However, integrating your Shopify store with Google Analytics can help you with a deeper & more insightful product performance analysis.
Also, you can start using Google Analytics 4 for your Shopify store with Shopify Google Analytics apps easily. You get product performance analysis, along with customer behavior, custom funnels, etc.
Let’s take a look at some of the limitations of product performance analysis with Shopify Analytics:
Advanced Customizations
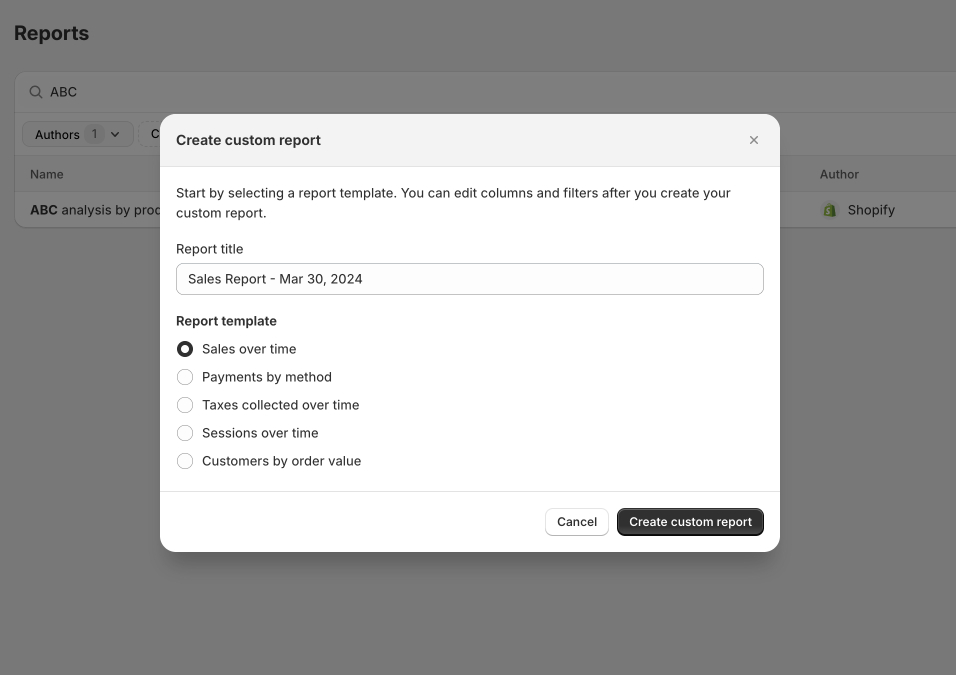 Shopify Analytics lacks the flexibility to deeply customize reports or create complex, tailored analytics.
Therefore, it’s challenging to adjust the metrics, combine data in unique ways, or explore in-depth analyses that require more than the predefined report templates offer.
This can be particularly noticeable if you have specific reporting needs or look to drill down into highly granular product data insights beyond the scope of Shopify’s built-in analytics capabilities.
Sales Funnel Analysis
Shopify Analytics offers many built-in reports, as previously mentioned.
However, Shopify Analytics doesn’t offer a decent level of detail and flexibility in analyzing sales funnels.
Sales funnels are important for understanding the customer journey from initial engagement through to purchase, highlighting where potential customers drop off and identifying opportunities for optimization.
In Shopify Analytics, the insights into the customer journey are somewhat basic and linear, focusing on key stages like visits, cart additions, checkouts, and purchases.
While useful, this doesn’t allow for a detailed analysis of customer behavior across various touchpoints and paths that can lead to a sale, which is where GA4 excels.
Data Visualization Options
Shopify Analytics provides a straightforward and user-friendly interface for accessing and interpreting your store’s data.
However, one of its limitations is the limited range of data visualization options.
 While you get essential charts and graphs to represent sales trends, best-selling products, and other key metrics, the platform lacks the depth and customization options that GA4 provides.
For instance, Google Analytics 4 allows for the creation of complex graphs, heat maps, custom dashboards, and interactive reports that can offer deeper insights into data patterns and trends.
These types of visualizations can be crucial for identifying correlations, anomalies, or insights that standard charts may not reveal as effectively.
Granularity of Data
While Shopify Analytics offers a good overview of sales and performance metrics, it may lack the granularity needed for an in-depth product analysis.
For example, you can get insights into which products are selling well. Here, you may need more detailed data based on custom ecommerce parameters, though.
In this case, you may struggle to pinpoint the exact performance variations at specific times or in response to specific marketing campaigns.
Using Google Analytics 4 (GA4) for Shopify Product Performance Analysis
Google Analytics excels in providing a granular view of user behavior across your Shopify store.
It tracks detailed user interactions, from the first point of contact with your brand across any channel, through to conversion and beyond.
This holistic view includes how users arrive at your site, the paths they take through it, and what actions they perform along the way to find the product of their choice.
More importantly, if you want to create Shopify ecommerce funnels to understand the full customer journey—including pre- and post-purchase behavior—Google Analytics stands out as your go-to solution.
For example, you can create a custom funnel to analyze customer journey on product level by adding the many ecommerce metrics:
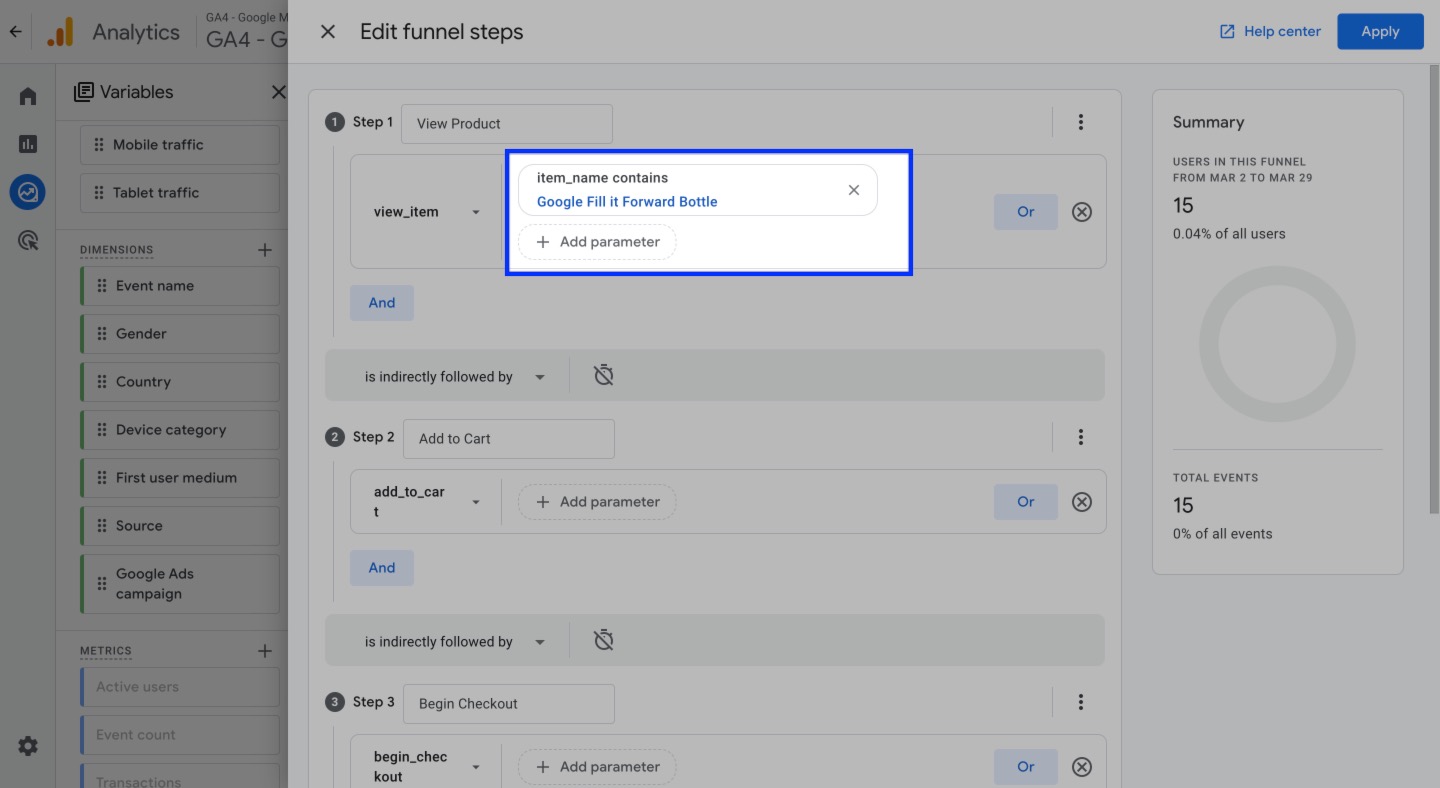
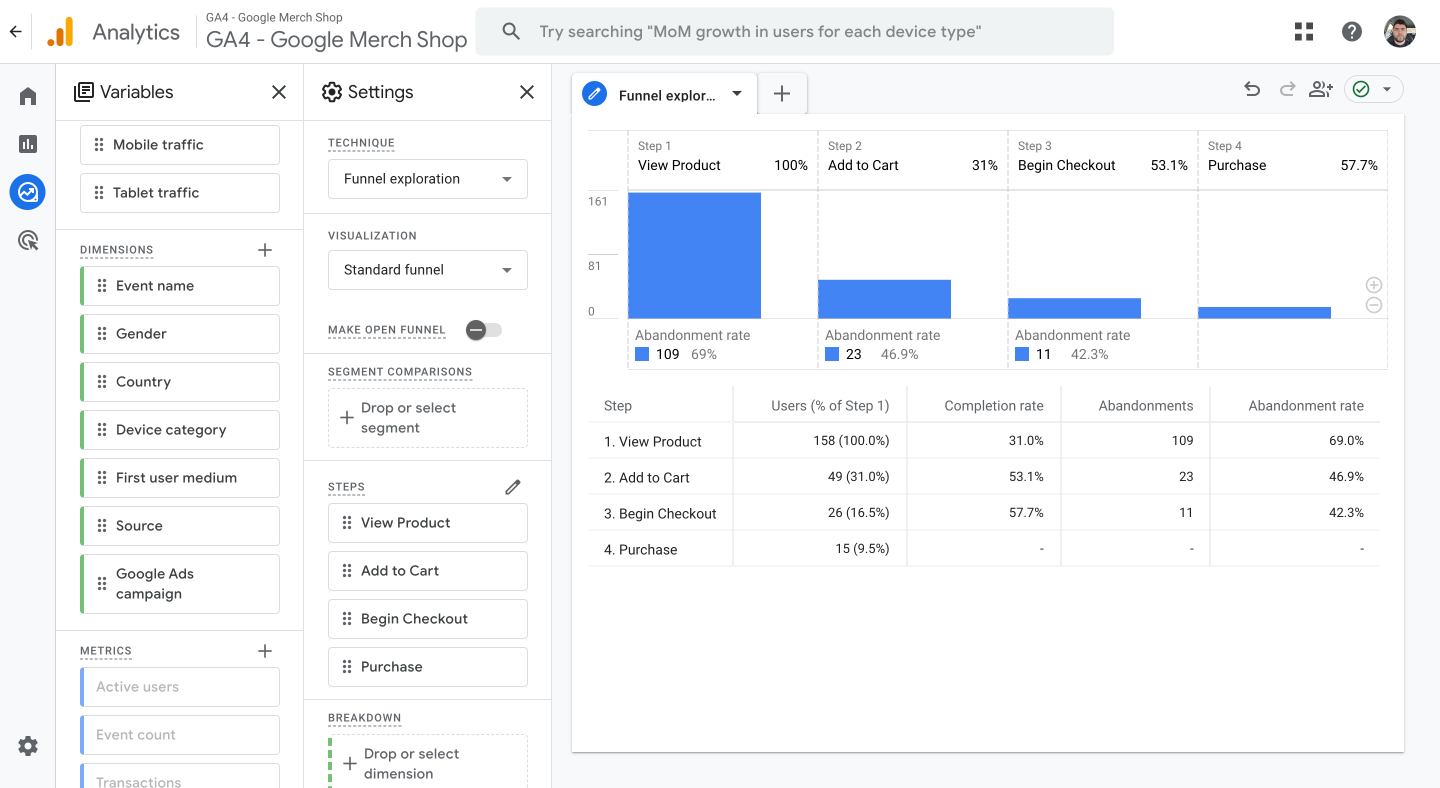 You can add parameters such as “item_name” to create product-specific ecommerce funnels:
 In addition, Google Analytics’ advanced segmentation, custom reporting, and integration with other Google services like Google Ads and Search Console provide a level of depth and customization that is particularly useful for more meaningful analysis.
For example, you can create custom segments to track the behavior of specific user groups for specific products, or use multi-channel funnels to see how different marketing channels contribute to conversions over time.
These capabilities allow for a detailed analysis of product performance in the context of broader marketing efforts and user interactions, offering strategic insights that can help refine targeting, optimize marketing spends, and improve overall site performance.
In summary, while Shopify Analytics is useful for day-to-day ecommerce tracking and operational insights, Google Analytics extends the scope of analysis to a wider digital landscape.
Frequently Asked Questions: Product Performance Analysis with Shopify Analytics
Here are the most frequently asked questions & their answers about product performance analysis with Shopify Analytics:
What product reports can I get from Shopify?
Shopify provides several product-related reports, including “Sales by product” and “Profit by Product”. Please refer to the first section of our article for more product-related reports.
Are Shopify product performance reports available to all Shopify plans?
Yes, every Shopify plan provides standard reports to track product performance. Custom reports and analytics are only available to Shopify Advanced and Shopify Pro plans. You can see the details here.
How can I identify my best-selling products on Shopify?
You can use the “Sales by product” report in Shopify Analytics to see which products are selling the most based on quantity and revenue over a selected time period.
What metrics should I focus on to improve product performance?
Key metrics include total sales, conversion rate, average order value (AOV), cart abandonment rate, profit margin, and customer lifetime value (CLV).
Can I track the profitability of individual products in Shopify?
Yes, by utilizing the “Profit by Product” report, you can analyze each product’s profitability by comparing its sales revenue to the cost of goods sold (COGS).
How do I track product returns and their impact on sales?
The “Returns” and “Product orders and returns” reports within Shopify Analytics allow you to monitor return rates and their financial impact on your business.
Is Shopify Analytics or Google Analytics 4 better for product performance analysis?
Shopify Analytics provides essential insights into sales, products, and customer behavior directly within the Shopify environment, making it highly accessible for day-to-day business operations.
Google Analytics 4 (GA4), on the other hand, offers more advanced and customizable tracking capabilities, including detailed user behavior analysis, cross-platform tracking, and complex funnel visualization.
GA4 can complement Shopify Analytics by providing deeper insights into the customer journey, especially if you want to analyze multi-channel marketing efforts and detailed interaction patterns.