
Tracking Google Ads ecommerce reports daily helps you spot issues early and take immediate action.
This allows you to improve efficiency, drive higher sales, and reduce wasted ad spend.

Before starting out, let’s take a quick look at the reports that need to be tracked in ecommerce businesses and their main functions:
| Report Type | Main Function |
| Shopping Campaign Performance Report | Provides an overview of product listings' performance in Google Shopping. |
| Product Performance Report | Breaks down the performance of individual products in Shopping campaigns. |
| Search Terms Report | Shows the actual search queries that triggered your ads for better keyword targeting. |
| Audience Report | Offers insights into how different user segments interact with your ads. |
| Device Performance Report | Tracks ad performance across different devices (mobile, desktop, etc.). |
| Geographic Performance Report | Displays how ads perform in various geographic locations. |
| Time of Day and Day of Week Report | Analyzes ad performance by time of day and day of the week. |
| Auction Insights Report | Compares your ads’ performance against other advertisers. |
| Placement Analysis Report | Provides data on where your ads appear on the Google Display Network and YouTube. |
Key Google Ads Ecommerce Reports You Should Track Daily
Here are the key Google Ads ecommerce reports and the metrics you should track daily to keep your campaigns performing at their best:
Shopping Campaign Performance Report
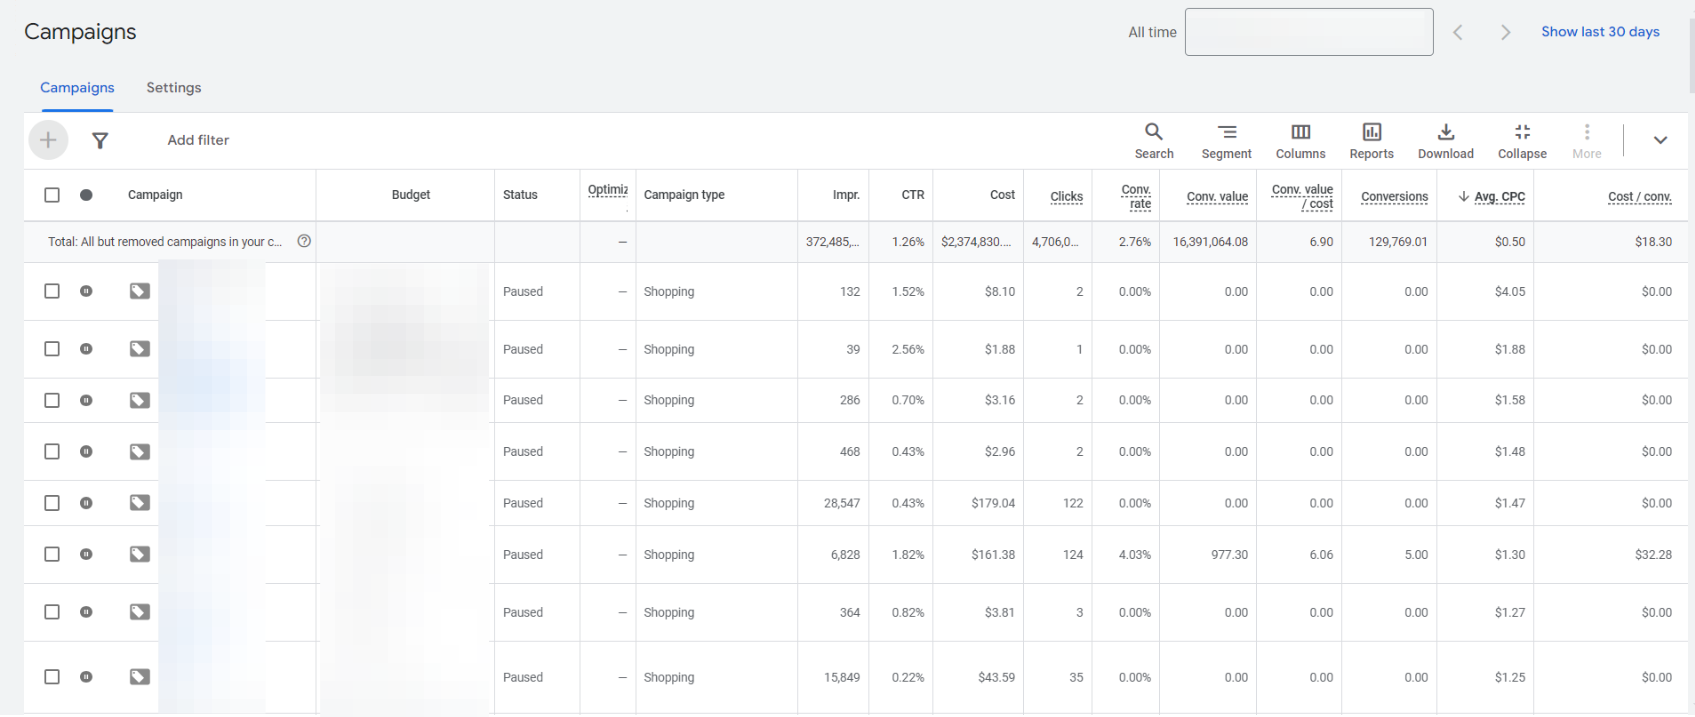
The Shopping Campaign Performance Report provides an overview of how your product listings are performing in Google Shopping.
For ecommerce businesses, this report is important because it shows how well your products are being displayed and clicked on in Google’s shopping results.
It helps you understand which products are selling and how profitable your campaigns are.
How to access:
Click on “Campaigns” in the left-hand menu
Filter for Shopping campaigns
You’ll see an overview of your Shopping campaign performance
What to look for:
- Revenue and ROAS (Return on Ad Spend)
- Top-performing products
- Underperforming products that may need optimization
Daily metrics to track:
- Daily revenue
- Daily ROAS
- Impressions and clicks
- Conversion rate
- Cost per conversion
Pro tip: Set up daily budget alerts to ensure you’re not overspending on underperforming campaigns.
Tracking your Shopping campaigns is essential for understanding product performance and getting the best results. To generate accurate reports, you need a solid Shopify and Google Ads integration with proper configurations and conversion tracking.
“Incomplete tracking setups and misconfigured conversions can prevent you from tracking your reports with maximum performance.”
With Analyzify, you can:
- Feed Google Ads with accurate data
- Track and report on your conversions
- Enrich Google Ads algorithms with additional data
- Leverage Enhanced Conversions
- Implement dynamic remarketing
- Get expert audits and support
Don’t let poor tracking hold you back. Get started with Analyzify today and unlock the full potential of your campaigns!
Product Performance Report
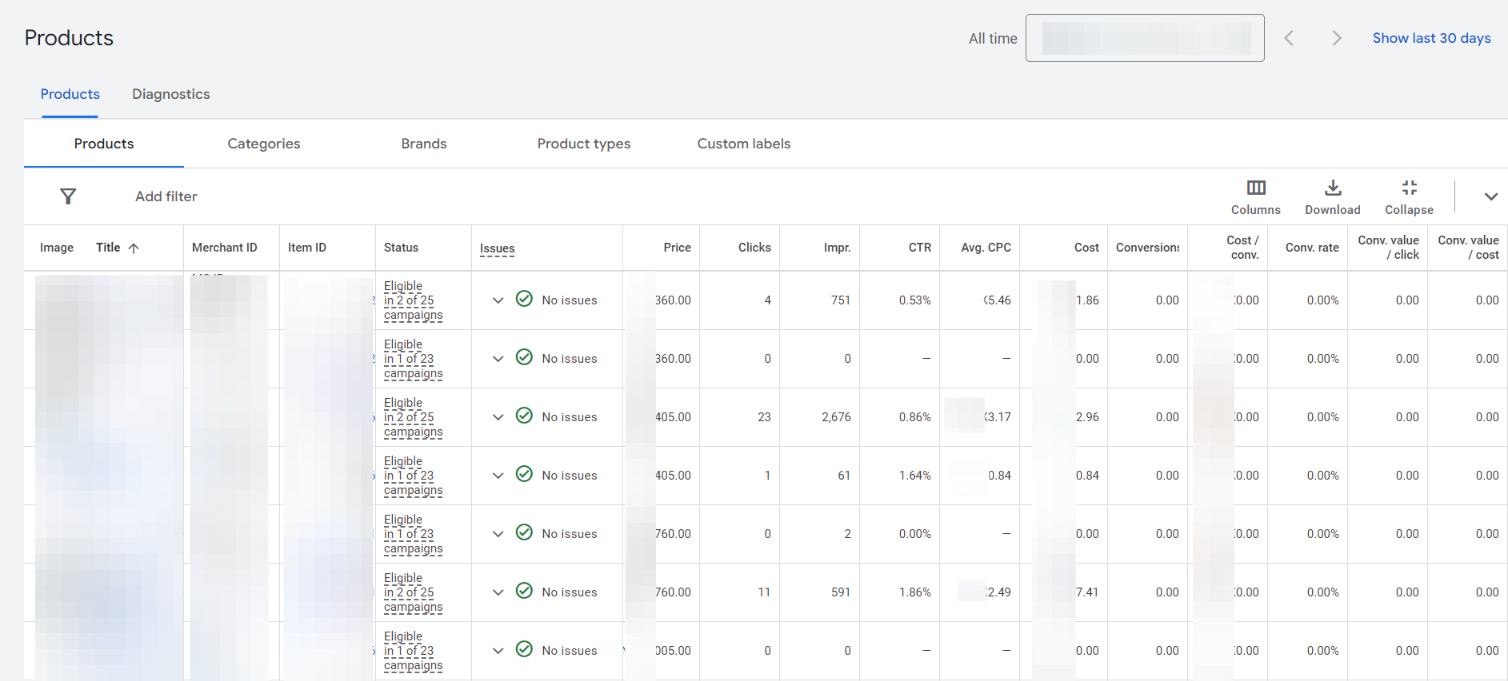
The Product Performance Report breaks down the performance of individual products within your Shopping campaigns.
It’s essential for online retailers to understand which products are bestsellers and which ones are under performing as it helps to make informed decisions about product promotion, pricing, and inventory management.
For more details on product performance reports for ecommerce, be sure to check out the Product Performance Analysis in Google Ads post, which offers valuable insights and step-by-step guides to accessing key metrics.
How to access:
Go to “Products” in the left-hand menu
You’ll see a breakdown of performance by individual products
What to look for:
- Best-selling products
- Products with high click rates but low conversions
- Products with negative ROAS
Daily metrics to track:
- Top 5 products by revenue
- Bottom 5 products by ROAS
- Products with significant changes in CTR or conversion rate
Pro tip: Create a daily watchlist of products that are trending up or down in performance to spot issues or opportunities quickly.
Search Terms Report

The Search Terms Report reveals the actual search queries that triggered your ads, providing insights into customer behavior.
This report is one of the key Google Ads reports for ecommerce, as it helps identify negative keywords to exclude and better understand customer language when searching for your products.
How to access:
Go to “Insights and Reports” in the left-hand menu
Click on “Search Terms”
What to look for:
- High-converting search terms to add as keywords
- Terms indicating customer pain points or specific product features Irrelevant terms to add as negative keywords
Daily metrics to track:
- New search terms with high impressions
- Search terms with conversions but not yet added as keywords
- Terms with high spend but no conversions
Pro tip: Set up an automated rule to pause keywords that are spending above a certain threshold without conversions.
Audience Report

The Audience Report provides insights into how different groups of users interact with your ads.
Understanding your audience is key for any online store. It helps you identify which types of customers are most likely to buy from you, allowing you to tailor your ads and bids to reach these high-value audiences more effectively.
How to access:
Click on “Audiences, keywords and content” in the left-hand menu
Navigate to “Audiences”
Then click on the “Audiences”. You’ll see a breakdown of performance by audience type
What to look for:
- High-performing audience segments
- In-market audiences relevant to your products
- Remarketing list performance
Daily metrics to track:
- Conversion rates by audience
- ROAS for each audience segment
- Click-through rates for different audience types
Pro tip: Monitor the performance of newly added audiences daily for the first week to ensure they’re meeting performance goals.
Device Performance Report
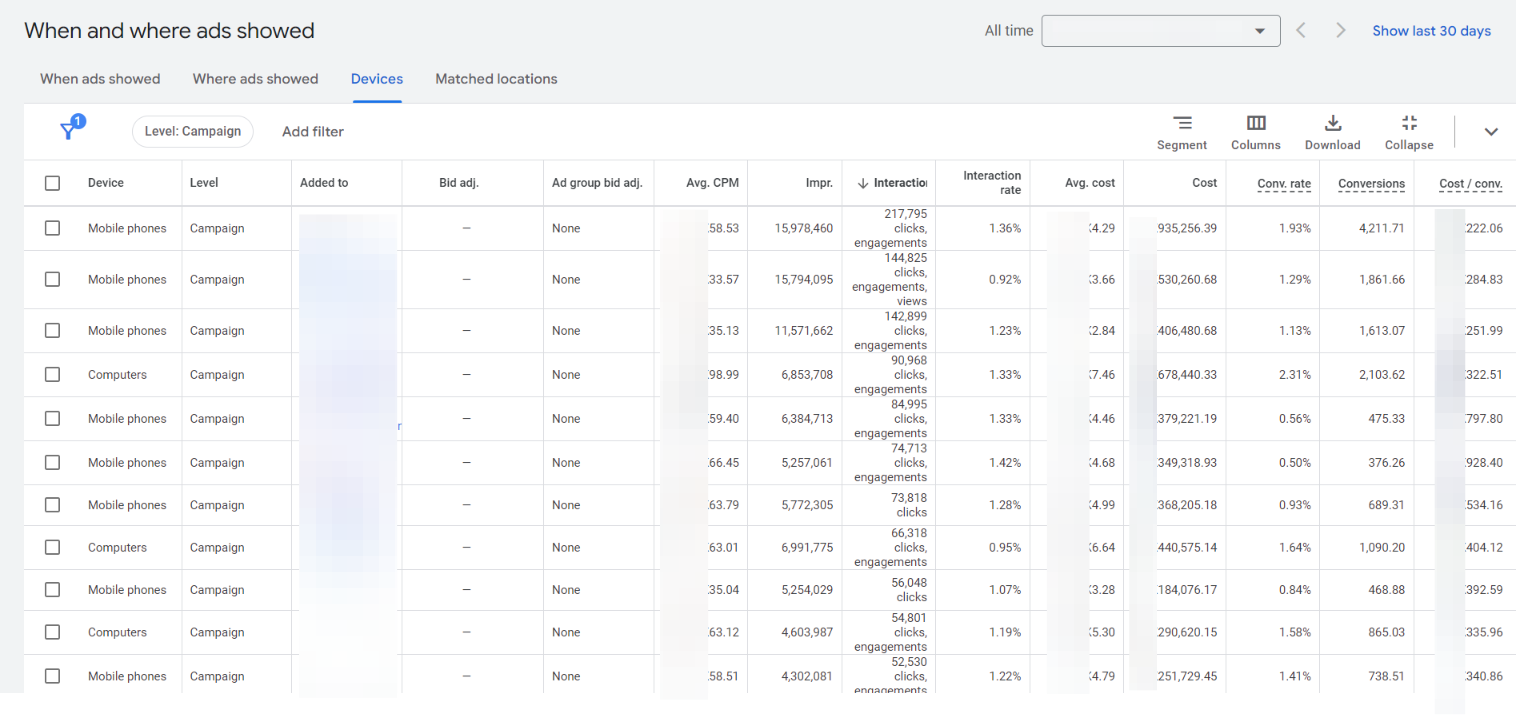
The Device Performance Report shows how your ads perform across different devices.
With the rise of mobile shopping, this report is a must-have in your Google Ads ecommerce reports for daily track to optimize your campaigns and ensure a seamless shopping experience across all platforms.
How to access:
- Navigate to Insights & Reports, then click on “ When & Where Ads Showed”
- Click on “Devices” on the top menu
- You’ll see a breakdown of performance by device type
What to look for:
- Conversion rates and ROAS by device
- Average order value differences between devices
Daily metrics to track:
- Mobile vs. desktop conversion rates
- ROAS by device type
- Average order value by device
Pro tip: If you notice a sudden drop in mobile performance, immediately check your mobile site for any technical issues.
Geographic Performance Report
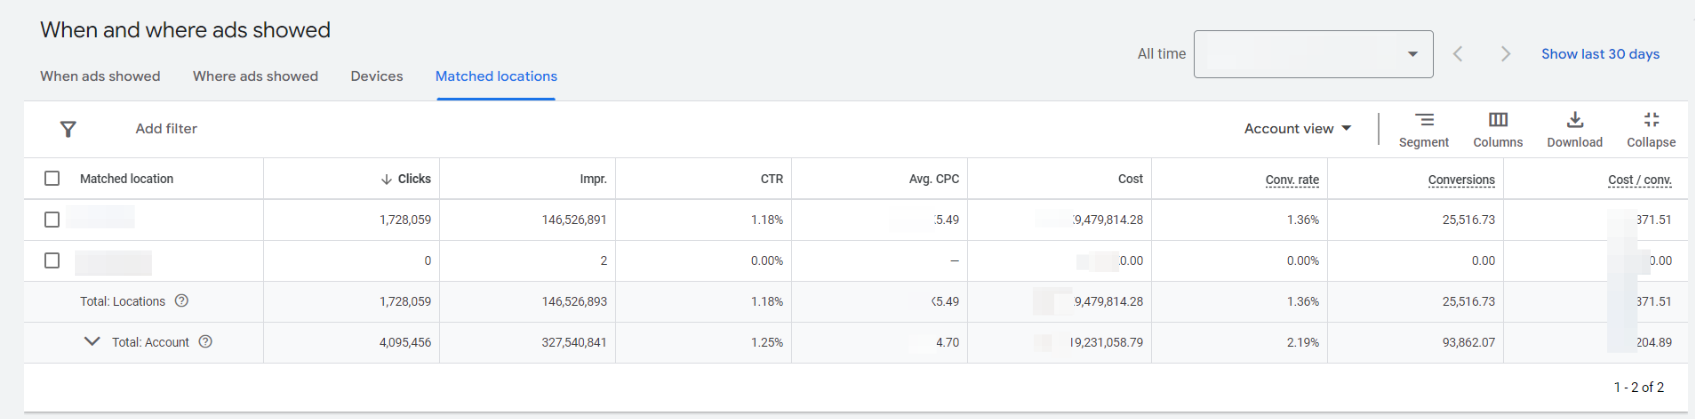
The Geographic Performance Report shows how your ads perform in different locations.
For online stores, especially those that ship to multiple areas, understanding geographic performance is key for identifying best-performing locations, adjusting bids for high-value areas, and potentially expanding into new markets.
How to access:
Navigate to Insights & Reports, then click on “ When & Where Ads Showed”
Click on “Matched Locations” in the left-hand menu
You’ll see a breakdown of performance by geographic area
What to look for:
- Top-performing locations
- Areas with high traffic but low conversions
- Regions that might benefit from localized ad copy or promotions
Daily metrics to track:
- Top 5 locations by revenue
- Bottom 5 locations by conversion rate
- Any locations with significant day-over-day changes in performance
Pro tip: Set up alerts for any unusual spikes or drops in regional performance, which could indicate local events or issues affecting your ads.
Time of Day and Day of Week Report
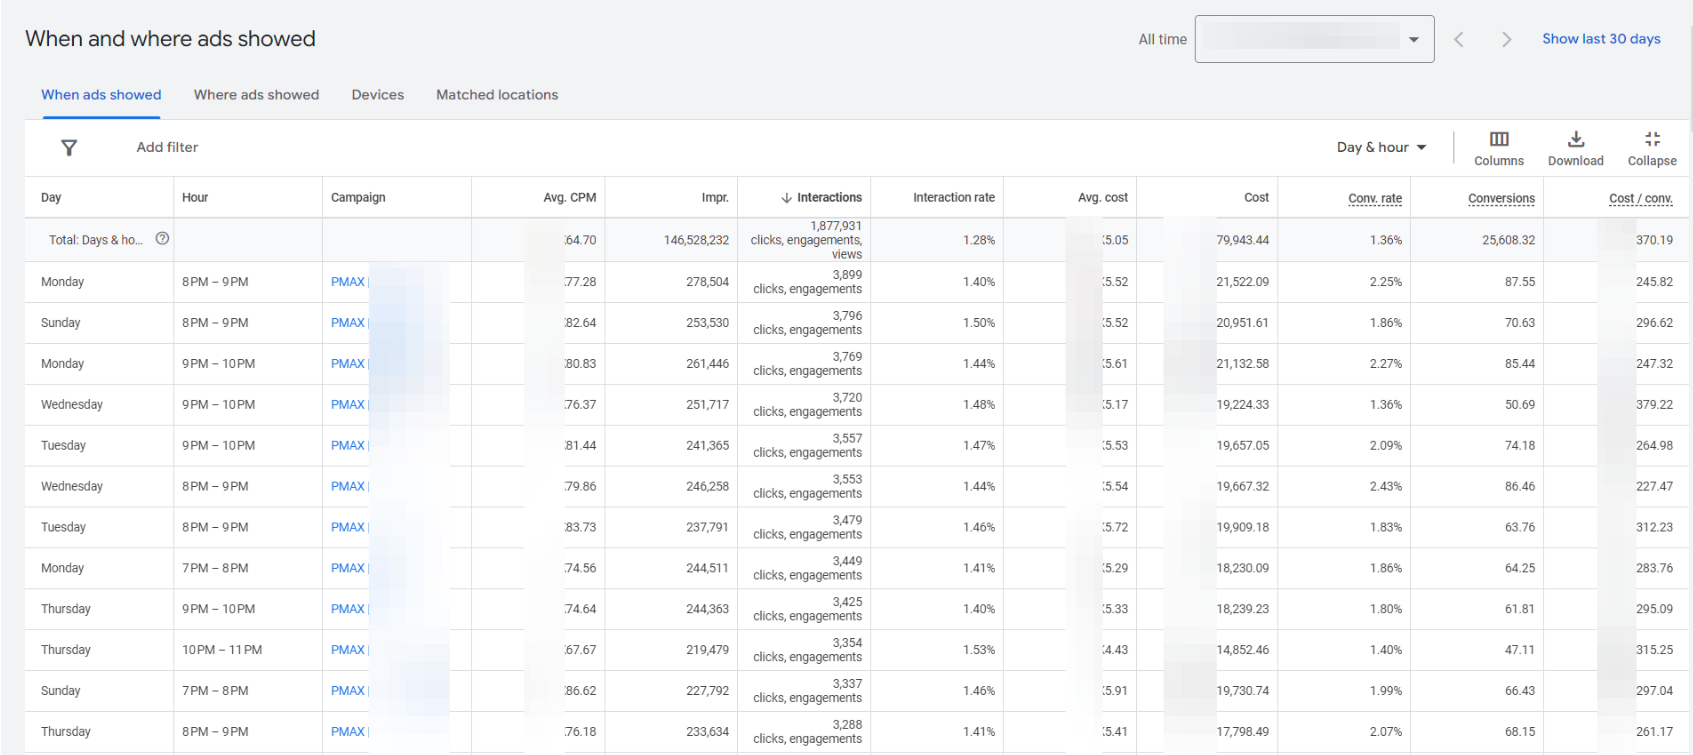
The Time of Day and Day of Week Report is essential for tracking how your ads perform at different times.
Adjusting your ad schedule based on these insights can help maximize your Google Ads ecommerce reports for daily track by showing ads during peak conversion times.
How to access:
Navigate to Insights & Reports, then click on “ When & Where Ads Showed”
Click on “When Ads Showed” in the top menu
You’ll see a breakdown of performance by day and hour
What to look for:
- Peak conversion times
- Days or hours with the best ROAS
- Periods with high traffic but low conversions
Daily metrics to track:
- Hourly conversion rates
- ROAS by day of the week
- Traffic vs. conversion rate correlation
Pro tip: Look for patterns in daily performance and consider adjusting your ad schedule weekly based on these insights.
Auction Insights Report
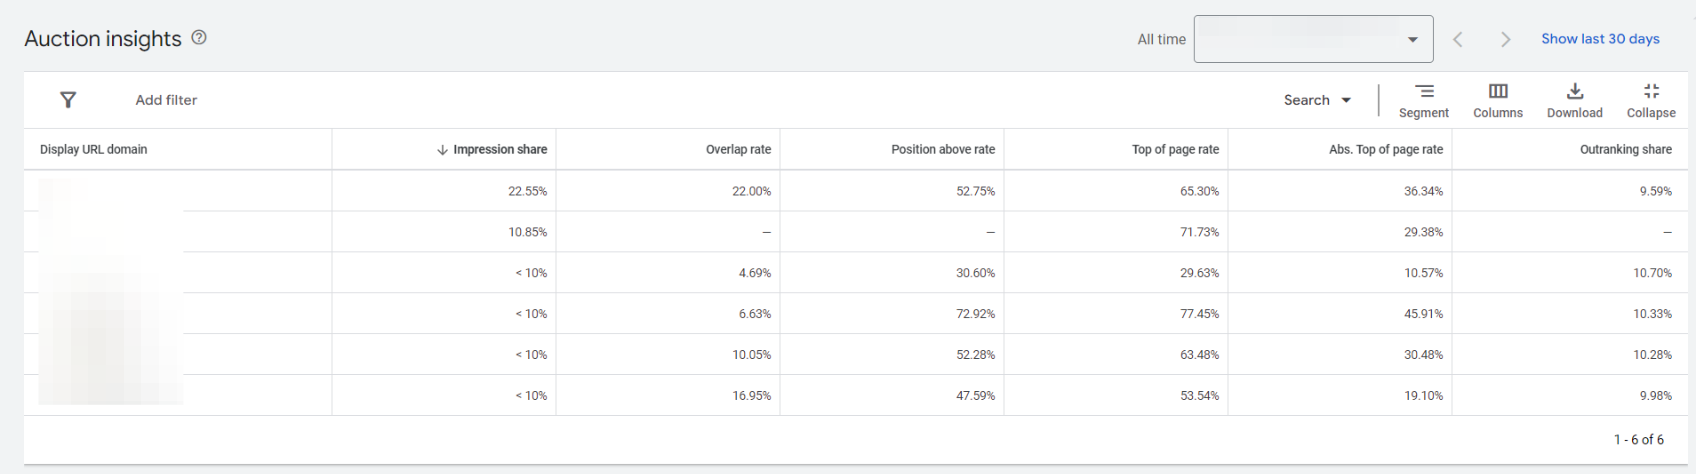
The Auction Insights Report, also known as Competitive Metrics, shows how your ads perform compared to other advertisers.
In the competitive world of online retail, this report helps you gauge your market position, identify when competitors are becoming more aggressive, and make informed decisions about when to adjust your own bidding strategies.
How to access:
Go to “Insights & Reports”
Click the “Auction insights” tab
Select the campaigns or ad groups you want to analyze
What to look for:
- Impression share
- Overlap rate with competitors
- Outranking share
Daily metrics to track:
- Changes in impression share
- Auction insights score
- Position above rate
Pro tip: Monitor these metrics daily, but focus on weekly trends to make strategic decisions about your competitive positioning.
Placement Analysis Report
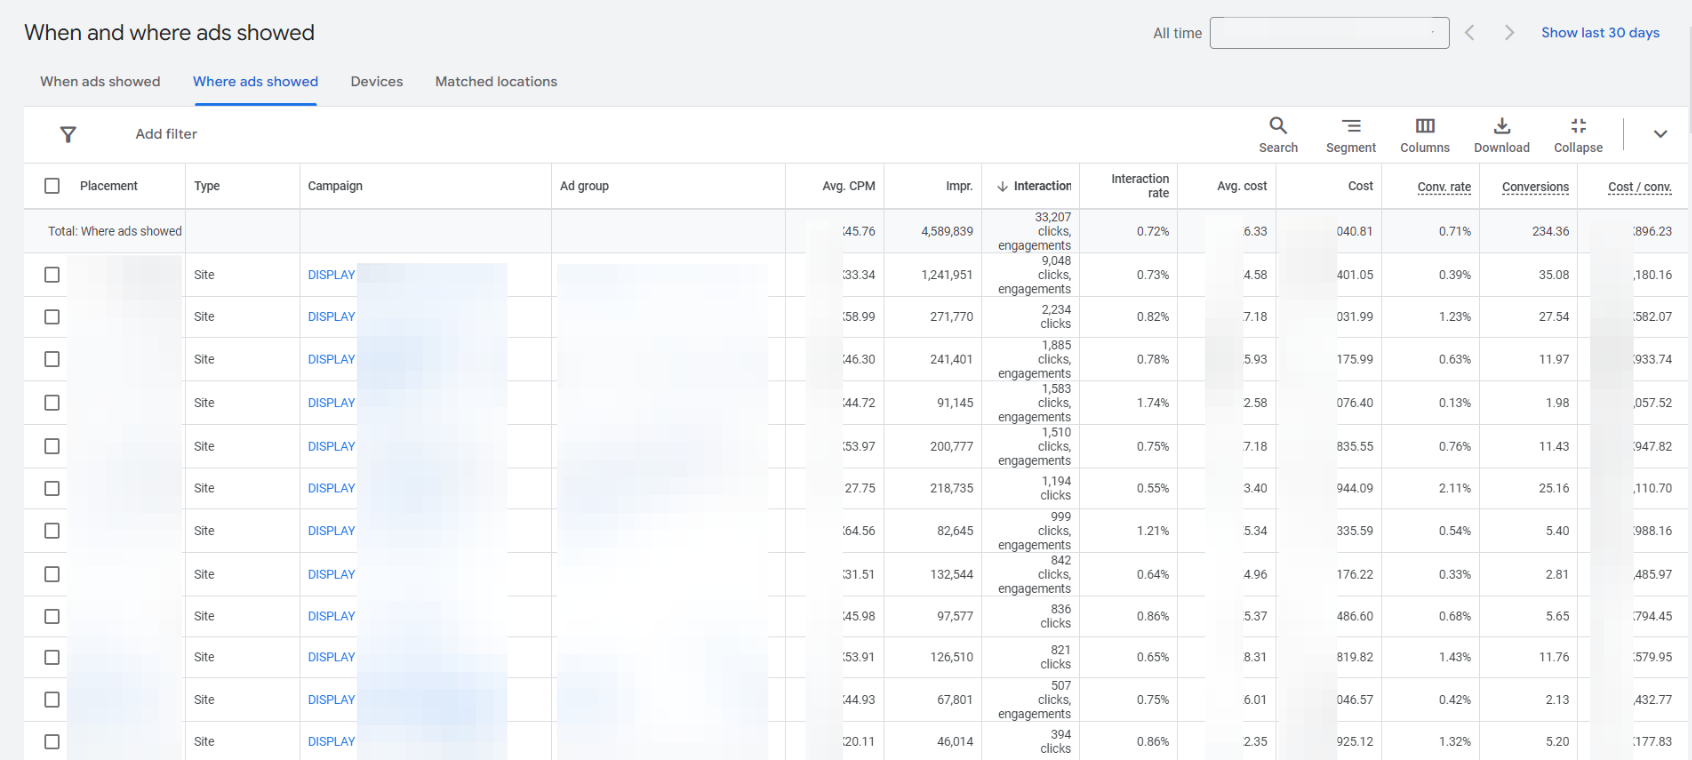
The Placement Analysis Report shows where your ads are appearing across the Google Display Network and YouTube.
For ecommerce businesses, this report is important for understanding which websites, apps, and videos are driving the best results for your display and video campaigns, helping you optimize your ad placements for better performance and ROI.
How to access:
Go to “Insights & Reports” in the left-hand menu
Click on “When & Where Ads Shown”
Select “Placements” under the “Where ads showed” section
What to look for:
- Top-performing placements
- Placements with high impressions but low conversions
- Placements with high click-through rates (CTR)
Daily metrics to track:
- Conversion rate by placement
- Cost per conversion for each placement
- Click-through rate (CTR) for top placements
Pro tip: Use the placement exclusion tool to remove underperforming websites or apps that are consuming your budget without delivering results.
FAQ: Google Ads Ecommerce Reports for Daily Tracking
Here are the most frequently asked questions about Google Ads ecommerce reports for daily tracking:
What are the key Google Ads reports for ecommerce?
The key Google Ads reports for ecommerce include the Shopping Campaign Performance Report, Product Performance Report, Search Terms Report, Audience Report, Device Performance Report, Geographic Performance Report, Time of Day and Day of Week Report, Auction Insights Report, and Placement Analysis Report.
How can I track Google Ads conversions for ecommerce?
You can track Google Ads conversions for ecommerce by ensuring your conversion tracking is properly set up. This involves integrating Google Tag Manager, Google Analytics, and enabling conversion actions within your Google Ads account for accurate conversion reporting.
Can I use Google Ads to track store visits?
Yes, Google Ads can track store visits if you have location extensions enabled and meet the eligibility criteria. The Store Visits metric is a valuable tool for businesses with physical locations, providing insights into how online ads drive in-store traffic.
How do I access my Google Ads locations list?
You can access your Google Ads locations list by navigating to the Geographic Performance Report under the Insights & Reports section. This report provides a breakdown of how your ads perform in different geographic locations, helping you optimize your location-based Google Ads strategies.
What is Google Ads geofencing, and how does it work for ecommerce?
Google Ads geofencing allows you to target ads to specific geographic areas. For ecommerce, this feature helps you focus on high-performing locations or local markets, increasing ad relevance and conversion rates in specific areas.
How do I monitor Google Ads conversion reporting?
To monitor Google Ads conversion reporting, regularly check your Conversion column in your campaign dashboard. You can also view specific conversion actions and analyze performance through the Conversions section in Google Ads.
Can I use Google Ads to target specific locations for my ecommerce store?
Yes, you can use Google Ads to target specific locations by setting location targeting at the campaign level. Use the Geographic Performance Report to review how different regions respond to your ads, and adjust bids or targeting for high-value locations.
How does Google Ads login affect my daily reports?
Google Ads login provides access to your entire campaign dashboard, including key reports for ecommerce. Ensure you log in daily to review performance metrics, make adjustments, and monitor your ad spend and conversion rates.
How does Google Analytics integrate with Google Ads for ecommerce tracking?
Google Analytics integrates with Google Ads by sharing data between both platforms. This integration allows you to track ecommerce performance, conversion actions, and customer behavior across your ads, giving you deeper insights into your campaigns.
What is the best way to track daily performance for location-based Google Ads?
The best way to track daily performance for location-based Google Ads is to use the Geographic Performance Report. It shows how your ads are performing in different regions, allowing you to make adjustments based on high-conversion locations or underperforming areas.
Conclusion
When you consistently track these key Google Ads reports for ecommerce, you stay on top of your campaigns and make timely adjustments to improve performance.
By regularly monitoring your Google Ads ecommerce reports for daily track, you ensure that you’re always optimizing for success.
Bonus Content: If you found our post on Google Ads ecommerce reports for daily track useful, you might also be interested in these related articles:
- Product Performance Analysis in Google Ads
- How to Fix “Some Of Your Pages Are Not Tagged” in GTM, GA4, or Google Ads
- Linking GA4, Search Console, and Merchant Center to Google Ads
- Fixing “Additional Domains Detected For Configuration” Warning
- Server-Side Tracking: Your Solution to Privacy Challenges
- Implement Consent Signals’ Warning Explained
- The Difference Between the Item Revenue and Purchase Revenue in GA4
- Checkout Journey Report in GA4