Getting the most out of Shopify Analytics is essential for your store’s success. This guide tackles the top questions about Shopify Analytics covering:
- Shopify vs. Google Analytics: The features each platform offers, from Shopify’s easy use and straightforward reports to Google’s detailed analysis and custom funnel reports.
- What Shopify Analytics Offers: Quick insights into sales, customer behaviour, and which products are doing well.
- Key Features: From tracking daily sales to understanding where your customers come from, and more.
- Customizing Capabilities: Reports that fit exactly what you need, especially if you’re on Shopify Advanced or Plus plans.
- Beyond Basics: Insightful information about when you might need more detailed info that tools like Google Analytics can provide.
- Important Metrics: The must-know metrics that Shopify Analytics tracks, helping you see how your store is doing at a glance.
- Solving Data Discrepancies: Reasons for data discrepancy and potential solutions to deal with it.
After reading this guide, you’ll be better prepared to use Shopify Analytics to its fullest, ensuring your store thrives by making data-driven decisions.
Frequently Asked Questions About Shopify Analytics
Here are the most frequently asked questions about Shopify Analytics, and their answers:
Is Shopify Analytics better than Google Analytics?
The answer to this question should be more about which tool is more suited to your specific needs as a Shopify store owner.
To make a good decision, you need to thoroughly understand what these two powerful platforms provide and how they deliver it.
| Shopify Analytics Features | Google Analytics Features |
| Direct integration with the ecosystem | Custom reports, funnels, segmentation |
| Simplicity - no setup process needed | In-depth ecommerce data analysis |
| A dashboard with reports in card view | Cross-domain tracking & reporting |
| Built-in reports in various categories | Enhanced conversion tracking |
| Quick and easy data comparisons | Important ecommerce metrics and events |
| Enhanced measurement | |
| Comprehensive view of user behaviour | |
| More detailed ecommerce reports | |
| Predictive insights |
To summarize, Shopify Analytics provides straightforward insights that you can check out in your day-to-day performance tracking:

Google Analytics 4 allows for broader & more detailed analyses of your store’s ecommerce performance, with more granular data & reports:
Therefore, the answer to the question depends on your specific needs, expertise in data analysis, and the depth of insights you require.
Do I need Google Analytics if I use Shopify Analytics?
Having both Shopify Analytics and Google Analytics for your Shopify store can be beneficial, as each platform provides insights that can complement your needs.
To be more specific, Shopify Analytics can give you a quick, user-friendly overview of your store’s performance, including sales, customer behavior, and product performance.
It’s tailored specifically for the Shopify platform, ensuring that you have immediate access to basic ecommerce metrics and reports, without any specific setup.
Google Analytics, on the other hand, offers a more detailed analysis of user behavior and ecommerce events overall through an event-based structure.
You can get a deeper analysis of your ecommerce funnels, specific user actions, and how effectively different marketing channels drive conversions.
It provides a granular view of user interactions, allowing for sophisticated tracking setups such as event tracking, conversion paths, and cross-domain tracking.
The bottom line is that while Shopify Analytics is excellent for immediate basic insights, integrating Google Analytics can significantly improve your understanding of customer behavior and site performance, leading to more informed business decisions.
What are key metrics to track in Shopify Analytics?
Here are some crucial ecommerce metrics that you can track to evaluate your store’s performance in Shopify Analytics:
- First-Time Purchasers (Customer Type)
It lets you track new customers to the store, offering insights into the effectiveness of demand generation programs.
Importance: A vital metric for understanding market expansion and customer acquisition success.
- Average Order Value (AOV)
It measures the average amount spent each time a customer places an order.
Importance: Helps you determine profitability and strategise on customer acquisition costs.
- Sales by Channel
It breaks down sales according to the channel, such as online store, POS, etc.
Importance: Enables targeted marketing efforts by identifying the most lucrative sales channels.
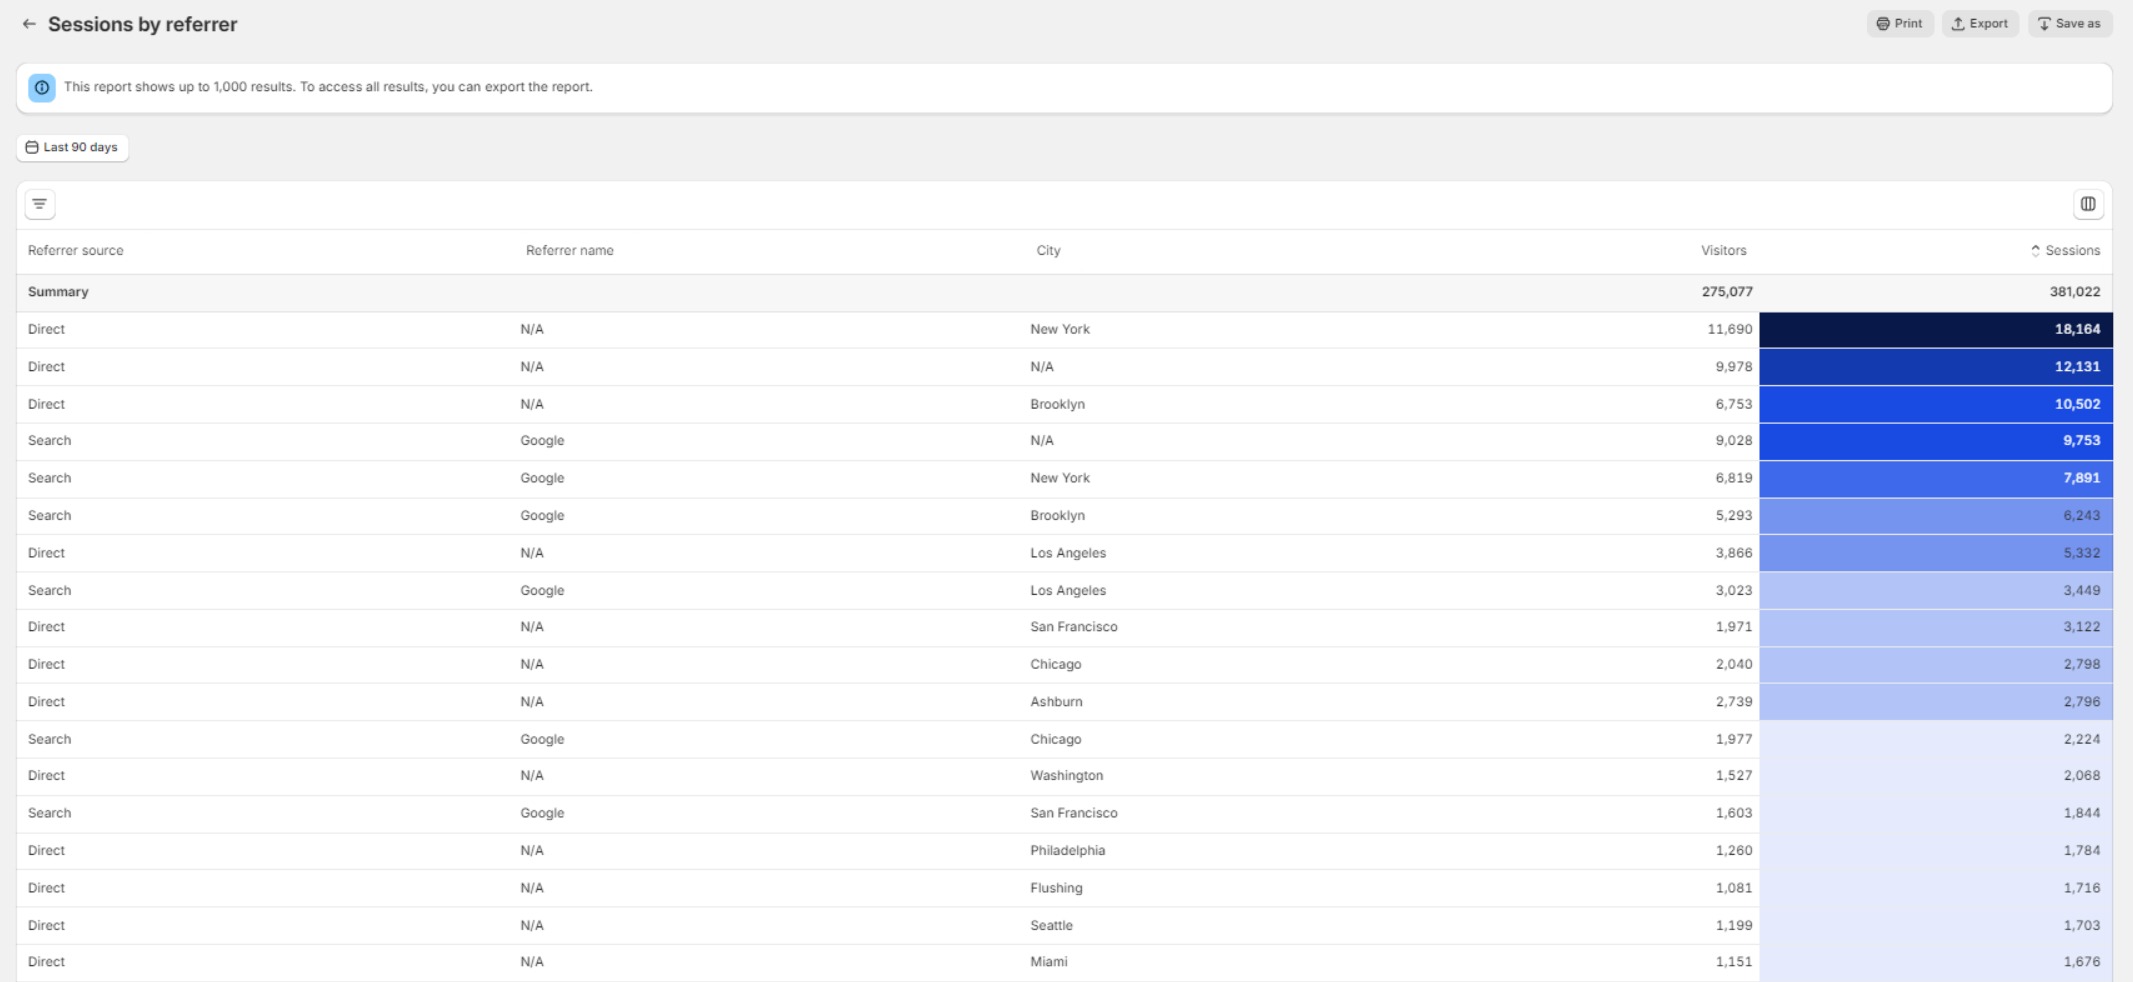
- Traffic Referrer Source
It shows where your sales are coming from, categorizing sources as social, email, direct, search, or unknown.
Importance: Helps you optimize marketing strategies based on the most effective referral sources.
- Conversion Rate
It provides you with the percentage of website visitors who complete certain actions such as add to cart, reach checkout, etc.
Importance: Low conversion rates might indicate issues with website design, products, or the checkout process, while high rates suggest effective user engagement.
- Canceled
This metric tracks the amount of sales that result in cancellations, acting as an indicator of product satisfaction.
Importance: Helps you see products that may not meet customer expectations, guiding decisions on inventory adjustments or removals.
- Product Type
It helps you identify which types of products are selling well and which are not.
Importance: Guides marketing strategies to boost sales of slower-moving products.
- Top Products Sold
This highlights the most popular products by sales volume.
Importance: Essential for inventory management to prevent stockouts of popular items. Also, it can give you ideas to optimize your marketing efforts.
- Total Sales
This represents the total revenue of your Shopify store over a specified period, highlighting peak sales periods, most successful products, etc.
Importance: Allows you to identify trends, prepare inventory for peak times, and focus on high-performing products.
- Net Sales
It is calculated as total sales minus discounts, returns, shipping costs, and allowances for damaged goods. It shows the actual revenue generated.
Importance: Influences product pricing, inventory decisions, and indicates the health of sales after subtracting sales deductions.
- Shipping
It monitors shipping costs, including charges, discounts, and refunds.
Importance: It might help you with delivery expenses and pricing strategies.
- Tax
It tracks the total amount spent on taxes for orders.
Importance: Significant for financial planning and compliance with tax obligations.
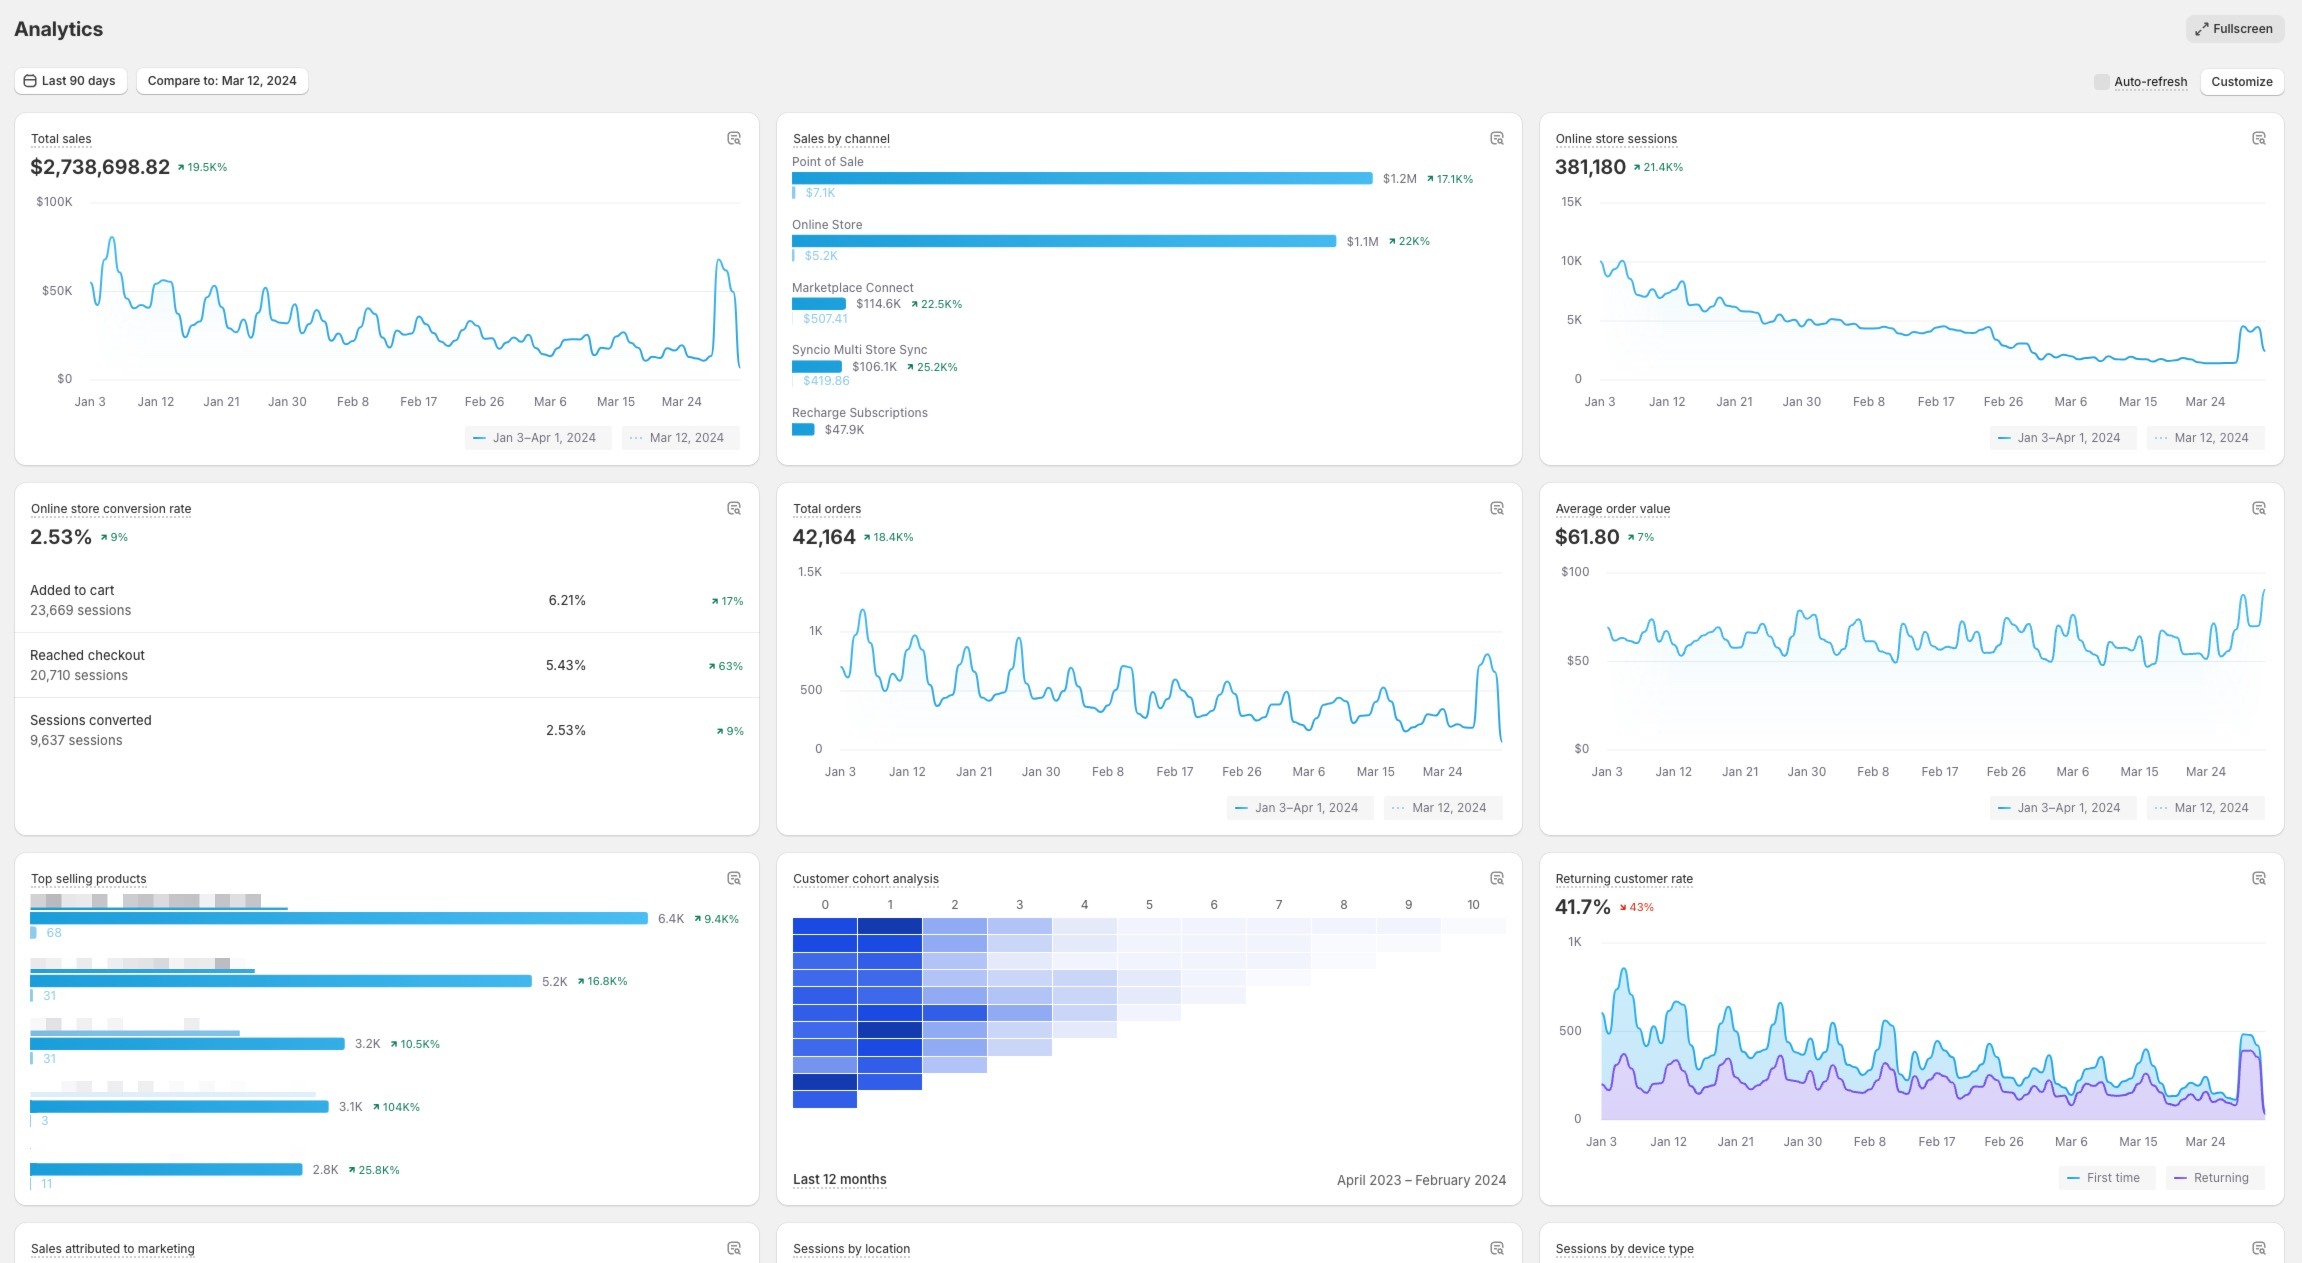
What does the Shopify Analytics dashboard let me see?
Offering quick insights in card view, Shopify Analytics dashboard serves as a central hub for monitoring your store’s overall performance.
As a built-in tracking & reporting tool, it offers a comprehensive overview of your store’s key performance indicators (KPIs) at a glance.
Here are some of the critical insights you can see directly from the dashboard:
 While it displays reports by default, you can customize the dashboard to focus on the metrics that matter most to your business, ensuring relevant data is always front and center.
Overall, the Shopify Analytics dashboard is designed to highlight actionable insights, helping merchants make data-driven decisions quickly.
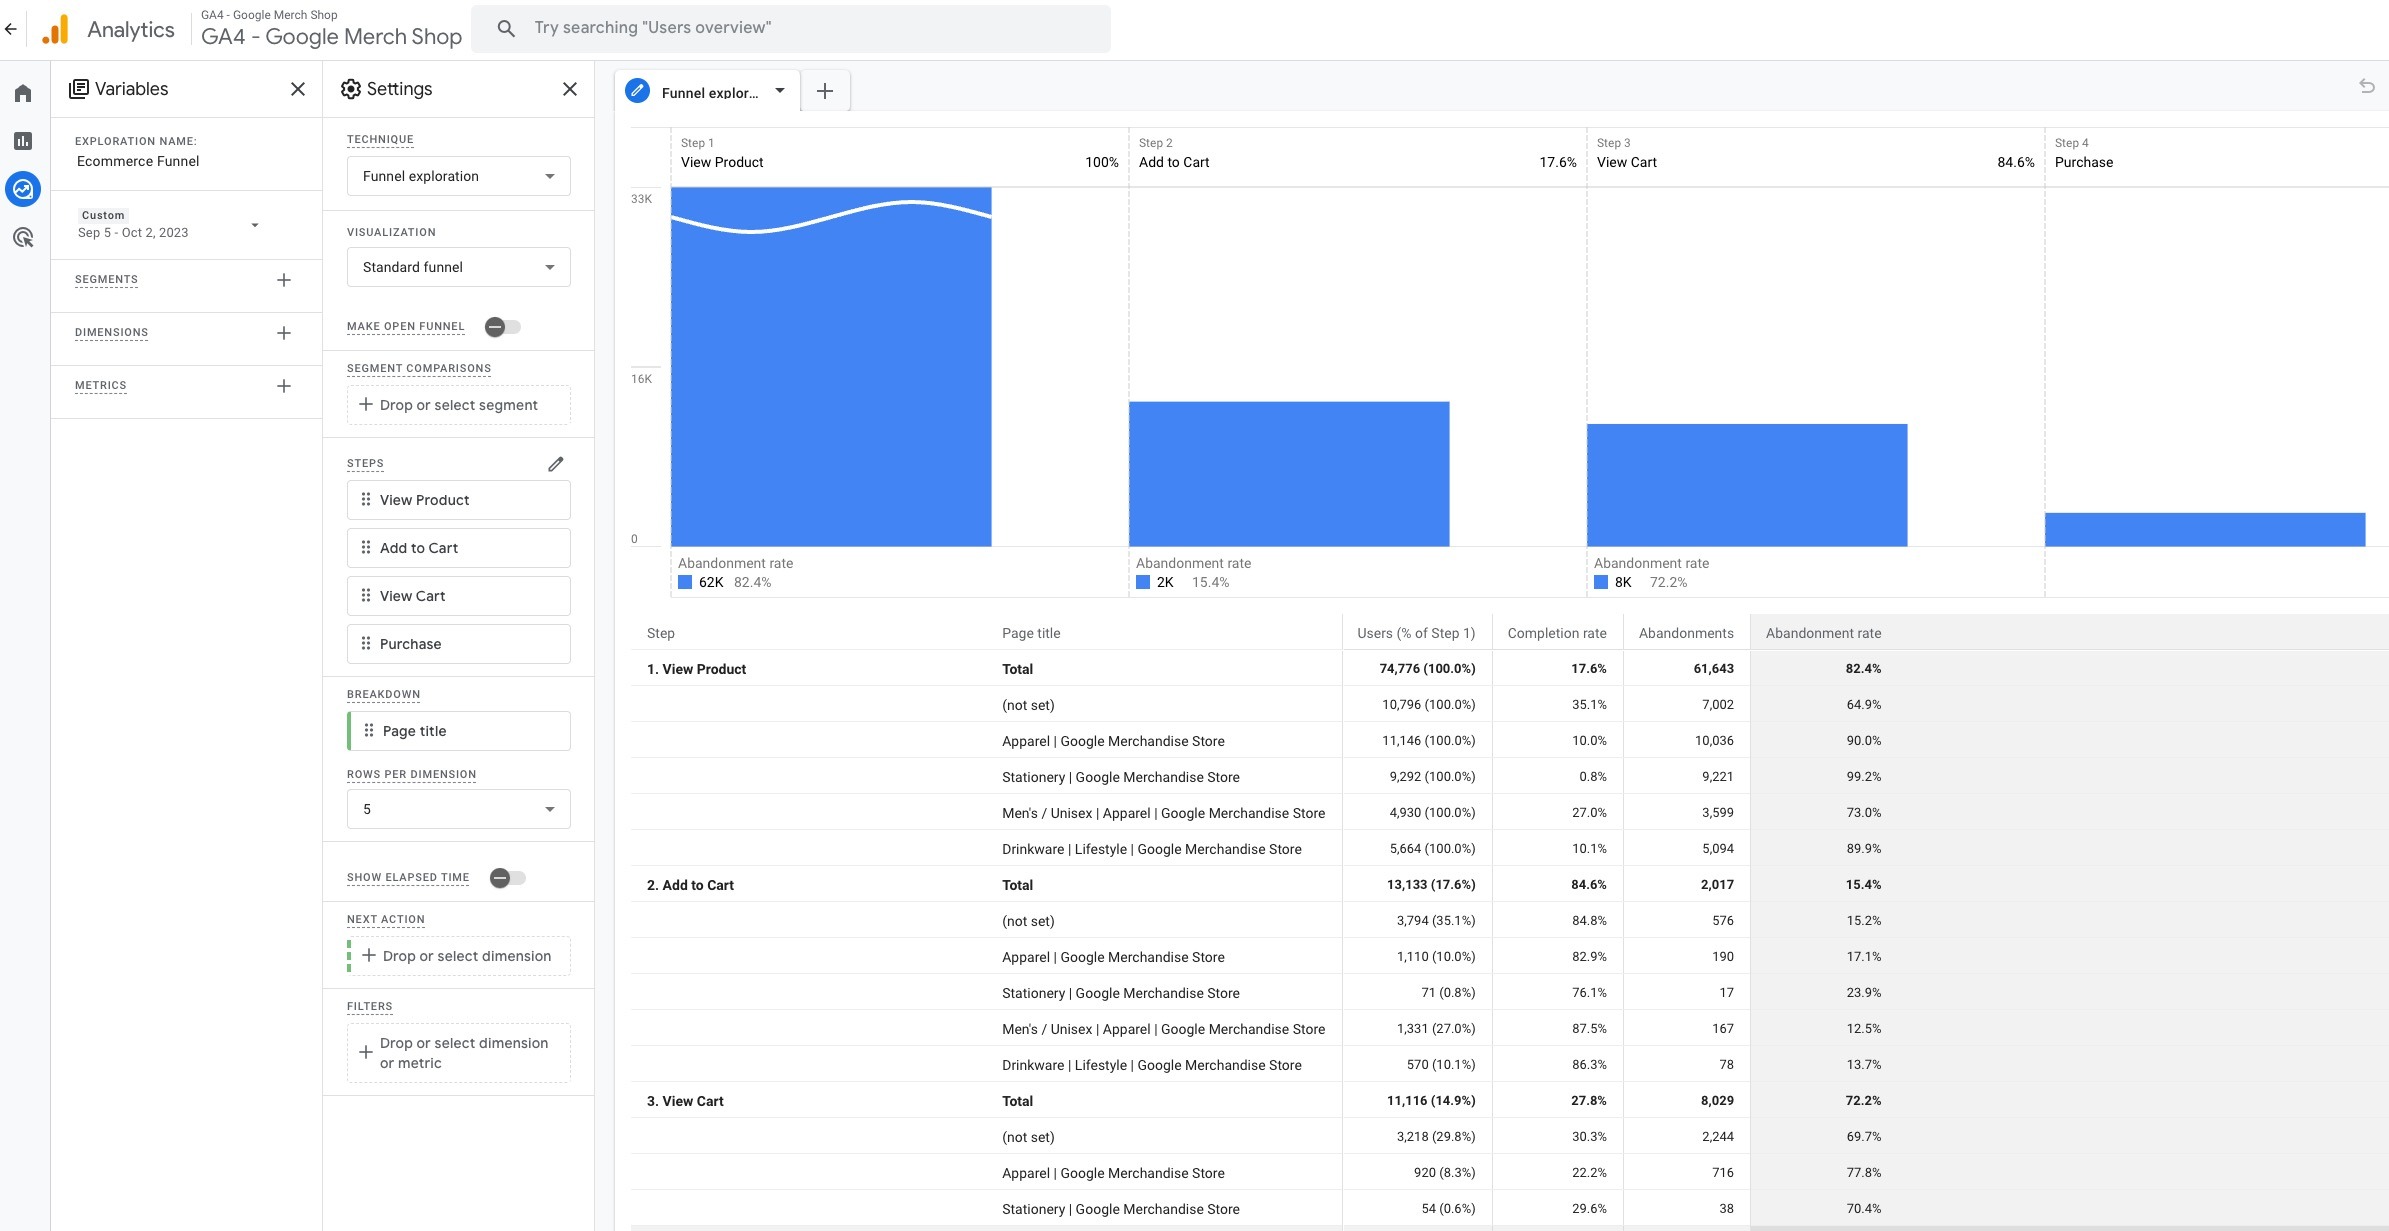
Does Shopify analytics provide sales funnel reports?
Sales funnel reports are crucial for understanding the customer journey from initial engagement to final purchase, including identifying at which stages potential customers drop off.
However, Shopify Analytics does not provide sales funnel reports directly within its dashboard or reporting features.
To get access to insightful sales funnel reports, you should integrate your Shopify store with Google Analytics 4.
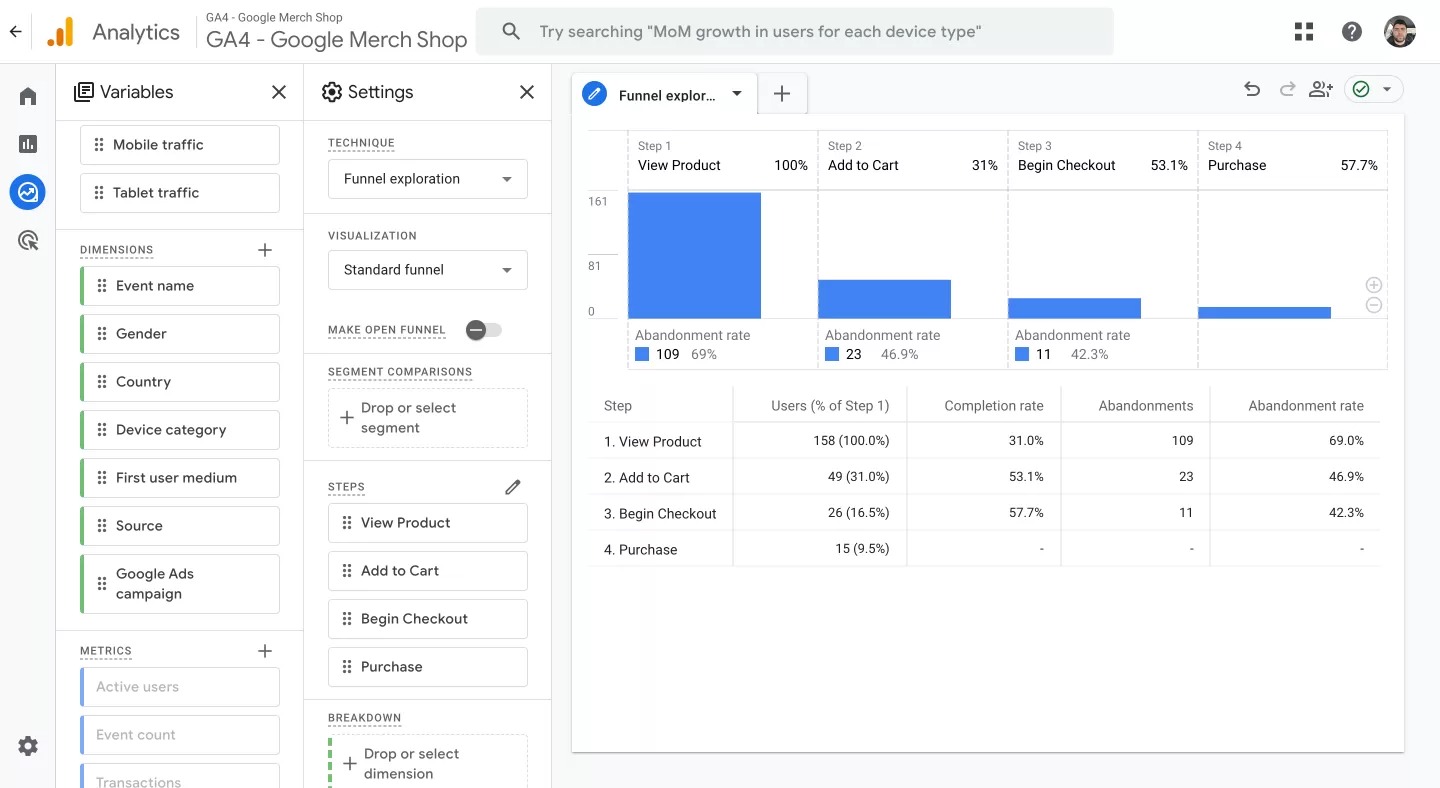
With Google Analytics 4, you can create custom ecommerce funnel reports to get the in-depth insights needed to optimize your sales processes and improve conversion rates.
It will provide you with:
Comprehensive Customer Journey Insights: You can map the entire customer journey, from the first visit to conversion. This comprehensive view helps identify where potential customers drop off, enabling targeted improvements.
Customization and Flexibility: You tailor your funnel analysis to specific business goals, customer segments, or campaigns. This flexibility ensures you’re always focusing on the metrics that matter most to your business.
Advanced Segmentation and Analysis: With GA4, you can segment funnel data by user attributes, such as demographics or source medium, to identify high-value customer segments or pinpoint which marketing channels are most effective at driving conversions.
This way, you can better understand and optimize your sales process, tailor your marketing strategies more effectively, and ultimately drive better business outcomes.
Can I create custom reports in Shopify?
Yes, you can create custom reports in Shopify, but it depends on your Shopify plan.
Custom report creation is a feature available to merchants on the Shopify Advanced and Shopify Plus plans.
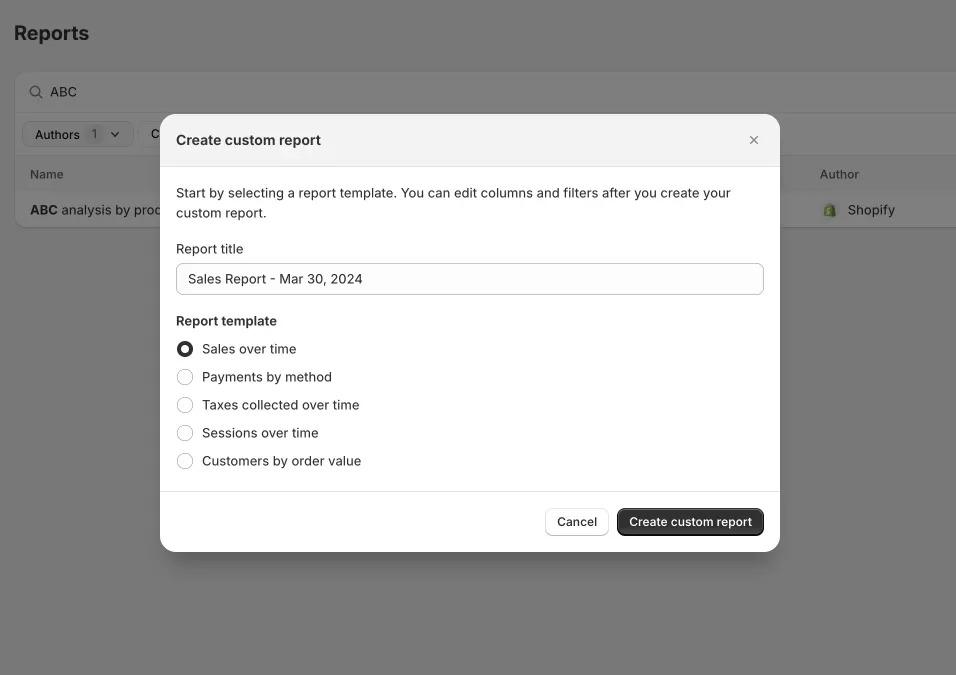
This allows you to delve deeper into your store’s data beyond the standard reports, tailoring insights to your specific business needs.
However, you should keep in mind that you can only create custom reports from the templates provided as you can see in the screenshot above.
That’s to say if you create a “Sales over time” custom report, you can add more metrics according to your specific needs and save the report.
This way, you don’t have to add the same metrics one by one again to find what you are looking for the next time.
Also, although these reports provide a wealth of information for day-to-day tracking, they might not be as insightful & detailed as GA4 reports that are tailored for deeper ecommerce data analysis.
Is Shopify analytics good for ecommerce tracking?
Shopify Analytics can be considered adequate for basic day-to-day ecommerce tracking, offering a straightforward way to monitor essential metrics such as sales, customer behavior, and traffic sources.
It’s user-friendly and integrates seamlessly with your Shopify store, making it a convenient tool for quick checks and updates on your store’s performance.
However, when it comes to more detailed tracking needs, such as analyzing complex sales funnels, customer journey mapping, or specific marketing campaign effectiveness, Shopify analytics might not fully meet your requirements.
While it provides a good foundation, if you look for in-depth analysis or tailored reporting, you might find it necessary to supplement Shopify Analytics with more specialized tools or services that can offer the granular insights needed for advanced e-commerce tracking and decision-making.
How does analytics for Shopify work?
Shopify Analytics works by collecting data from various interactions on your Shopify store, including visitor behavior, sales transactions, product performance, and customer engagement.
It automatically integrates with your store and starts collecting data once you set up your store, using cookies and tracking codes to monitor user activities, such as page views, purchases etc.
Then, all the data tracked is presented to Shopify merchants through reports that come in various categories and formats.
These are crucial for identifying trends, understanding customer behavior, and making informed decisions about your store’s marketing, sales, and product strategies.
Why is there a data discrepancy between Shopify and GA4?
Data discrepancies between Shopify and Google Analytics 4 (GA4) are not uncommon and stem from a variety of factors, each affecting the precision of data tracking and analysis. Understanding these causes is essential for identifying effective solutions to minimize discrepancies.
Main Causes of Discrepancy
- Incorrect Google Analytics Setup: A common mistake, especially for those new to data analytics. An improper setup can lead to inconsistent data, impacting marketing efforts negatively.
- Incomplete Migration to GA4: Switching from Universal Analytics to GA4 without properly associating properties or failing to compare UA and GA4 data correctly can cause discrepancies.
- Adblockers, VPNs, and Special Browsers: A significant portion of internet users employ ad blockers, VPNs, or browsers that can prevent Google Analytics from collecting data, leading to discrepancies.
- User Consent (GDPR/CCPA): Legal requirements for user consent before tracking can interrupt data flow, albeit this type of discrepancy is considered acceptable under regulations.
- iOS & Safari Limitations: Safari’s stringent cookie policies and iOS updates introducing Intelligent Tracking Prevention (ITP) can hinder data collection, causing inconsistencies.
- Visitors Not Fully Loading Pages: Quick navigation away from pages, especially before the “Thank You” page loads after a transaction, can result in unreported data.
- Shopify Apps for Subscription & Upsell & Checkout: These apps may disrupt Shopify’s native flow, causing tracking issues.
- Custom Page Builder Apps: Apps like Pagefly and Gempages require special Google Analytics integration to track data accurately on their pages, which can be challenging.
Solutions to Data Discrepancy
Analyzify – Data Analytics for Shopify: Provides a comprehensive solution for Shopify stores, helping to mitigate most potential problems with a guided setup, complete ecommerce tracking, and real-time troubleshooting.
Server-Side Tagging with Analyzify: Addresses issues caused by adblockers and browser privacy features, offering control over data collection and enhancing data security and page speed.
Expert Help: Shopify Experts, agencies, or freelancers can offer specialized assistance for specific issues, providing a quick and effective resolution.
For more information, please explore the most common Shopify & Google Analytics tracking issues and solutions.
How to use Shopify analytics for analysis?
To effectively use Shopify Analytics for analysis, it’s important to familiarize yourself with the various reports it offers and understand how they can inform and improve your store’s performance. Here is a guide on how to approach this:
Analyzing Traffic and Behavior
- Segment Traffic Sources: Break down your traffic by source (e.g., organic search, social media, direct visits) to pinpoint which channels are most effective at bringing visitors who convert. Tailor your content and marketing strategies to double down on these channels.
- Examine Page Performance: Identify which pages have the highest exit rates and lowest time spent. Consider redesigning these pages, improving content, or making offers more prominent to enhance user engagement.
Financial Performance Optimization
- Track Profit Margins: Use the profit reports to identify products with the highest and lowest margins. Adjust pricing strategies or negotiate better supplier deals for low-margin products.
- Analyze Discount Impact: Evaluate how discounts are affecting your overall profitability. If discounts are leading to lower profit margins without increasing customer loyalty or average order value, reconsider your discount strategy.

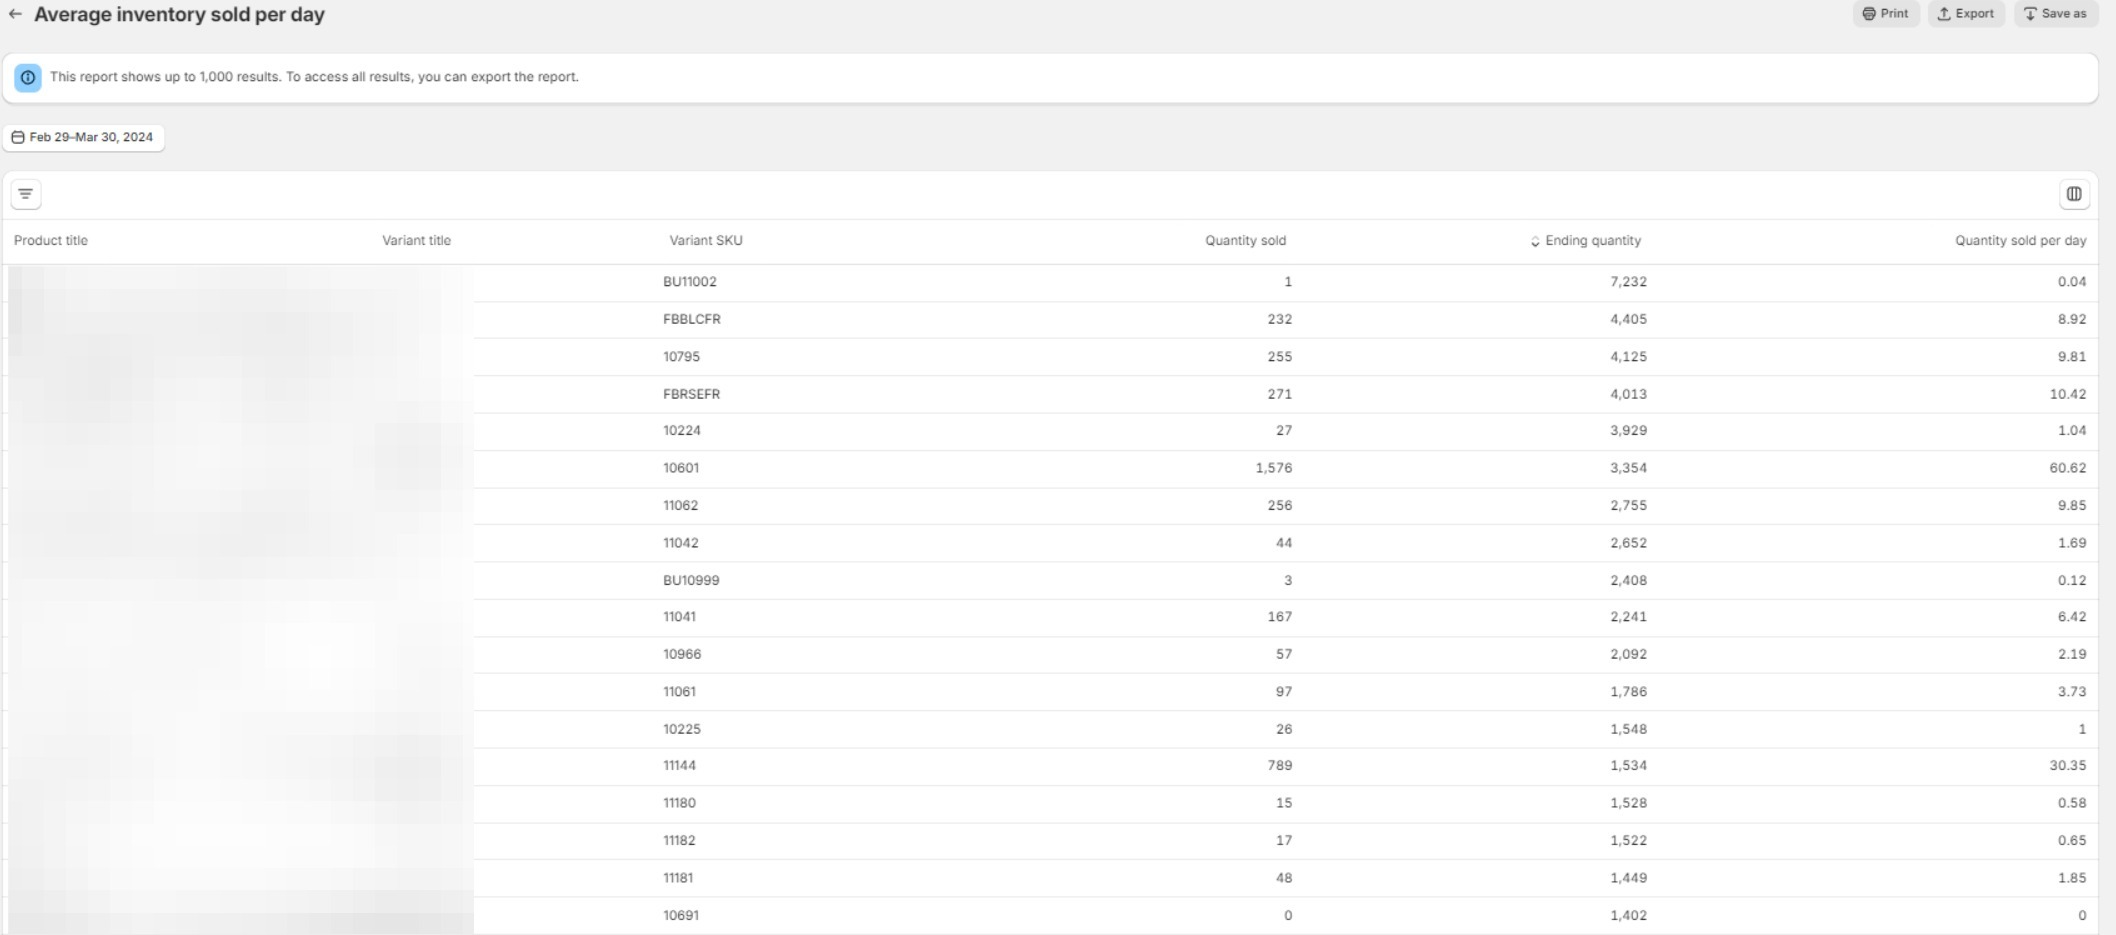
Inventory Management with Data
- Product Performance Analysis: Use inventory reports to identify your best-selling products and those that are underperforming. Consider bundling underperformers with popular items to clear stock.
- Demand Forecasting: Analyze sales trends to predict future product demand. Adjust your inventory levels accordingly to avoid stockouts or excess inventory, optimizing your cash flow and storage costs.
By focusing on these specific strategies, you can use Shopify Analytics not just as a tool for observing what has happened, but as a powerful asset in planning and executing more effective business strategies.
How to check product performance reports on Shopify?
When analyzing product performance reports on Shopify, it’s crucial to focus on specific metrics and reports that give you actionable insights into your store’s operations and product lineup.
Some Questions to Answer Through Analysis
- Which products are contributing the most to sales, and why?
- Are there products with unexpectedly high return rates, indicating potential issues with quality or customer expectations?
- How do discounts and promotions affect the average order value and product profitability?
- Are there noticeable trends in product demand that could inform inventory restocking and marketing strategies?
- Which products are frequently bought together, suggesting potential bundling opportunities?
And more.
To learn how to make a product performance analysis on Shopify, please check out our comprehensive guide: Product Performance Analysis with Shopify Analytics [2024 Guide].
What is ABC analysis in Shopify?
ABC analysis in Shopify is a method of categorizing product variants into three distinct groups (A, B, and C) based on their contribution to revenue. This strategic approach helps in prioritizing inventory management efforts and making stronger decisions on marketing and promotions.

Here’s a breakdown of the categories:
A-grade Products: These are your top performers, contributing to 80% of your revenue. The focus for these products should be on ensuring they are always in stock and prominently featured in your marketing efforts. This category usually comprises a small percentage of your inventory but generates the majority of your sales.
B-grade Products: These are moderate contributors, accounting for 15% of your revenue. Although they don’t generate as much income as A-grade products, they still play a significant role in your overall sales. Strategies for B-grade products might include targeted promotions or bundling with A-grade items to increase their visibility and sales potential.
C-grade Products: These items contribute the least to revenue, making up only 5% of it. They might be necessary for portfolio completeness or to cater to specific customer segments but don’t significantly impact overall sales. For C-grade products, consider reducing stock levels, discontinuing underperformers, or using them in clearance sales to free up inventory space for more profitable items.
How to see top sellers on Shopify?
To see the top sellers on Shopify, you can utilize the “Sales by Product” report within Shopify Analytics. This valuable tool provides a comprehensive overview of your products’ sales performance, helping you identify which items are leading in sales and generating the most revenue.
Here’s how to access and make the most of this report:
Navigate to Shopify Analytics: Log in to your Shopify admin dashboard.
Go to Reports: Find the Analytics section on the sidebar and click on “Reports.”
Locate the Report: Scroll down to the “Sales” category and select “Sales by product.”
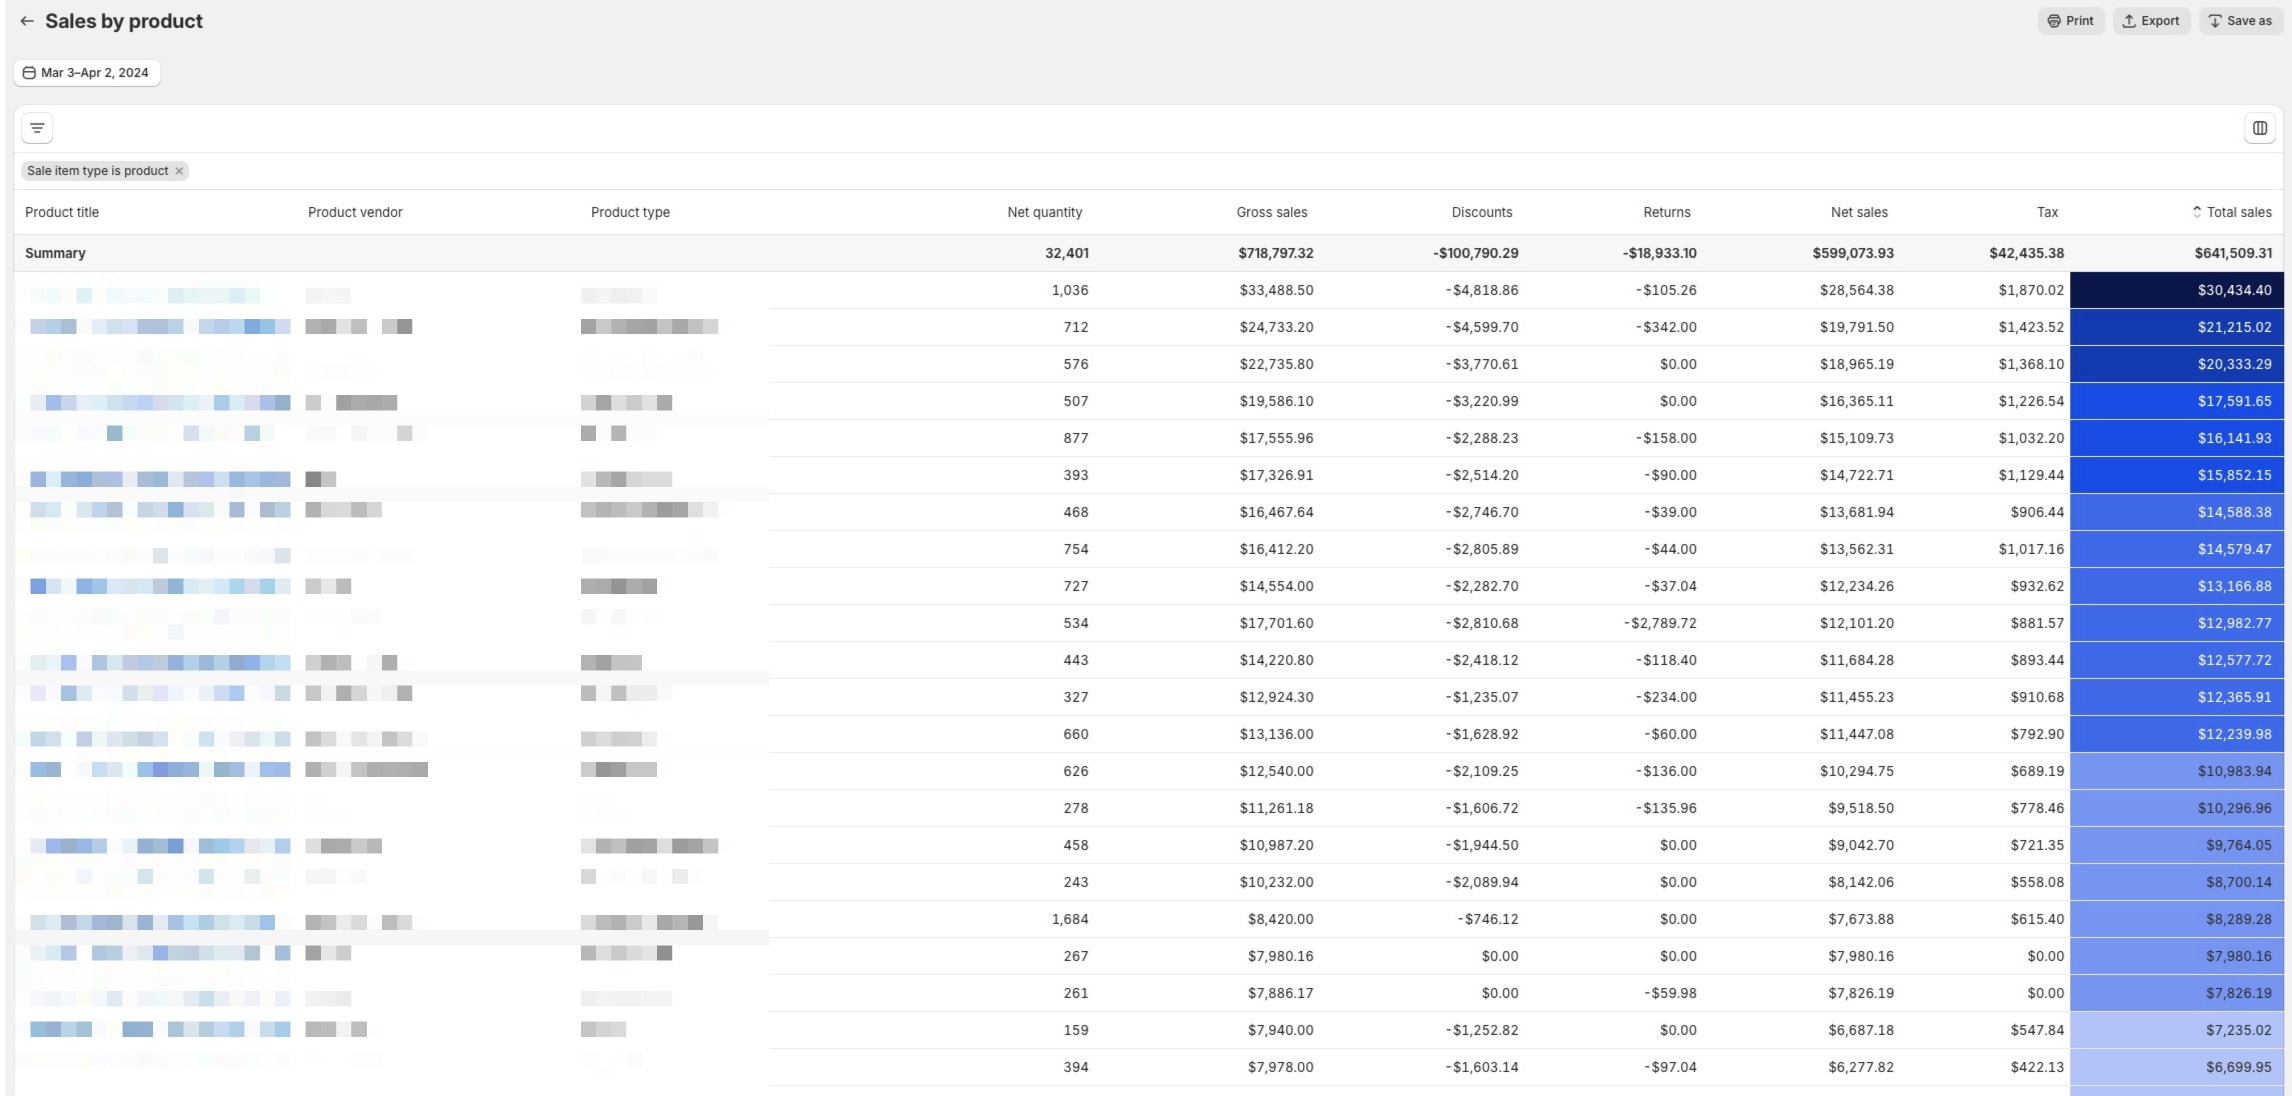
Analyzing Top Sellers This report answers critical questions about your product lineup, such as:
- Top Selling Products: Identifying which products are your best sellers.
- Impact of Discounts: How sales promotions affect the performance of specific products.
- Return Rates: Which products are returned most frequently and might require attention.
- Product Variant Performance: Comparison of different variants to see which ones are favored by customers.
- Contribution to Overall Sales: Understanding how each product contributes to your total revenue.
Customizing the Report
For deeper insights:
Add More Metrics: Use the Filter and Column icons to customize the report. You can add additional metrics such as “Profit,” “Cost of Goods Sold,” or “Inventory Levels” to get a more detailed view of your top sellers’ performance.
Analyze Trends: Look for patterns in sales over different periods to understand seasonal trends, the impact of marketing campaigns, or changes in consumer preferences.
How can I see my sales from Klaviyo at the product level?
To gain insights into your sales performance from Klaviyo email campaigns at the product level, follow these steps:
1. Ensure Klaviyo and Shopify Integration: First, make sure that Klaviyo is properly integrated with your Shopify store. This integration is essential for tracking customer behaviors, including purchases made through Klaviyo email campaigns.
2. Navigate Through Analytics: From the left-hand side menu, follow this sequence: Analytics > Reports > Sales by Product. This will take you to the report section where you can analyze your sales data.
3. Access Filter Options: In the report view, click on the three lines located on the left side of the screen to open the filter menu.

4. Set Filters for Klaviyo Sales:
- In the first filter box, select “Referring Platform.”
- In the second filter box, enter “Klaviyo.”
- Click on “Apply Filters” to update the report with your specifications.
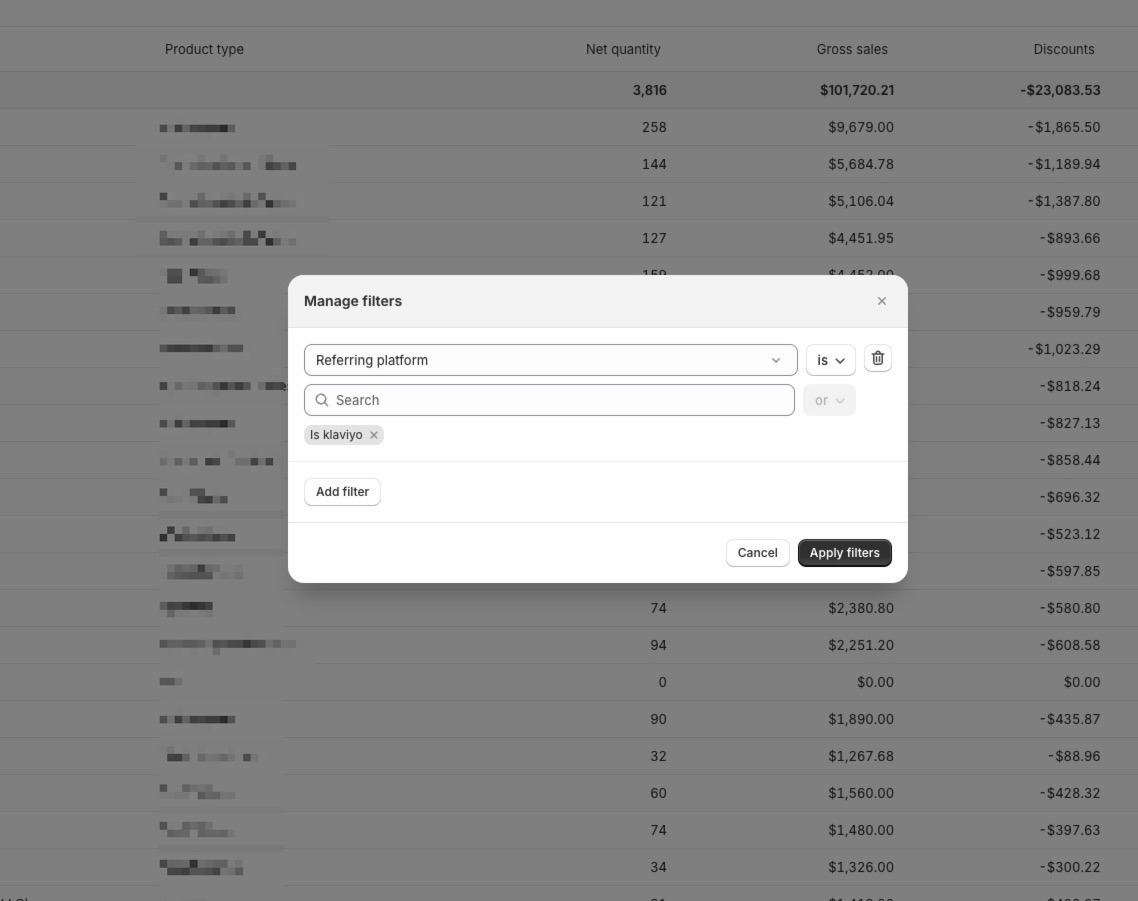
5. Viewing Sales Data: You can now see sales generated from Klaviyo at the product level. If desired, you can select a specific date range from the top left corner to narrow down the data for a particular period.
How can I see my sales by channels on a product level?
Understanding your sales distribution across different channels on a product level can provide valuable insights into your marketing and sales strategy effectiveness. Here’s how to do it:
1. Access Analytics: First, click on “Analytics” from the menu on the left-hand side. This section houses various analytical tools and reports that can help you gauge your store’s performance.
2. Find the Sales by Channel Graph: On the ensuing screen, you’ll see the “Sales by Channel” graph. This visual representation gives an immediate overview of which channels are driving sales.
3. View Report: For a more in-depth analysis, click on the “view report” option located in the top right corner of the graph. This will expand the data and provide more detailed insights.
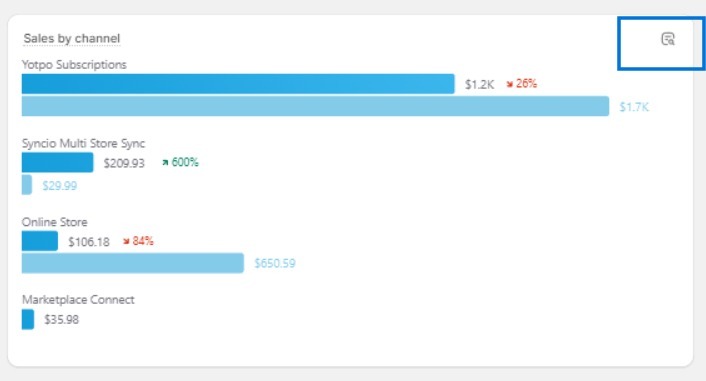
4. Customize Time Range: By clicking on the box on the left side, you can select a specific time range to analyze sales that occurred within that period, based on channels.
By following these steps, you can analyze sales by channel at the product level, clearly identifying sales sources.
How to add Google Analytics to your Shopify store?
Google Analytics 4 is a great tool, but you need a solid Shopify GA4 integration to take full advantage & get all the reports and accurate results based on your data.
To integrate Shopify & GA4, you have a couple of options:
The Google Sales Channel app, a native solution to provide you with ecommerce events and parameters on your Shopify store.
Analyzify, a Shopify app distinguished by having the most reviews in its category, has been providing a comprehensive GA4 integration for Shopify for the past two years, culminating in a community of more than 2000 satisfied customers.
Other Shopify GA4 Apps, a collection of various solutions that offer different features and levels of GA4 integration for Shopify, broadening the spectrum of choice based on individual needs and preferences.
To learn more about how to integrate Google Analytics 4 and Shopify, you can check our Shopify GA4 Crash Course.